Abstract
In this paper, an efficient procedure for ripeness detection of watermelon was presented. A nondestructive method was used based on vibration response to determine the internal quality of watermelon. The responses of samples to vibration excitation were optically recorded by a Laser Doppler (LD) vibrometer. Vibration data was collected from watermelons of two qualities, namely, ripe and unripe. Vibration signals were transformed from time-domain to frequency-domain by fast Fourier transform (FFT). Twenty nine features were extracted from the FFT amplitude and phase angle of the vibration signals. K-nearest neighbor (KNN) analysis was applied as a classifier in decision-making stage. The experimental results showed that the usage of the FFT amplitude of the vibration signals gave the maximum classification accuracy. This method allowed identification at a 95.0 % level of efficiency. Hence, the proposed method can reliably detect watermelon ripeness.
Keywords: Watermelon, Ripeness detection, Laser Doppler vibrometry, Fast Fourier transform, Feature extraction, K-nearest neighbor
Introduction
Nondestructive quality assessment of watermelon has been a challenge for its customers since it has different structure from the other fruits. The subjective method is usually based on the sound caused by slap, but is subject to errors. This approach requires individuals with experience (Stone et al. 1996). Researchers have studied different objective methods to evaluate the internal quality of watermelons such as acoustic and dynamic technology (Armstrong et al. 1997; Diezma-Iglesias et al. 2002; Jamal et al. 2005; Stone et al. 1996; Yamamoto et al. 1980), electrical and magnetic technology (Kato 1997; Nelson et al. 2007), X-ray and computed tomography (Tollner 1993) and near infrared (NIR) spectroscopy (Flores et al. 2008; Ito et al. 2002). A comprehensive overview of the nondestructive testing for determining internal quality of watermelons was provided by Sun et al. (2010).
In this paper, Laser Doppler Vibrometry (LDV) technology was used to achieve the vibration spectrum of watermelon. Investigations have been performed to apply the LDV for evaluating texture and ripeness of some fruits such as Oveisi et al. (2012). The samples were excited and the vibration responses of the fruits were detected. Some researchers used phase shift between input and output vibration signals in predetermined frequencies. They found relationship between phase shifts at predetermined frequencies and some quality indices of fruit (Muramatsu et al. 1999). Resonant frequencies were also considered as function of maturity (Landahl and Terry 2012; Muramatsu et al. 2000). Elasticity index was extracted from frequency response obtained by LDV. This factor was calculated using the second resonance frequency and the mass of the fruit. It showed good correlation with some properties (Terasaki et al. 2001; Motomura et al. 2004; Terasaki et al. 2006; Taniwaki et al. 2009a, b, c). Partial least square analysis of LDV spectrum data was carried out to evaluate some physical properties and post harvest variables (Bengtsson et al. 2003; Sakurai et al. 2005).
The data mining process for feature extraction is an approach for selecting the most suitable information. Mollazade et al. (2012) applied this technique in quality grading of raisins. Beltrán et al. (2006) used various feature extraction methods such as discrete Fourier transform together with different classification methods for Chilean wine classification. The best classification accuracy was reached (94.77 %) by using a probabilistic neural network (PNN) classifier. Omid et al. (2009) presented an intelligent system for sorting pistachio nut using feature extraction and selection, and classification techniques. FFT and principal component analysis (PCA) for feature extraction and reduction were used. Multilayer Feed forward Neural Network (MFNN) was applied to classify four native Iranian pistachio nut varieties. The best accuracy rate was 97.5 %.
The K-nearest neighbor (KNN) decision rule has been a ubiquitous classification method with good scalability. The KNN classifier is a simple non-parametric method for classification used for pattern classification applications. Choi et al. (2007) proposed a novel classifier fusion method using support vector machine (SVM), PNN and KNN in fault detection of automotive systems. Sone et al. (2012) applied PCA and KNN techniques to classify the fillets of fresh Atlantic salmon based on hyperspectral imaging. Chica and Campoy (2012) presented an appropriate procedure for discernment of bee pollen loads using computer vision and classification techniques. In this, KNN obtained a satisfactory accuracy rate in decision-making stage.
There are three criteria for evaluating the ability of a classifier in recognition and identification applications. These criteria are defined as (Lu et al. 2004):
Sensitivity: number of true positive decisions/number of actually positive cases.
Specificity: number of true negative decisions/number of actually negative cases.
Classification accuracy (or accuracy rate): number of correct decisions/total number of cases
In this research, the three criteria were used for evaluating the proposed procedure.
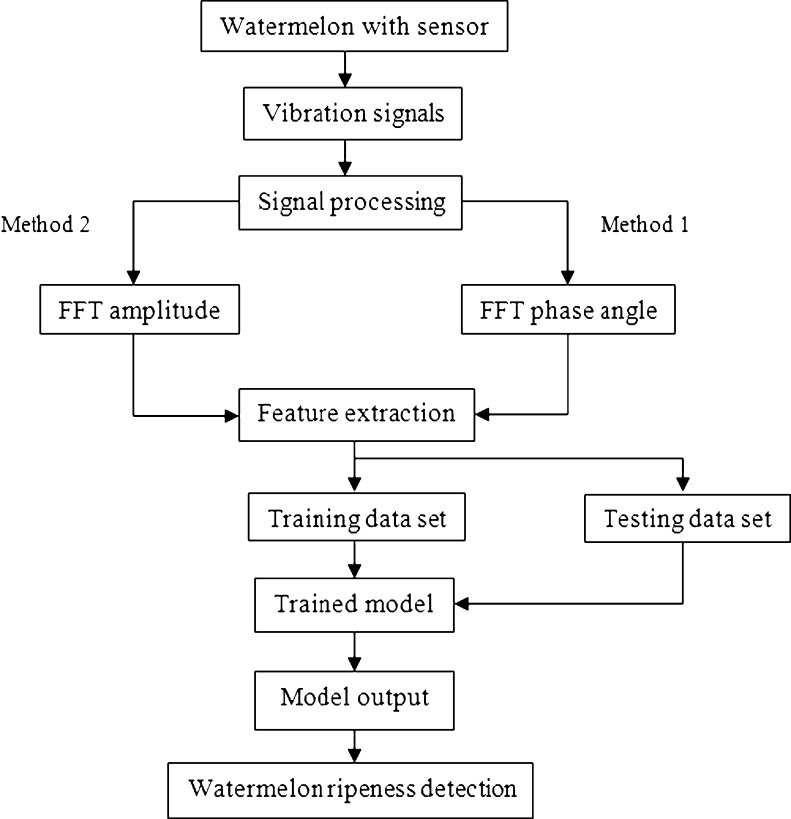
The present work focused on determining the vibration spectrums of watermelon by means of laser Doppler vibrometery, establishing a relation between the extracted features from the frequency response and fruit ripeness and identifying the ripe and unripe watermelons by developing a KNN classifier. The step by step procedure is given as a flow chart in Fig. 1.
Fig. 1.
Flow chart of watermelon ripeness detection system
Material and methods
Vibrations spectra detection
In this study, forty three watermelons (Crimson sweet) were selected for the experiments. It is a nearly round fruit with bright green and medium dark stripes.
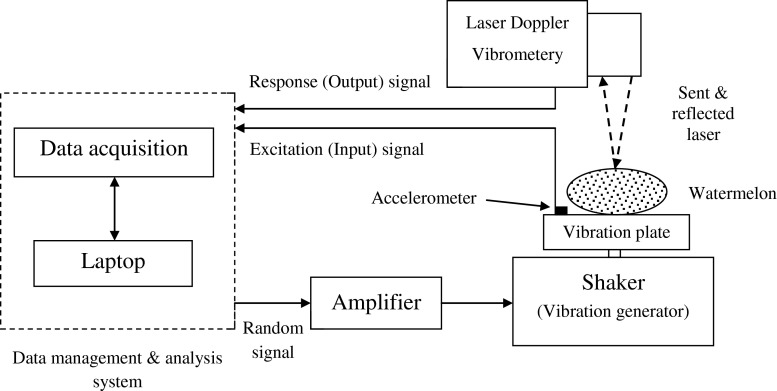
The schematic diagram of the experimental system is shown in Fig. 2. A fruit sample was placed on an electrodynamics shaker (LSD V721, Low Force Shaker, B&K Co. Denmark) and excited with random wave signals: frequencies from 0 Hz to 1,000 Hz. These input signals were generated and amplified using a computer and amplifier respectively. While the excitation signal was measured by an accelerometer (Model Endevco 4397) installed on the vibrational plate, the response of the fruit was optically sensed using a Laser Doppler Vibrometer (Model Ometron VH1000-D, Denmark).
Fig. 2.
A schematic representation of measuring vibration response of watermelon by the LDV
The laser beam from the LD vibrometer was directed to the upper surface of the sample and the vibrations were measured from the Doppler shift of the reflected beam frequency caused by the surface motion. Using fast Fourier transform (FFT), the amplitude and the phase shift between the signals were extracted for entire frequency range. All analyses were performed using Matlab version 7.6.0 software.
Sensory evaluation
After determining the frequency response of the samples, the watermelons were cut and sensory evaluated. Panelists graded the fruits in two class of ripeness. Twenty four evaluations were done on each fruit based on overall acceptability. The ripeness index as consumers’ opinion was scored on unripe and ripe watermelons.
Feature extraction
Frequency-domain signals contain a large set of data for each sample, therefore some statistical approaches are used to reduce the dimensionality of feature vectors (Beltrán et al. 2006). In this study, twenty nine features were extracted from the amplitude spectrums as well as the phase spectrums separately such as mean, standard deviation, kurtosis and skewness. Mathematical formulas of some important features are shown in Table 1.
Table 1.
Some features and their formulas used to feed classifier
| Feature description | Formula | Feature description | Formula |
|---|---|---|---|
| Mean value | Third central moment | ||
| Standard deviation | Forth central moment | ||
| Root mean square | Kurtosis | ||
| Skewness | Peak value | max |x i| |
Review of KNN
When full knowledge of the underlying probabilities of a class of samples is available, Bayesian theory gives optimal new sample classification rates. In cases where this information is not present, many algorithms make use of the similarity among samples as a means of classification. The nearest neighbor decision rule has often been used in these pattern recognition problems (Song et al. 2007). Despite the simplicity of the algorithm, it performs very well, and is an important benchmark method. KNN rule holds the position of training samples and their classes. When a decision about new incoming data is needed, the distance between the query data and training samples is being calculated. Based on the defined threshold for the rule (it is the K number), K samples with least distances are selected and the class with more samples inbound is the result (Duda et al. 2001). For more details, see (Chica and Campoy 2012; Shahabi et al. 2003; Song et al. 2007). In the present study, the K values were considered between 1 and 10, with a step size of 1.
Results and discussion
In order to evaluate the proposed method, experimental analyses on watermelon ripeness detection were carried out. The vibration signals were collected from lots of watermelon. The data set comprised totally 43 data samples, and each data sample consisted of 1600 data points. Among these 43 data samples were selected 24 samples as training data, and the rest 19 as testing data. The detailed description of the data set is shown in Table 2.
Table 2.
Description of watermelon data set
| Watermelon condition | The number of training samples | The number of testing samples | Label of classification |
|---|---|---|---|
| Ripe | 12 | 14 | 1 |
| Unripe | 12 | 5 | 2 |
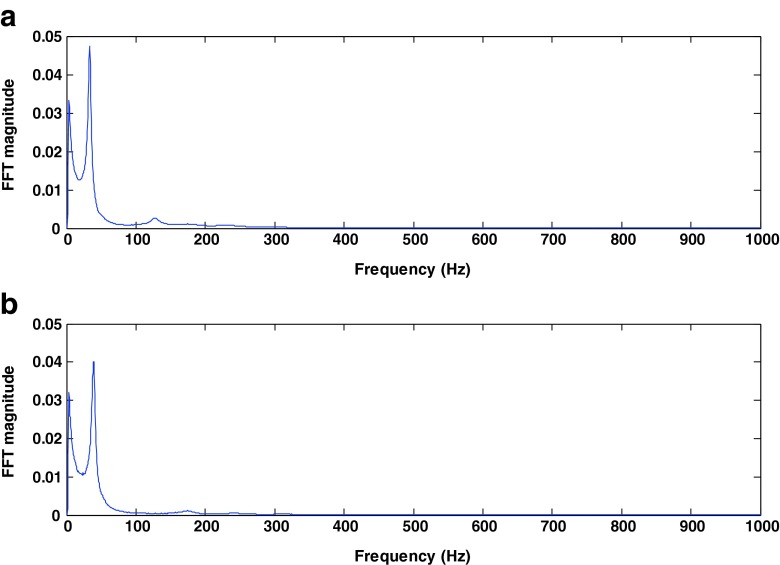
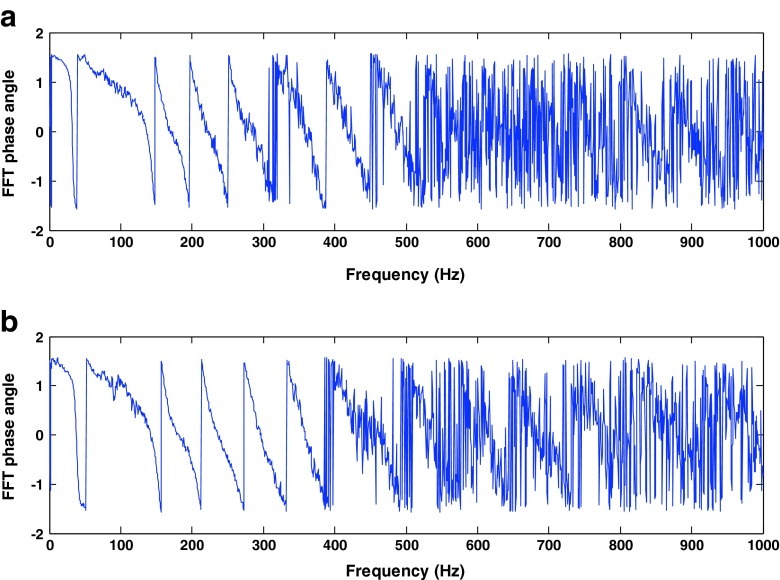
Figures 3 and 4 show a sample of the amplitude and phase spectrum diagram for ripe and unripe watermelons. It can be seen that it is difficult to distinguish among the two internal qualities of the watermelons from these diagrams by observation and human decision, so certain intelligent techniques is desired for extracting useful information about ripeness.
Fig. 3.
FFT amplitude diagram of the vibration signals for two watermelon quality: a ripe b unripe
Fig. 4.
FFT phase angle diagram of the vibration signals for two watermelon quality: a ripe b unripe
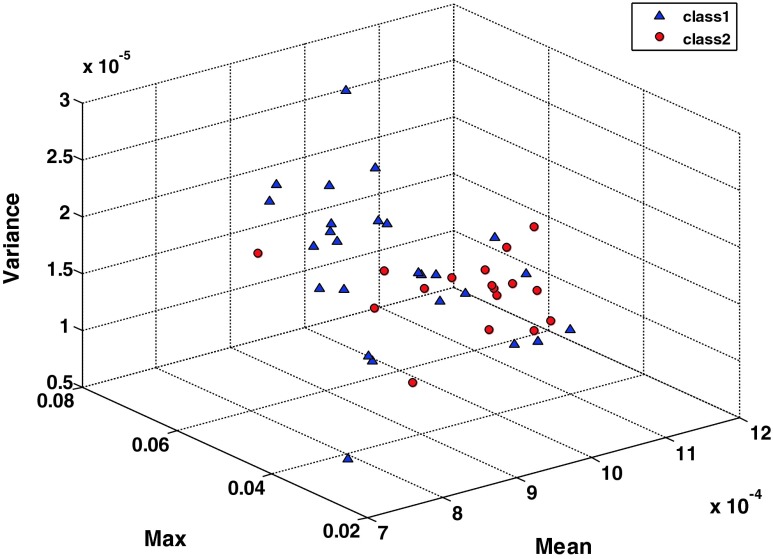
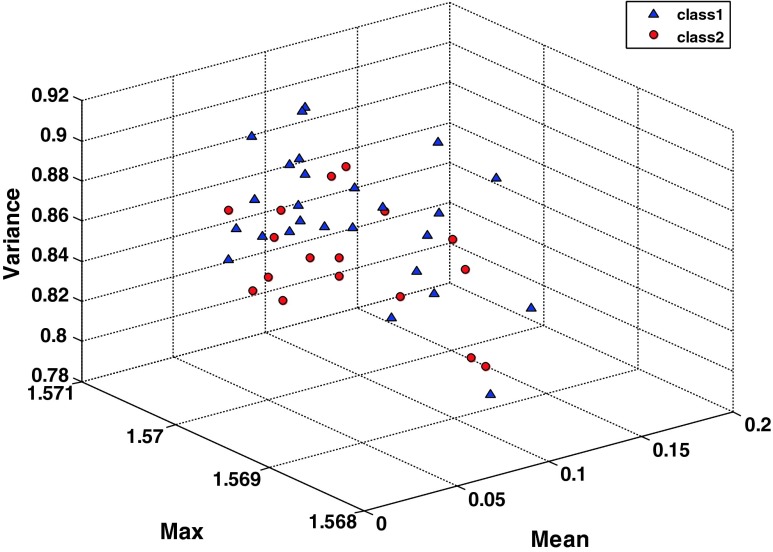
By applying the twenty nine features over both amplitude and phase spectrums, feature vectors were established. The feature vectors were employed to feed KNN classifier for ripeness detection. The three statistical features extracted from the amplitude and phase spectrums were plotted in Figs. 5 and 6 respectively.
Fig. 5.
Three features of the FFT amplitude
Fig. 6.
Three features of the FFT phase angle
Referring to Fig. 6, it can be found that the two classes are poorly discriminated. The data feature parameters have confusion structure, slightly overlapping and cannot be clustered well each watermelon quality. Therefore, this data structure should not be used as inputs of the classifier because it will degrade the performance of the classifier (Widodo and Yang 2007). Nevertheless, in the present study, this data structure was fed to the classifier in order to observe its effect on the classifier performance.
By comparison with two Figs. 5 and 6, it can be observed that the clustering of the two classes is more successful in Fig. 5. Hence, the FFT amplitude parameter has the most accuracy for predicting the watermelon qualities. Note that the difference between Figs. 5 and 6 is just in the type of vibrational parameters. Thus, it can be found that the amplitude of the vibration signals is more effective than the phase angle in the watermelon ripeness detection. By applying proper signal processing techniques and superior features, the boundary of classes can be appeared well and classification accuracy can be increased. Finally we can conclude that the classification results can be improved by using the FFT amplitude of the vibration signals.
The KNN classifier was used for decision-making stage. KNN performance was calculated under the different values of K.
Table 3 shows the performance of KNN using the phase angle data. The classification accuracy was in the range of 32 to 58 %, and the best performance was 57.8947 % which was belonged to K = 7. Computation time for K = 7 was about 0.003 s. The confusion matrix of the best performance is shown in Table 4. It can be said that this performance isn’t a desired result in the detection field and there is a need to higher performance. Therefore, the phase angle data was unsuccessful in ripeness detection of watermelon, as previously shown in Fig. 6.
Table 3.
KNN performance under variable K value with the FFT phase angle
| K | Accuracy rate (%) | Computation time (sec) |
|---|---|---|
| 1 | 47.3684 | 0.006459 |
| 2 | 47.3684 | 0.004232 |
| 3 | 31.5789 | 0.003207 |
| 4 | 42.1053 | 0.003746 |
| 5 | 47.3684 | 0.003096 |
| 6 | 47.3684 | 0.003887 |
| 7 | 57.8947 | 0.003187 |
| 8 | 52.6316 | 0.003562 |
| 9 | 36.8421 | 0.003119 |
| 10 | 42.1053 | 0.003630 |
Bold entries specify the highest accuracy rate and lowest computation time
Table 4.
Confusion matrix of the best performance with the FFT phase angle
| Output | Ripe | Unripe |
|---|---|---|
| Ripe | 9 | 5 |
| Unripe | 3 | 2 |
The accuracy rate and computation time of the KNN algorithm using the FFT amplitude data are shown in Table 5. The performance of KNN in ripeness detection was reduced by increasing the K value. The highest performance was 94.7368 % which was belonged to K = 1 and K = 2. Since computation time for K = 2 was relatively lower than K = 1, the best performance was belonged to K = 2.
Table 5.
KNN performance under variable K value with the FFT amplitude
| K | Accuracy rate (%) | Computation time (sec) |
|---|---|---|
| 1 | 94.7368 | 0.060759 |
| 2 | 94.7368 | 0.044100 |
| 3 | 68.4211 | 0.003209 |
| 4 | 84.2105 | 0.004112 |
| 5 | 73.6842 | 0.003160 |
| 6 | 78.9474 | 0.003282 |
| 7 | 73.6842 | 0.003519 |
| 8 | 73.6842 | 0.003193 |
| 9 | 73.6842 | 0.003118 |
| 10 | 73.6842 | 0.003153 |
Bold entries specify the highest accuracy rate and lowest computation time
Table 6 shows the confusion matrix of the best performance. Among fourteen samples of the ripe watermelons, just one sample was wrongly identified unripe watermelon. But all of the unripe samples were correctly detected.
Table 6.
Confusion matrix of the best performance with the FFT amplitude
| Output | Ripe | Unripe |
|---|---|---|
| Ripe | 13 | 1 |
| Unripe | 0 | 5 |
The detailed description of the KNN performance is shown in Table 7. The sensitivity criteria for the ripe and unripe watermelons were 92.86 and 100 %, because one sample was incorrectly detected in the ripe watermelons. The specificity criteria for the ripe and unripe watermelons were 80 and 100 %. Finally the classification accuracy of KNN was about 95 %. The result shows the potential application of the FFT amplitude and KNN classifier in watermelon ripeness detection.
Table 7.
The values of classification accuracy criteria of the best performance with the FFT amplitude
| Watermelon quality | Statistical parameter | ||
|---|---|---|---|
| Sensitivity (%) | Specificity (%) | Total classification accuracy (%) | |
| Ripe | 92.86 | 80 | 94.7368 |
| Unripe | 100 | 100 | |
Conclusion
Based on the experimental results obtained in this work, we can summarize our findings as follows:
Vibration analysis can be effectively used for watermelon ripeness detection.
The vibration response of watermelons using the LDV method is measured without direct contact between the device and the watermelons; it is accurate and timely, which could result in significant advantage for the commercial-scale grading and sorting of watermelons. The method enables well-timed shipment of fruits to the market.
Using FFT output as an input of the classifier is not an appropriate method and a post-processing step is needed to prepare data for the classifier.
Proposed feature parameters such as maximum, mean and variance are applicable for training of intelligent systems (e.g. KNNs) due to having enough value fluctuations in sample signals and small-size structures.
The performance of the combined FFT amplitude-KNN model was significantly better than the FFT phase angle-KNN model. With K = 2, the accuracy of the proposed approach achieves a perfect level of 95 % with 1 sample out of the totally 19 samples (5 % of watermelons) misclassified.
The authors believe that the proposed intelligent procedure could be used for other fruits. Further research could be conducted on different fruits, acoustic signals and other signal processing and classification techniques.
Contributor Information
Rouzbeh Abbaszadeh, Email: abbaszadeh@irost.org.
Ashkan Moosavian, Phone: +98-21-22070988, FAX: +98-21-48292200, Email: a.moosavian@modares.ac.ir.
Ali Rajabipour, Email: arajabi@ut.ac.ir.
Gholamhassan Najafi, Email: g.najafi@modares.ac.ir.
References
- Armstrong PR, Stone ML, Brusewitz GH. Nondestructive acoustic and compression measurements of watermelon for internal damage detection. Appl Eng Agric. 1997;13(5):641–645. doi: 10.13031/2013.21638. [DOI] [Google Scholar]
- Beltrán NH, Duarte-Mermoud MA, Bustos MA, Salah SA, Loyola EA, Peña-Neira AI, Jalocha JW. Feature extraction and classification of Chilean wines. J Food Eng. 2006;75:1–10. doi: 10.1016/j.jfoodeng.2005.03.045. [DOI] [Google Scholar]
- Bengtsson GB, Lundby F, Haugen JE, Egelandsdal B, Marheim JA. Prediction of postharvest maturity and size of Victoria plums by vibration response. Acta Hortic. 2003;599:367–372. [Google Scholar]
- Chica M, Campoy P. Discernment of bee pollen loads using computer vision and one-class classification techniques. J Food Eng. 2012;112:50–59. doi: 10.1016/j.jfoodeng.2012.03.028. [DOI] [Google Scholar]
- Choi K, Singh S, Kodali A, Pattipati KR, Sheppard JW, Namburu SM, Chigua S, Prokhorov DV, Qiao L. Novel classifier fusion approaches for fault diagnosis in automotive systems. Baltimore: Autotestcon; 2007. pp. 260–269. [Google Scholar]
- Diezma-Iglesias B, Ruiz-Altisent M, Orihuel B (2002) Acoustic impulse response for detecting hollow heart in seedless watermelon. In Proceedings of Postharvest Unlimited International Conference, Leuven, Belgium
- Duda RO, Hart P, Storck DG. Pattern classification. 2. New York: Wiley; 2001. [Google Scholar]
- Flores K, Sanchez MT, Perez-Marin DC, Lopez MD, Guerrero JE, Garrido-Varo A. Prediction of total soluble solid content in intact and cut melons and watermelons using near infrared spectroscopy. J Near Infrared Spectrosc. 2008;16(2):91–98. doi: 10.1255/jnirs.771. [DOI] [Google Scholar]
- Ito H, Morimoto S, Yamauchi R, Ippoushi K, Azuma K, Hugashio H. Potential of near infrared spectroscopy for nondestructive estimation of soluble solids in watermelons. Acta Hortic. 2002;588:353–356. [Google Scholar]
- Jamal N, Ying Y, Wang J, Rao X. Finite element models of watermelon and their applications. Transactions of the CSAE. 2005;21(1):17–22. [Google Scholar]
- Kato K. Electrical density sorting and estimation of soluble solids content of watermelon. J Agr Eng Res. 1997;67(2):161–170. doi: 10.1006/jaer.1997.0160. [DOI] [Google Scholar]
- Landahl S, Terry LA. Avocado firmness monitoring with values obtained by means of laser Doppler vibrometry. Acta Hortic. 2012;945:239–245. [Google Scholar]
- Lu Z, Szafron D, Greiner R, Lu P, Wishart DS, Poulin B, Anvik J, Macdonell C, Eisner R. Predicting subcellular localization of proteins using machine-learned classifiers. Bioinformatics. 2004;20(4):547–556. doi: 10.1093/bioinformatics/btg447. [DOI] [PubMed] [Google Scholar]
- Mollazade K, Omid M, Arefi A. Comparing data mining classifiers for grading raisins based on visual features. Comput Electron Agr. 2012;84:124–131. doi: 10.1016/j.compag.2012.03.004. [DOI] [Google Scholar]
- Motomura Y, Nagao T, Sakurai N. Nondestructive and noncontact measurement of flesh firmness of 6 apple cultivars by laser Dopplar vibrometer (LDV) J Jpn Soc Food Sci. 2004;51(9):483–490. doi: 10.3136/nskkk.51.483. [DOI] [Google Scholar]
- Muramatsu N, Sakurai N, Wada N, Yamamoto R, Takahara T, Ogata T, Tanaka K, Asakura T, Ishikawa-Takano Y, Nevins DJ. Evaluation of fruit tissue texture and internal disorders by laser Doppler detection. Postharvest Biol Tec. 1999;15(1):83–88(6). doi: 10.1016/S0925-5214(98)00062-3. [DOI] [Google Scholar]
- Muramatsu N, Sakurai N, Wada N, Yamamoto R, Tanaka K, Asakura T, Ishikawa-Takano Y, Nevins DJ. Remote sensing of fruit textural changes with a laser Doppler vibrometer. J Am Soc Hortic Sci. 2000;125(1):120–127. [Google Scholar]
- Nelson SO, Guo W, Trabelsi S, Kays SJ. Dielectric spectroscopy of watermelons for quality sensing. Meas Sci Technol. 2007;18:1887–1892. doi: 10.1088/0957-0233/18/7/014. [DOI] [Google Scholar]
- Omid M, Mahmoudi A, Omid MH. An intelligent system for sorting pistachio nut varieties. Expert Syst Appl. 2009;36:11528–11535. doi: 10.1016/j.eswa.2009.03.040. [DOI] [Google Scholar]
- Oveisi Z, Minaei S, Rafiee S, Eyvani A, Borghei A. Application of vibration response technique for the firmness evaluation of pear fruit during storage. J Food Sci Technol. 2012 doi: 10.1007/s13197-012-0811-z. [DOI] [PMC free article] [PubMed] [Google Scholar]
- Sakurai N, Iwatani S, Terasaki S, Yamamoto R. Evaluation of ‘Fuyu’ persimmon texture by a new parameter, “Sharpness index”. J Jpn Soc Hortic Sci. 2005;74:150–158. doi: 10.2503/jjshs.74.150. [DOI] [Google Scholar]
- Shahabi C, Kolahdouzan MR, Sharifzadeh M. A road network embedding technique for k-nearest neighbor search in moving object databases. GeoInformatica. 2003;7(3):255–273. doi: 10.1023/A:1025153016110. [DOI] [Google Scholar]
- Sone I, Olsen RL, Sivertsen AH, Eilertsen G, Heia K. Classification of fresh Atlantic salmon (Salmo salar L.) fillets stored under different atmospheres by hyperspectral imaging. J Food Eng. 2012;109:482–489. doi: 10.1016/j.jfoodeng.2011.11.001. [DOI] [Google Scholar]
- Song Y, Huang J, Zhou D, Zha H, Giles CL (2007) Informative K-nearest neighbor pattern classification. In Proceedings of the eleventh European Conference on Principles and Practice of Knowledge Discovery in Databases, Warsaw, Poland, pp 248–264
- Stone ML, Armstrong PR, Zhang X, Brusewitz GH, Chen DD. Watermelon maturity determination in the field using acoustic impulse impedance techniques. T ASAE. 1996;39(6):2325–2330. doi: 10.13031/2013.27743. [DOI] [Google Scholar]
- Sun T, Huang K, Xu H, Ying Y. Research advances in nondestructive determination of internal quality in watermelon/melon: a review. J Food Eng. 2010;100:569–577. doi: 10.1016/j.jfoodeng.2010.05.019. [DOI] [Google Scholar]
- Taniwaki M, Hanada T, Sakurai N. Postharvest quality evaluation of “Fuyu” and “Taishuu” persimmons using a nondestructive vibrational method and an acoustic vibration technique. Postharvest Biol Tec. 2009;51(1):80–85. doi: 10.1016/j.postharvbio.2008.05.014. [DOI] [Google Scholar]
- Taniwaki M, Hanada T, Tohro M, Sakurai N. Non-destructive determination of the optimum eating ripeness of pears and their texture measurements using acoustical vibration techniques. Postharvest Biol Tec. 2009;51:305–310. doi: 10.1016/j.postharvbio.2008.08.004. [DOI] [Google Scholar]
- Taniwaki M, Takahashi M, Sakurai N. Determination of optimum ripeness for edibility of postharvest melons using nondestructive vibration. Food Res Int. 2009;42:137–141. doi: 10.1016/j.foodres.2008.09.007. [DOI] [Google Scholar]
- Terasaki S, Wada N, Sakurai N, Muramatsu N, Yamamoto R, Nevins DJ. Nondestructive measurement of kiwifruit ripeness using a laser Doppler vibrometer. T ASAE. 2001;44:81–87. doi: 10.13031/2013.2291. [DOI] [Google Scholar]
- Terasaki S, Sakurai N, Zebrowski J, Murayama H, Yamamoto R, Nevins DJ. Laser Doppler vibrometer analysis of changes in elastic properties of ripening ‘La France’ pears after postharvest storage. Postharvest Biol Tec. 2006;42:198–207. doi: 10.1016/j.postharvbio.2006.06.007. [DOI] [Google Scholar]
- Tollner EW. X-ray technology for detecting physical quality attributes in agricultural produce. Postharvest News Inf. 1993;4(6):149–155. [Google Scholar]
- Widodo A, Yang BS. Application of nonlinear feature extraction and support vector machines for fault diagnosis of induction motors. Expert Syst Appl. 2007;33:241–250. doi: 10.1016/j.eswa.2006.04.020. [DOI] [Google Scholar]
- Yamamoto H, Iwamoto M, Haginuma S. Acoustic impulse response method for measuring natural frequency of intact fruits and preliminary applications to internal quality evaluation of apples and watermelons. J Texture Stud. 1980;11(2):117–136. doi: 10.1111/j.1745-4603.1980.tb00312.x. [DOI] [Google Scholar]


