

Abstract
The Cori ester α-d-glucose 1-phosphate (αGlc 1-P) is a high-energy intermediate of cellular carbohydrate metabolism. Its glycosidic phosphomonoester moiety primes αGlc 1-P for flexible exploitation in glucosyl and phosphoryl transfer reactions. Two structurally and mechanistically distinct sugar-phosphate phosphatases from Escherichia coli were characterized in this study for utilization of αGlc 1-P as a phosphoryl donor substrate. The agp gene encodes a periplasmic αGlc 1-P phosphatase (Agp) belonging to the histidine acid phosphatase family. Had13 is from the haloacid dehydrogenase-like phosphatase family. Cytoplasmic expression of Agp (in E. coli Origami B) gave a functional enzyme preparation (kcat for phosphoryl transfer from αGlc 1-P to water, 40 s−1) that was shown by mass spectrometry to exhibit no free cysteines and the native intramolecular disulfide bond between Cys189 and Cys195. Enzymatic phosphoryl transfer from αGlc 1-P to water in H218O solvent proceeded with complete 18O label incorporation into the phosphate released, consistent with catalytic reaction through O-1–P, but not C-1–O, bond cleavage. Hydrolase activity of both enzymes was not restricted to a glycosidic phosphomonoester substrate, and d-glucose 6-phosphate was converted with a kcat similar to that of αGlc 1-P. By examining phosphoryl transfer from αGlc 1-P to an acceptor substrate other than water (d-fructose or d-glucose), we discovered that Agp exhibited pronounced synthetic activity, unlike Had13, which utilized αGlc 1-P mainly for phosphoryl transfer to water. By applying d-fructose in 10-fold molar excess over αGlc 1-P (20 mM), enzymatic conversion furnished d-fructose 1-phosphate as the main product in a 55% overall yield. Agp is a promising biocatalyst for use in transphosphorylation from αGlc 1-P.
INTRODUCTION
Phosphorylation of sugar substrates is a common biochemical transformation of central importance to cellular metabolism (1–3). It usually involves phosphoryl transfer from a phosphoactivated donor substrate, such as ATP, to an acceptor group, typically a hydroxyl, on the sugar backbone (4–7). Various phosphotransferases (EC 2.7) catalyze sugar phosphorylation (8–12). In an alternative reaction catalyzed by glycoside phosphorylases (EC 2.4), where phosphorylation occurs exclusively at the sugar's anomeric position, a glycosyl residue is transferred from a sugar donor substrate to phosphate (Fig. 1A) (13, 14). The phosphomonoester moiety attached to sugars is a key element of biological recognition, across all steps of glycolysis, for example, and it serves to prime sugars for further conversion in different biochemical pathways (15–18). It is known from intracellular-metabolite-profiling studies that changes in concentrations of common sugar phosphates (e.g., d-glucose 6-phosphate [Glc 6-P] and d-fructose 6-phosphate [Fru 6-P]) are often linked to major alterations in cellular physiology (19–22). Due to the requirement for authentic reference material in different biological investigations, there is considerable interest in the synthetic preparation of sugar phosphates (20). Technologically, sugar phosphates are applied as nutritional supplements and taste enhancers in food and feed products, moisturizing ingredients in cosmetics, ionic surface-active reagents in detergents, and building blocks of new polymers (23–25).
FIG 1.

Reactions catalyzed by disaccharide phosphorylases (A), kinases (B), and phosphatases (C).
Known natural phosphorylation reactions have been exploited with mixed success for the biocatalytic synthesis of sugar phosphates. Glycosyl transfer to phosphate is fundamentally limited in application to hexose 1-phosphate products, and the relatively narrow substrate scope of glycoside phosphorylase reactions restricts one to just a few glycosyl phosphates for which effective production has been demonstrated on a preparative scale (e.g., α-d-glucose 1-phosphate [αGlc 1-P] and βGlc 1-P [26, 27] and α-d-galactose 1-phosphate [28]). Phosphotransferase reactions, in contrast, offer convenient access to a large diversity of sugar phosphate products, as shown for nucleoside triphosphate-dependent phosphorylation of various hexose substrates by sugar kinases, for example (29–33). However, the high cost of the phosphoactivated donor substrate and enzyme inhibition by the resulting dephosphorylation product (e.g., ADP from ATP) necessitate that the phosphoryl donor be supplied in only catalytic amounts and therefore regenerated continuously during the reaction (Fig. 1B) (34, 35). However, this makes the biocatalytic phosphoryl transfer a technically complex overall transformation that is currently of limited use in sugar phosphate synthesis.
Transphosphorylation catalyzed by phosphatases in an alteration of their natural phosphomonoester hydrolysis reaction was therefore considered as an alternative route toward sugar phosphates (Fig. 1C) (36–39). Under conditions where sugar was present at a concentration high enough to effectively outcompete the reaction with water, some phosphatases (e.g., acid phosphatase) promoted sugar phosphate formation in moderate (e.g., d-mannose 6-phosphate, 15%) to excellent (e.g., Glc 6-P, up to 95%) yields (37). The use of expedient phosphoryl donor substrates, such as inorganic pyro- or oligophosphate, was advantageous. However, a high preponderance of donor substrate hydrolysis, fast secondary hydrolysis of the sugar phosphate product, and combined inhibition and mass action effects of the released phosphates (Fig. 1C) were critical issues in phosphatase-catalyzed synthesis (40, 41). Identification of transphosphorylation systems with improved synthetic efficacy is therefore important. Here, a new approach of biocatalytic transphosphorylation from the Cori ester αGlc 1-P is examined.
αGlc 1-P is a central intermediate of cellular carbohydrate metabolism. Its free energy of hydrolysis (phosphoryl transfer to water; ΔG°_hydrolysis) at 25°C is −5.0 kcal/mol, which is similar to that of pyrophosphate (ΔG°_hydrolysis = −4.6 kcal/mol) and places αGlc 1-P slightly below ATP (ΔG°_hydrolysis = −7.3 kcal/mol) in terms of energy content (2). αGlc 1-P is produced conveniently from different saccharides, especially from sucrose (26). Its glycosidic phosphomonoester group primes αGlc 1-P for flexible exploitation in glucosyl and phosphoryl transfer reactions; however, until now, biocatalytic use of αGlc 1-P has been restricted entirely to glucoside synthesis (42, 43). Considering that phosphorylation of sugar substrates was desired, we reasoned that αGlc 1-P active phosphatases might also exhibit suitable preference for sugars as phosphoryl acceptors. The notion was put to a critical test by studying two structurally and mechanistically distinct sugar-phosphate-utilizing phosphatases that we selected from Escherichia coli.
Agp (Uniprot number P19926; GenBank accession number YP_489275) is the agp gene product, and the enzyme is located in the E. coli periplasm (44). The crystal structure of the enzyme complex with a glucosyl phosphate ligand reveals a two-domain protein topology typical of members of the high-molecular-weight histidine acid phosphatase family (45). The protein fold comprises a discrete α-helical domain next to an α/β domain and a catalytic center located in a deep cleft between the two domains (see Fig. 3A) (45). The Agp structure exhibits 3 disulfide bridges between Cys94 and Cys125, Cys189 and Cys195, and Cys384 and Cys392 (45). The active site contains a highly conserved histidine (His18, replaced by Ala [see Fig. 3B]) that is thought to function as a catalytic nucleophile. Asp290 is the likely general acid-base catalyst, and the phosphomonoester group of αGlc 1-P is held tightly in place through a cluster of positively charged residues (Arg17, Arg21, Arg94, and His289) (45). The proposed catalytic reaction of Agp follows a double-displacement-like mechanism via a covalent phosphohistidine intermediate, as shown in Fig. 2A.
FIG 3.

Agp (A and B) and Had13 (C and D) represent different phosphatase protein families. (A) Histidine acid phosphatase fold of Agp (PDB entry 1NT4, chain A) showing the α domain in violet, the α/β domain in cyan, and the central catalytic cleft in wheat. Disulfide bonds are indicated in yellow. (B) Close-up view of the active site with the glucosyl phosphate ligand bound. (C) Haloacid dehydrogenase fold of Had13 (PDB entry 1RKQ) showing the cap domain in violet and the α/β domain in cyan. Unique structural features of Had13, namely, the squiggle (an almost-complete α-helical turn [light brown]) and the flap (a β-hairpin turn [yellow]), are also indicated (47, 82). (D) Close-up view of the active site with Mg2+ bound.
FIG 2.

(A and B) Proposed double-displacement-like mechanism of phosphoryl transfer from αGlc 1-P to water catalyzed by Agp (A) and Had13 (B). (C) Phosphoryl transfer from αGlc 1-P to sugar (Fru) catalyzed by Agp. Fru 1-P is shown in its predominant β-pyranose form in aqueous solution.
The second phosphatase studied was Had13 (Uniprot number P0A8Y5; GenBank accession number BAE77597), which belongs to the haloacid dehalogenase-like phosphatase family (46). The Had13 structure, which was determined in the absence of ligands, except for bound metal ion (Mg2+), comprises a modified Rossmann fold-like α/β-core domain that has a smaller “cap” domain on its top (Fig. 3C) (47). The active site is located at the interface of the two domains and contains two key Asp residues (Fig. 3D), which are highly conserved and one of which is believed to function as the catalytic nucleophile (Asp10) and the other as the general acid-base (Asp12). Conserved Asp residues (Asp221 and Asp225) function in the coordination of Mg2+ (48, 49). By similarity to other Had-type enzymes (50), the substrate's phosphoryl group is probably accommodated in Had13 through Thr44 and Lys198. The catalytic reaction of Had13 is proposed to occur in two steps via a covalently modified aspartyl-phosphate enzyme (Fig. 2B).
In both Agp and Had13, the phosphoenzyme intermediate is the potential source of transphosphorylation activity, considering that dephosphorylation of the enzyme could be to a sugar acceptor rather than water. Here, we report recombinant production and isolation of both enzymes and their detailed characterization in the conversion of αGlc 1-P under hydrolysis and transphosphorylation conditions.
MATERIALS AND METHODS
Chemicals and reagents.
Unless otherwise indicated, all chemicals were of the highest purity and were obtained from Sigma-Aldrich (Vienna, Austria) or Roth (Karlsruhe, Germany). The GeneJet genomic DNA purification kit was from Thermo Fisher Scientific (Waltham, MA, USA). Oligonucleotides were from Sigma-Aldrich. DNA sequencing was performed at LGC Genomics (Berlin, Germany). Electrocompetent E. coli Origami B(DE3) cells were from Novagen (Merck KgaA, Darmstadt, Germany). H218O (97% isotopic purity) was from Sigma-Aldrich. The sodium salts of αGlc 1-P, Glc 6-P, Fru 6-P, and pyrophosphate were from Sigma-Aldrich. The barium salt of Fru 1-P was also from Sigma-Aldrich. Phytate (sodium salt) was from Roth. The potassium salt of βGlc 1-P (27) was from Tom Desmet (Ghent University, Ghent, Belgium). N,O-bis(trimethylsilyl)trifluoroacetamide with 1% trimethylchlorosilane (BSTFA-1% TMCS) and pyridine were from Sigma-Aldrich. Purified preparations of sucrose phosphorylase from Leuconostoc mesenteroides (SPase) (51) and mannitol 1-phosphate dehydrogenase from Aspergillus fumigatus (52) were obtained by published procedures.
Molecular cloning, expression, and purification of Agp and Had13.
The agp gene was amplified from genomic DNA of E. coli BL21-Gold(DE3) by PCR. Phusion DNA polymerase (Thermo Fisher Scientific, Waltham, MA, USA) was used in combination with oligonucleotide primers 1 and 2 (Table 1). The PCR consisted of a preheating step at 98°C for 5 min, followed by 30 reaction cycles of denaturation at 98°C for 30 s, annealing at 70°C for 30 s, and elongation at 72°C for 1.5 min. The final extension step was carried out at 72°C for 5 min. The native agp gene encodes a protein predicted with SignalIP-4.1 to contain a 22-amino-acid-long signal peptide at its N terminus (53). To remove the signal sequence, to add an N-terminal streptavidin (Strep) tag, and also to extend the gene's 3′ end with a sequence overlapping with the expression vector, we performed another PCR in which oligonucleotide primers 3 and 4 (Table 1) were used. Finally, to extend the 5′ end of the gene with a region overlapping with the expression vector, a PCR with primers 5 and 3 was performed. The final amplification product was treated with DpnI for parental template digestion and then cloned into the linearized pMS470_dsbC vector via Gibson assembly (54). The sequenced plasmid vector harboring the agp gene construct was transformed into E. coli Origami B. The vector p15TvL-Had13, encoding an N-terminally His-tagged form of Had13 (46), was transformed into electrocompetent E. coli BL21-Gold(DE3) cells.
TABLE 1.
Oligonucleotide primers used for molecular cloning of Agp
| Primer | Sequence (5′→3′) |
|---|---|
| 1 | ATGAACAAAACGCTAATCACC |
| 2 | TTATTTCACCGCTTCATTCAAC |
| 3 | ATGGCTAGCTGGAGCCACCCGCAGTTCGAAAAAATCGAAGGGCGCCA |
| AACCGTACCGGAAGGCTATCAGC | |
| 4 | CATCCGCCAAAACAGCCAAGCTTATTATTTCACCGCTTCATTC |
| 5 | GTTTAACTTTAAGAAGGAGATATACATATGGCTAGCTGGAGCCACC |
Recipient E. coli strains were cultivated in 1-liter baffled shaken flasks at 37°C at 110 rpm using Lennox medium containing 0.115 mg/ml ampicillin. When the optical density at 600 nm (OD600) had reached 0.8, the temperature was decreased to 18°C prior to induction with isopropyl-β-d-thiogalactopyranoside (Agp, 0.01 mM; Had13, 0.4 mM). After 20 h, the cells were centrifuged at 4°C and 4,420 × g for 30 min (Sorvall RC-5B refrigerated superspeed centrifuge; Du Pont Instruments, Newtown, CT, USA). The pellet was resuspended in 50 mM MES [2-(N-morpholino)ethanesulfonic acid], pH 7.0 (Agp), or 50 mM HEPES, pH 7.0 (Had13), and frozen at −20°C. The thawed cell suspension was passed twice through a French pressure cell (American Instruments, Silver Spring, MD, USA) at 150 × 105 Pa, and cell debris was removed by centrifugation at 4°C and 20,000 × g for 30 min.
Agp was isolated from the crude extract with a Strep-Tactin sepharose column (IBA, Göttingen, Germany), using a general protocol described previously (51). Had13 was isolated using a Cu2+-loaded IMAC Sepharose High Performance column (GE Healthcare, Little Chalfont, United Kingdom) operated according to standard procedures. Pooled fractions containing Agp or Had13 were loaded on a Fractogel EMD-DEAE column (Merck, Darmstadt, Germany) and purified according to the standard protocol. Buffer exchange to 50 mM MES, pH 7.0 (Agp), or 50 mM HEPES, pH 7.0 (Had13), was performed using Amicon Ultra-15 centrifugal filter units (Millipore, Billerica, MA, USA). Unless otherwise indicated, all subsequent experiments were done in 50 mM MES (Agp) or 50 mM HEPES supplemented with 5.0 mM MgCl2 (Had13) buffer, each pH 7.0. Purification was monitored by SDS-PAGE; protein bands were visualized by silver staining.
CD spectroscopy.
Far-UV circular-dichroism (CD) spectra of Agp (0.4 mg/ml) and Had13 (0.7 mg/ml) were recorded at 25°C on a Jasco J715 spectropolarimeter (Jasco, Gross-Umstadt, Germany). CD spectra were collected in the wavelength range of 190 to 260 nm at a scan speed of 100 nm/min using a bandwidth of 2.0 nm and a response time of 1.0 s. All spectra were recorded in a 0.01-cm cuvette. For each sample, 10 spectra were recorded and averaged, and the buffer signal was substracted. CD spectra were evaluated by using Dichroweb (55) with reference database no. 4.
Mass spectrometry.
For sample preparation, purified Agp (5 μg) was either incubated or not with 5 mM dithiothreitol (DTT) solution for 30 min at 56°C to reduce the disulfide bonds present, incubated with 20 mM iodoacetamide (IAA) solution for 30 min at 37°C, and digested with modified trypsin (Promega, Madison, WI, USA) (56) and/or with 0.5 μg chymotrypsin (Roche Applied Sciences, Penzberg, Germany) in 50 mM ammonium bicarbonate and 10 mM CaCl2. For mass spectrometry (MS) analysis, digests were acidified to 0.1% formic acid and separated by nano-high-performance liquid chromatography (HPLC) using a Dionex Ultimate 3000 equipped with a PepMap 100 C18 LC microprecolumn (C18; 5 μm; 100 Å; 5 by 0.3 mm) and an Acclaim PepMap rapid-separation liquid chromatography (RSLC) nanocolumn (C18; 2 μm; 100 Å; 150 by 0.075 mm) (all from Thermo Fisher Scientific). About 0.5 μg of digested protein was injected and concentrated on the enrichment column for 2 min at a flow rate of 20 μl/min with 0.5% trifluoroacetic acid as an isocratic solvent. Separation was carried out on the nanocolumn at a flow rate of 300 nl/min using the following gradient, where solvent A is 0.05% trifluoroacetic acid in water and solvent B is 0.05% trifluoroacetic acid in 80% acetonitrile: 0 to 2 min, 4% B; 2 to 70 min, 4 to 28% B; 70 to 94 min, 28 to 50% B; 94 to 96 min, 50 to 95% B; 96 to 116 min, 95% B; 116 to 116.1 min, 95 to 4% B; 116.1 to 140 min, reequilibration at 4% B. The sample was ionized in the nanospray source equipped with stainless steel emitters (ES528; Thermo Fisher Scientific) and analyzed in an Orbitrap Velos mass spectrometer (Thermo Fisher Scientific) operated in positive ion mode, applying alternating full-scan MS (m/z 400 to 2,000) in the ion cyclotron and tandem MS (MS-MS) by higher-energy collisional dissociation of the 20 most intense peaks with dynamic exclusion enabled. The liquid chromatography (LC)–MS-MS data were analyzed by searching a database containing the protein sequences of Agp and known background proteins with Mascot 2.3 (MatrixScience, London, United Kingdom). For detection of disulfide cross-links, the respective database of cross-linked linearized peptides of Agp was generated by xComb (57) for trypsin and for chymotrypsin single and double digests, allowing for inter- and intramolecular cross-links and up to three missed cleavage sites, and was searched with Mascot 2.3. The search criteria were charge, 2+ or 3+; precursor mass error, 0.05 Da; and product mass error, 0.7 Da, with carbamidomethylation, oxidation on methionine, and −2H on cysteine (disulfide) as variable modifications. A maximum false-discovery rate of 0.05 using a decoy database search, an ion score cutoff of 30, and a minimum of 2 identified peptides were chosen as protein identification criteria.
Assays.
The specific activities of Agp and Had13 were determined at 37°C and pH 7.0 using 20 mM αGlc 1-P as the substrate. The reaction was started by addition of Agp (0.1 μM) and Had13 (0.2 μM), and the release of free phosphate was measured over 75 min. Inorganic phosphate was determined colorimetrically at 850 nm (58).
αGlc 1-P and Glc 6-P were measured in a coupled enzymatic system with phosphoglucomutase and Glc 6-P dehydrogenase (59). Fru 6-P was measured using an assay with mannitol 1-phosphate dehydrogenase (52). Fru 1-P was measured indirectly from the phosphate mass balance for substrate consumed [Δ(αGlc 1-P)] and products formed (equation 1) or directly using high performance anion-exchange chromatography with pulsed amperometric detection (HPAEC-PAD) (see below).
| (1) |
The total protein concentration was measured using a Roti-Quant assay referenced against bovine serum albumin (BSA) (60).
Inorganic phosphate-water medium 18O exchange during phosphoryl transfer from αGlc 1-P to water.
All reaction mixtures were prepared from H218O (97%) to give a final 18O isotopic purity of the water solvent of 90%. Phosphatase reactions were done using 2.0 mM αGlc 1-P as the substrate. The standard MES and HEPES buffers were used. The phosphorylase reaction was done in 50 mM MES buffer, pH 7.0, using 1.0 mM αGlc 1-P. The reactions were started by adding enzyme (Agp, 0.1 μM; Had13, 1.0 μM; sucrose phosphorylase, 14 μM) to the substrate solution at 37°C. The incubations proceeded for 2 h with agitation at 650 rpm in an Eppendorf thermomixer. The reactions were stopped by heating (99°C; 5 min). Control reactions were carried out in exactly the same way using normal H216O instead of H218O. Conversion of the αGlc 1-P substrate was 90% or higher in each sample.
Incorporation of 18O label into phosphate was analyzed by gas chromatography (GC)-MS. Samples were dried in a SpeedVac for 3 h and derivatized with BSTFA-1% TMCS in pyridine (1:2 by volume). Analysis was performed using a Trace DSQ single quadrupole GC-MS instrument (Thermo Scientific). The following GC parameters were used: injection volume, 1 μl; injector temperature, 250°C; carrier gas, He; carrier gas flow, 1 ml/min; column, HP-5MS (60 m; inside diameter [i.d.], 0.250 mm; film thickness, 0.25 μm) from Agilent (Waldbronn, Germany). The temperature gradient was as follows: starting temperature, 110°C for 4 min; ramp to 300°C at a heating rate of 20°C/min; final hold time, 10 min. The MS was operated in electron ionization (EI) mode (source temperature, 280°C), and the detected mass range was 50 to 700 m/z. The extracted ion chromatograms of m/z 299 and m/z 301 were integrated using Xcalibur 1.4 software (Thermo Scientific).
Phosphoryl transfer studies.
Reactions were performed as described above (phosphatase kinetics) using 20 mM αGlc 1-P as the donor substrate. Fru (100, 200, 400, or 600 mM) or Glc (200 mM) was used as the acceptor substrate. Samples taken at certain times were analyzed for phosphate, αGlc 1-P, and Glc 6-P. When Fru was the acceptor, Fru 1-P and Fru 6-P were additionally measured in each sample. Sampling was done to allow the determination of initial rates (V), but the full reaction time course was also recorded. Relevant kcat_app values for substrate consumption, phosphate release, and phosphoryl transfer were obtained from the corresponding V values using equation 2, where [E] is the molar enzyme concentration used.
| (2) |
The internal consistency of the data was always checked by mass balance.
pH dependence of phosphoryl transfer to sugar.
The reaction mixtures (0.1 μM enzyme) contained 20 mM each αGlc 1-P and Fru, and the kcat_app value was determined from V for consumption of αGlc 1-P or formation of Fru 1-P. The pH range analyzed was 4.0 to 8.0; 50 mM MES buffer was used, except at pHs of ≤6.0, where 50 mM MES and 20 mM sodium acetate (NaOAc) were used, and at pH 8.0, where 50 mM MES and 50 mM TES [N-tris(hydroxymethyl)methyl-2-aminoethanesulfonic acid] were used. The buffer pH values were adjusted at 37°C and controlled before and after recording each enzyme-catalyzed reaction. Sampling and analyses were as described above.
For data analysis by nonlinear least-squares regression, SigmaPlot 2004 version 9.0 was used. Equation 3 describes pH dependence.
| (3) |
where activity (expressed as logarithmic kcat_app) is constant at low pH and decreases above pKa. C is the pH-independent kcat_app value at the optimum state of protonation, Ka is the proton dissociation constant, and [H+] is the proton concentration.
HPAEC-PAD.
Selected samples were analyzed on a Dionex BioLC system (Dionex Corporation, Sunnyvale, CA, USA) equipped with a CarboPac PA10 column (4 by 250 mm) and an Amino Trap guard column (4 by 50 mm) thermostated at 30°C. Glc, Fru, αGlc 1-P, Glc 6-P, Fru 1-P, and Fru 6-P were detected with an ED50A electrochemical detector using a gold working electrode and a silver-silver chloride reference electrode, applying the predefined waveform for carbohydrates. Elution was carried out at a flow rate of 0.9 ml/min by the following method: isocratic flow of 52 mM NaOH for 20 min, followed by a linear gradient from 100 mM NaOAc to 400 mM NaOAc, applied within 25 min in an isocratic background of 100 mM NaOH. The column was washed for 5 min with 52 mM NaOH. Under the conditions applied, Glc eluted after 10.2 min, Fru after 11.8 min, αGlc 1-P after 30.3 min, Glc 6-P after 36.6 min, Fru 1-P after 37.2 min, and Fru 6-P after 39.1 min.
NMR spectroscopic measurements.
For sample preparation, 20 mM αGlc 1-P and 200 mM Fru were incubated with 0.1 μM Agp at 37°C for 75 min. The reaction was stopped by heating (99°C; 5 min). After centrifugation at 20,000 × g for 5 min, the supernatant was applied on a DEAE FF column (GE Healthcare) preequilibrated with deionized water. Unbound, noncharged monosaccharides were removed by washing with deionized water. Elution of phosphorylated reaction products was accomplished by using 50 mM NaCl. Fractions containing the phosphorylated product were pooled and concentrated by lyophilization prior to nuclear magnetic resonance (NMR) analysis.
For NMR analysis, the isolated compound was dissolved in D2O (∼5 mg in 0.7 ml) and transferred into 5-mm high-precision NMR sample tubes. Measurements were performed on a Bruker (Billerica, MA, USA) DRX-400 at 400.13 MHz (1H) using Topspin 1.3 software. One-dimensional (1D) 1H NMR spectra were recorded by acquisition of 64,000 data points and Fourier transformation, resulting in spectra with a range of 14 ppm. To determine the two-dimensional (2D) correlation spectroscopy (COSY), total correlation spectroscopy (TOCSY), and nuclear Overhauser effect spectroscopy (NOESY) spectra, 128 experiments with 2,048 data points each were recorded and Fourier transformed to 2D spectra with a range of 10 ppm. The measurement temperature was 298 K ± 0.05 K, and external acetone was used as a shift reference standard (chemical shift [δH], 2.225 ppm).
Isolated compounds.
The data for the isolated compounds were as follows: β-d-fructopyranose 1-phosphate, 1H NMR (D2O), δ = 3.99 (1H, m, H-6a), 3.93 (1H, m, H-3), 3.84 (1H, m, H-4), 3.82 (1H, m, H-1b), 3.81 (1H, m, H-1a), 3.77 (1H, m, H-5), 3.65 (1H, m, H-6b); 13C NMR (D2O), δ = 96.3 (s, C-2), 71.9 (d, C-3), 71.8 (d, C-4*), 70.5 (d, C-5*), 68.6 (t, C-6), 66.2 (t, C-1); 31P NMR (D2O), δ = 5.5 (RO-POH2−). Other isomers regarding anomeric form and pyrano/furano form were present at negligible concentrations. The asterisks indicate that shifts were not unequivocally assignable.
Molecular-docking studies.
AutoDock 4.2 as implemented in Yasara v. 11.11.21 was used for enzyme-ligand docking. The AMBER03 force field and the default parameters provided by the standard docking macro were used, except that the number of runs was increased to 50. The structure of Agp (His18→Ala mutant; Protein Data Bank [PDB] entry 1NT4) was used as a macromolecule in molecular-docking experiments that employed αGlc 1-P or αGlc 6-P, each as a di- or monoanion, as the ligand. The three-dimensional (3D) coordinates of the ligands were generated from SMILES strings using Chimera (http://www.cgl.ucsf.edu/chimera). Docking was performed with Asp290 protonated or unprotonated. The ligand was placed flexibly into the enzyme active site that was covered completely by the applied search space of 15 by 10 by 10 Å. Docking poses were evaluated by their associated free energy and mechanistic plausibility. PyMOL (http://www.pymol.org) was used for visualization.
RESULTS
Enzyme preparation and characterization.
Homologous overexpression of the agp gene in E. coli results in accumulation of recombinant enzyme in the periplasmic space whereby the 22-amino-acid-long N-terminal targeting sequence appears to be processed correctly (61, 62). We considered the possibility of keeping the recombinant Agp in the E. coli cytoplasm, but the presence of disulfide bonds in the protein structure presented a potential problem for protein production under these conditions. E. coli Origami B was therefore selected as the expression host, and the truncated variant of the endogenous disulfide bond isomerase (DsbC) was cooverexpressed from the plasmid vector used (63). Under native conditions in the E. coli periplasm, however, DsbC is not necessary for Agp to form its correct disulfide bonds (64). The final Agp construct had the targeting sequence deleted, and an N-terminal Strep tag was added for facilitated recovery. Recombinant enzyme was isolated from induced cells in a yield of about 1 mg/liter culture, which is significantly lower than the reported protein yield from periplasmic expression (40 mg/liter) (62). Cytoplasmic production of Agp was useful, nonetheless, because the absence of N-terminal processing in the cytoplasm offered flexibility in modifying the N terminus with a functional tag.
Had13 was obtained as an N-terminally His-tagged protein (46) at a yield of about 500 μg protein/liter cell culture. SDS-PAGE showed high purity of both enzymes (see Fig. S1 in the supplemental material), and it also confirmed that Agp and Had13 had been isolated at the expected molecular masses of 45 and 31 kDa, respectively. Purified proteins were used in all experiments described below.
Phosphatase activity was determined in standard assays measuring the release of phosphate from αGlc 1-P (20 mM). The specific activity of Agp was 58 U/mg; that of Had13 was 24 U/mg, measured in the presence of 5.0 mM MgCl2. In the absence of Mg2+, the specific activity of Had13 was lowered by about 150-fold.
Far-UV CD spectra from solutions of Agp and Had13 are shown in Fig. S2 in the supplemental material. Estimates of the relative contents of secondary structural elements in each protein are summarized in Table S1 in the supplemental material, where they are compared to data derived from the experimental protein structures. There is variation in the mixed α-β compositions determined from the CD spectrum and crystal structure; however, the results agree in showing that α-helices were present in slight excess over β-strands and that a substantial portion of the structure was classified as unordered. While it is impractical to firmly conclude the correctness of folding from the data presented, the evidence strongly suggests that there was no substantial protein misfolding in the recombinant enzyme preparations used.
Liquid chromatography-tandem mass spectrometry was applied to the determination of the disulfide bond(s) in the as-isolated preparation of recombinant Agp. Reduced protein digests with trypsin or chymotrypsin were resolved to 62% overall sequence coverage, 214 peptides, 37 unique peptides, and a Mascot score of 6,046 compared to 42% overall sequence coverage, 124 peptides, 17 unique peptides, and a Mascot score of 4,625 (see Fig. S3 in the supplemental material). While 4 of the 6 cysteines were found in the reduced sample, no free cysteines were identified in the nonreduced sample. The identity of one of the three native disulfide bonds (Fig. 3A) between Cys189 and Cys195 (underlined) was confirmed unambiguously from the peptide KDSPACKEKQQCSLVDGKNTF (ion score, 34; expected value, 0.00042). Figure S4 in the supplemental material shows the corresponding mass spectrum and ion table. The two remaining disulfide bridges could not be detected directly, probably due to unsuitable cleavage sites producing cross-linked peptides that were too large and outside the detectable mass range. However, the combined results are clear in showing that disulfide bond formation occurred under the expression conditions used.
Mechanistic characterization of phosphoryl transfer from αGlc 1-P to water using 18O labeling.
The proposed catalytic reactions of Agp and Had13 (Fig. 2) share the following mechanistic features: the O-1–P bond of the substrate is cleaved, and water (from solvent) attacks a phosphoenzyme intermediate in the dephosphorylation step of the overall hydrolytic conversion of αGlc 1-P (Fig. 2). Unlike uncatalyzed and glycosidase-like catalyzed phosphoryl transfer from αGlc 1-P to water, where the C-1–O bond is broken and water is incorporated into the anomeric glucosyl carbon, the phosphatase reaction is expected to result in water addition to phosphorus. Measurement of 18O label incorporation from an isotopically enriched water solvent is therefore useful to distinguish between the two mechanistic possibilities. Enzymatic conversions of 2.0 mM αGlc 1-P were carried out in H218O (90% 18O content in the final reaction mixture) and in normal water (control). αGlc 1-P was depleted fully in each reaction. GC-MS analysis was used to determine the isotopic composition of the phosphate released. A tris(trimethylsilyl) phosphate (TMS-phosphate) species was analyzed. Under electron ionization conditions, as described in the literature (65) and confirmed in our experiments, the TMS-phosphate molecular ion at m/z 314 fragments due to loss of one methyl group and a major ion at m/z 299 is formed. The results are summarized in Fig. 4 in a form where the peak area ratios at m/z 301 (TMS-phosphate containing one atom of 18O next to three 16O atoms) and m/z 299 (unlabeled TMS-phosphate containing only 16O atoms) are plotted. Full analytical details, along with the experimental GC-MS chromatograms, are provided in Fig. S5 in the supplemental material. Reactions in normal water gave a peak area ratio of 0.13, which is consistent with the natural 18O/16O isotope ratio in phosphate calculated with IsoPro 3.1 (https://sites.google.com/site/isoproms/). Reactions in 18O-enriched solvent gave much larger peak area ratios (up to a 65-fold increase) than the corresponding controls, clearly indicating 18O label incorporation from solvent to phosphate under these conditions. We also performed a mechanistic control reaction where sucrose phosphorylase was incubated with αGlc 1-P in H218O solvent. αGlc 1-P was hydrolyzed by the phosphorylase without detectable labeling of the phosphate released (Fig. 4), as expected from the catalytic mechanism. Therefore, these results strongly support the notion that enzymatic phosphoryl transfer from αGlc 1-P to water by Agp or Had13 proceeds via the canonical phosphomonoester hydrolase mechanism, where bond cleavage and formation occur at phosphorus, as shown in Fig. 2.
FIG 4.

(A) Incorporation of 18O isotope into the phosphate released during phosphoryl transfer from αGlc 1-P to water by phosphatase or phosphorylase in H218O solvent. The m/z 301/299 (singly 18O-labeled phosphate/nonlabeled phosphate) ratio was measured by GC-MS. The black bars show reactions in normal water; the gray bars show reactions in 18O-enriched solvent. The m/z 301/299 ratio at natural abundance is expected to be 0.13, corresponding to measurements in H2O. For further details, see the text. (B to D) GC-MS chromatograms showing the isotopic compositions of the phosphate released during phosphoryl transfer from αGlc 1-P to water catalyzed by AGP (B), Had13 (C), and sucrose phosphorylase (D) in H218O.
Phospho-donor substrate utilization by Agp and Had13 in phosphoryl transfer to water.
A series of phosphorylated sugars (Table 2) were tested as substrates for phosphoryl transfer to water by each phosphatase. The apparent turnover frequencies (kcat_app) determined at a 20 mM substrate concentration are summarized in Table 2. Both enzymes exhibited high selectivity for hydrolyzing αGlc 1-P compared to βGlc 1-P, which was completely inactive toward Agp and hardly converted by Had13. Phosphosugars harboring the phosphomonoester group at a primary hydroxyl (Glc 6-P, Fru 6-P, or d-fructose 1-phosphate [Fru 1-P]) were utilized by both enzymes with high activity, with the respective kcat_app being comparable within a 2-fold range to the kcat_app for conversion of αGlc 1-P. With all sugar phosphates tested, Agp was a faster phosphatase than Had13. Pyrophosphate and phytate (myo-inositol hexakisphosphate) were also examined as enzyme substrates, and reactions were performed at pH 7.0 and pH 4.5 (50 mM sodium acetate). Pyrophosphate was not hydrolyzed, which is interesting, because it is an excellent substrate for many acid phosphatases (39, 66). Agp was weakly active with phytate, but only at the low pH of 4.5, where the phytate is no longer strongly complexed with metal ions (67).
TABLE 2.
Apparent turnover frequencies for phosphoryl transfer from phosphorylated sugars to water
| Substrate |
kcat_app (s−1)a (±SD) |
|
|---|---|---|
| Agp | Had13 | |
| αGlc 1-P | 40 ± 3 | 12 ± 1 |
| βGlc 1-P | ND | 0.06 ± 0.01 |
| Glc 6-P | 56 ± 1 | 9 ± 1 |
| Fru 1-P | 22 ± 1 | NT |
| Fru 6-P | 22 ± 3 | 4 ± 1 |
| Phytate | 2.1 ± 0.1 | ND |
| Pyrophosphate | ND | ND |
Turnover numbers were calculated from initial rate measurements performed in triplicate. NT, not tested; ND, no activity above the assay detection limit.
Enzymatic transphosphorylation: Agp catalyzes efficient phosphoryl transfer from αGlc 1-P to the 6-hydroxyl of an external Glc acceptor.
During time course studies of phosphoryl transfer from αGlc 1-P (20 mM) to water by Agp, we noticed that in a late phase of the reaction (≥70% substrate conversion), the molar concentration of phosphate released did not exactly match (≥10%) the αGlc 1-P consumed. Analysis of the reaction mixture by HPAEC-PAD revealed the presence of a new phosphorylated sugar, which was found to coelute with an authentic Glc 6-P standard. The presence of Glc 6-P in the reaction sample was confirmed unambiguously using an enzymatic assay based on selective NAD+-dependent oxidation of Glc 6-P by Glc 6-P dehydrogenase. We also determined that the amount of Glc 6-P formed accounted precisely for the phosphate missing in the balance with αGlc 1-P converted. Interestingly, samples from Had13 reactions carried out under otherwise identical conditions did not contain Glc 6-P, and there was a close balance between phosphate formation and αGlc 1-P consumption. The synthesis of Glc 6-P during conversion of αGlc 1-P was suggested to have resulted from an enzymatic transphosphorylation reaction in which αGlc 1-P was the donor and the Glc formed in prior phosphoryl transfer to water was the acceptor. Mechanistically, the substrate's phosphoryl group would be transferred to the catalytic His18 of the enzyme, and dephosphorylation of Agp could then occur by reaction with water (hydrolysis; phosphoryl transfer to water) or Glc (phosphoryl transfer to sugar). Because phosphoryl transfer to sugar would take place in competition with phosphoryl transfer to water, the Glc concentration was expected to be decisive for efficient utilization of αGlc 1-P for synthesis of Glc 6-P.
We therefore repeated enzymatic conversion of αGlc 1-P (20 mM) but added 200 mM Glc as an external phosphoryl acceptor at the start of the reaction. Figure S6 in the supplemental material shows Glc 6-P production in relation to αGlc 1-P consumption along time courses of reactions catalyzed by Agp. Formation of free phosphate is also shown. Using Agp, Glc 6-P was formed in large amounts, accounting for nearly all of the αGlc 1-P cleaved in the enzymatic reaction. Compared to the control reaction lacking Glc, the phosphate release rate was suppressed to a large extent (∼10-fold). The kcat_app of phosphate formation was just 4 s−1 under these conditions. The data in Fig. S6 were further used to calculate kcat_app values of 34 s−1 and 40 s−1 for Glc 6-P synthesis and αGlc 1-P consumption, respectively. The apparent turnover frequencies for the overall conversion were therefore similar in the absence and presence of Glc. However, it must be emphasized that the observable kcat_app (αGlc 1-P) in the presence of Glc sets only a lower limit for the true turnover frequency of the enzyme under the transphosphorylation conditions used because there is also the possibility of a futile resynthesis of αGlc 1-P that cannot be detected with the applied analytical methods. Conversion of αGlc 1-P into Glc 6-P is formally equivalent to the phosphoglucomutase reaction, which, however, involves positional rearrangement of the phosphomonoester group within the same glucose molecule between O-6 and α-O-1 (7). Equilibrium of the phosphoglucomutase reaction strongly favors Glc 6-P (68). Synthesis of Glc 6-P by enzymatic transphosphorylation proceeded through a kinetic optimum of about 10 mM Glc 6-P (see Fig. S6 in the supplemental material). At longer reaction times, Glc 6-P was hydrolyzed completely.
Unlike Agp, Had13 produced only minute amounts of Glc 6-P when Glc was added to the reaction with αGlc 1-P. The kcat_app for Glc 6-P synthesis was determined as 0.3 s−1, which is 22-fold lower than the kcat_app for phosphoryl transfer to water under these conditions. Further studies of enzymatic transphosphorylation, therefore, focused mainly on Agp.
Synthesis of Fru 1-P by enzymatic transphosphorylation from αGlc 1-P.
Phosphorylated derivatives of Fru are interesting metabolites and fine chemicals that are difficult to synthesize chemically. Transphosphorylation studies, therefore, focused on Fru as an acceptor of a phosphoryl group delivered from αGlc 1-P. When Fru (200 mM) was added to conversions of αGlc 1-P (20 mM) and Agp, there was an interesting effect: compared to the control reaction performed in the absence of Fru, the αGlc 1-P consumption rate was enhanced about 3-fold (kcat_app = 137 s−1) whereas the phosphate release rate was decreased about 2-fold at the same time (kcat_app = 18 s−1). Therefore, this provided a clear indication that phosphoryl transfer from αGlc 1-P to an acceptor other than water, likely Fru, constituted the major route of phosphoryl donor substrate utilization under the conditions used. Using analysis by HPAEC-PAD, formation of new sugar phosphate products was confirmed (see below). Comparison of kcat_app values under conditions of phosphoryl transfer to water and phosphoryl transfer to sugar revealed that Agp was somehow “activated” in the presence of an external acceptor. In the proposed scenario of enzymatic transphosphorylation, where an otherwise hydrolyzed phosphoenzyme intermediate is intercepted by an acceptor, enhancement of the kcat_app in the presence of Fru is possible when enzyme dephosphorylation is a slow step of the overall process for phosphoryl transfer to water, and it is accelerated by the reaction with Fru. Consistent with this notion, we showed that the kcat_app (αGlc 1-P) increased about 5-fold with hyperbolic dependence on the Fru concentration (100 to 600 mM) (Table 3), approaching a calculated maximum value of 254 s−1 at saturating concentrations of the phosphoryl acceptor (see Fig. S7 in the supplemental material). An apparent Km for Fru of 209 mM was determined from the data. Table 3 summarizes the results of comprehensive kinetic analysis of enzymatic transphosphorylations at different Fru acceptor concentrations. Expressed in apparent first-order rate constants, the phosphate release rate was suppressed strongly in the presence of an acceptor to less than 1/10 the αGlc 1-P consumption rate under conditions of 600 mM Fru. Formation of Glc 6-P occurred at a very low rate. Synthesis of Fru 6-P took place at about one-fourth the rate of Fru 1-P formation, irrespective of the Fru concentration used. We plotted (Fig. 5A) the ratio of the total transphosphorylation rate (Fru 1-P, Fru 6-P, and Glc 6-P) and the αGlc 1-P consumption rate and show its dependence on the Fru concentration. The ratio approached a value of unity at high Fru concentrations, consistent with the mechanistic notion that externally added (Fru) and in situ-formed (Glc) acceptors compete effectively with water for reaction with the phosphoenzyme intermediate.
TABLE 3.
Kinetic analysis of phosphoryl transfer from sugar by Agp analyzed at different Fru concentrations
| Fru concn (mM) |
kcat_app (s−1)a (±SD) |
||||
|---|---|---|---|---|---|
| Glc 1-P | Fru 1-P | Glc 6-P | Fru 6-P | Phosphate | |
| 0 | 40 ± 3 | NA | NA | NA | 40 ± 3 |
| 100 | 73 ± 4 | 39 ± 2 | 5 ± 1 | 11 ± 2 | 21 ± 1 |
| 200 | 137 ± 10 | 88 ± 8 | 5 ± 1 | 20 ± 2 | 18 ± 1 |
| 400 | 162 ± 21 | 111 ± 12 | 4 ± 1 | 28 ± 3 | 14 ± 1 |
| 600 | 189 ± 19 | 135 ± 11 | 4 ± 1 | 36 ± 7 | 13 ± 1 |
Turnover numbers were calculated from initial rate measurements performed in triplicate. NA, not applicable.
FIG 5.

Kinetic study of the phosphoryl transfer to water and sugar reactions catalyzed by Agp. Turnover numbers were calculated from initial rate measurements performed in triplicate, whereas the product and substrate compositions were measured in duplicate. (A) Ratio of the total transphosphorylation rate (Fru 1-P, Fru 6-P, and Glc 6-P) and the αGlc 1-P consumption rate dependent on the Fru concentration (100 mM to 600 mM) (solid line). The ratio approaches a value of unity at high Fru concentrations, as indicated by the dashed line. (B) pH dependencies of logarithmic kcat_app for αGlc 1-P consumption (○) and Fru 1-P synthesis (●). The lines are fits of equation 3 to the data. (C) Complete time course of conversion of 20 mM αGlc 1-P in the presence of 200 mM Fru. ▽, αGlc 1-P; ■, sum of phosphorylated products; ○, phosphate. (D) Phosphorylated products synthesized in transphosphorylation reactions performed at different initial concentrations of Fru at 50 min. White, Fru 1-P; black, Glc 6-P; dark gray, Fru 6-P; light gray, phosphate. Error bars show the standard deviations of the measured values.
Various phosphatases related to Agp by common membership in the histidine acid phosphatase family of proteins exhibit their optimum activity in the acidic pH range (≤5.0) (69, 70). We therefore determined the pH dependencies of kcat_app for αGlc 1-P consumption and Fru 1-P synthesis by Agp in the pH range 4.0 to 8.0. Activity was constant in the pH range 4.0 to 6.0 and gradually decreased at higher pHs. Activity at the standard pH of 7.0 was still 88% of the activity at the optimum pH. Interestingly, the pH-rate profiles for αGlc 1-P consumption and Fru 1-P synthesis were identical (Fig. 5B), indicating that partitioning of the phosphoenzyme intermediate between reaction with Fru and reaction with water is not dependent on the pH.
A complete time course of conversion of αGlc 1-P in the presence of 200 mM Fru is shown in Fig. 5C. From the phosphate concentration present at the time when αGlc 1-P was completely exhausted, we determined the total concentration of the transphosphorylation product(s) as 16 mM, corresponding to a yield of 80% based on the donor substrate utilized. Using HPAEC-PAD analysis referenced against authentic standards, we showed that Fru 1-P was the main product (12 mM) and that Fru 6-P (2.7 mM) and Glc 6-P (1.0 mM) were formed as by-products. However, Glc 6-P appeared mainly in the late phase of the reaction, when substantial concentrations of Glc (≥10 mM) had already accumulated. The molar ratio of Fru 1-P to Glc 6-P decreased during the reaction from an initial value of 20 to about 10 at the end of conversion (see Fig. S7 in the supplemental material). Phosphorylation of Glc occurred despite Fru being present in about 20-fold molar excess, reflecting the acceptor substrate selectivity of Agp. We also noticed that in spite of the pronounced hydrolase activity of Agp toward each sugar phosphate synthesized in the reaction (Table 2), no loss of the transphosphorylation product to secondary hydrolysis occurred in the time span of the experiment. Unlike other phosphatase-catalyzed transphosphorylation reactions in which the product's kinetic stability presented a problem for synthetic application of the biocatalytic transformations (37, 38), sugar phosphates were formed from αGlc 1-P as if they were real equilibrium products (Fig. 5C), thus enabling their convenient production. Figure 5D shows the compositions of phosphorylated products obtained from conversion of αGlc 1-P at different Fru concentrations.
The identity of Fru 1-P was further confirmed through 1D and 2D NMR analysis of the product mixture (see Fig. S9 to S12 in the supplemental material). Fru 1-P was present in four different anomeric forms, where β-d-fructopyranose 1-phosphate had the highest abundance (∼80%). Note that the theoretical anomeric composition of Fru 1-P in aqueous solution is α-furanose, 5%; β-furanose, 16%; α-pyranose, 5%; and β-pyranose, 73% (71). For this predominant anomer of Fru 1-P, the proton signals of H-1a and -b resonated as separate signal groups in an ABX signal pattern at 3.82 ppm and 3.81 ppm with a heteronuclear coupling over three bonds to the phosphorus atom in the phosphate group 3JH-P. All other proton signals belonged to a spin system, as detected in the TOCSY spectrum (see Fig. S11 in the supplemental material). The proton signals of the methylene group in position 6 were present at 3.99 and 3.65 ppm, both showing 3JH-H couplings to H-5, which resonated at 3.77 ppm. Further coupling of H-5 to to H-4 (3.84 ppm) and consecutively of H-4 to H-3 (3.95) were also visible in COSY spectra (see Fig. S10 in the supplemental material). The large shift difference between the signals of H-6a and H-6b indicated the anomeric form. Furthermore, NMR data for the enzymatically synthesized Fru 1-P were in exact agreement with reference spectra recorded from commercial Fru 1-P (see Fig. S9 in the supplemental material). The NMR data, combined with evidence from HPAEC-PAD analysis and enzymatic assays, confirmed Fru 6-P and Glc 6-P to be transphosphorylation products next to Fru 1-P.
Unlike Agp, Had13 did not catalyze phosphoryl transfer to sugar. Glc 1-P was hydrolyzed completely by the enzyme, and the rates of donor substrate consumption were the same in the presence and absence of 200 mM Fru.
Binding of αGlc 1-P and Glc 6-P by Agp analyzed by molecular docking.
The X-ray crystal structure of Agp with the catalytic His18 replaced by Ala contains a bound ligand reported to be αGlc 1-P (45). However, the phosphosugar represented by the atomic coordinates of the enzyme-ligand complex is clearly βGlc 1-P, not αGlc 1-P. An experimental electron density map was not released with the protein structure and therefore cannot be used for clarification. We performed docking studies in which αGlc 1-P was placed flexibly into the substrate binding pocket of the enzyme (PDB entry 1NT4). The binding of singly or doubly negatively charged αGlc 1-P was examined, and the putative catalytic acid-base Asp290 was analyzed protonated or unprotonated. The best-fit docking poses received under the different conditions were independent of the charge state of αGlc 1-P and Asp290. Figure 6A depicts the best-fit binding mode of singly charged αGlc 1-P to Agp with Asp290 protonated. αGlc 1-P is accommodated in an elongated conformation, with the phosphoryl group placed anti relative to the glucosyl moiety. The substrate's glycosidic oxygen, O-1, is brought into a position that would allow protonated Asp290 to provide Brønsted catalytic assistance to O-1–P bond fission and thus to the departure of the Glc leaving group. Figure 6B shows that Asp290 could adopt an analogous catalytic role during phosphoryl transfer from βGlc 1-P to water, even though the distance between the catalytic enzyme and the reactive substrate groups is substantially larger (3.4 Å) than in the αGlc 1-P docking pose (2.9 Å) (Fig. 6A). We note that βGlc 1-P is not a substrate of Agp (Table 2), and the binding mode of βGlc 1-P in the protein crystal structure may actually be nonproductive for catalysis to O-1–P bond cleavage (Fig. 6B). Evidence from the docking analysis indicates that substrate binding recognition by Agp is mainly through numerous strong interactions with the phosphoryl group (Fig. 6A), whereas the glucosyl moiety of αGlc 1-P is bound only weakly in comparison. The docking experiments resulted in up to 6 docking poses with similar calculated free energies. The different docking poses had the phosphoryl group bound similarly but featured variation in the alignment of the glucosyl moiety (see Fig. S8 in the supplemental material). The size and topology of the binding pocket appear adequate for accommodation of different sugar structures in multiple orientations, as shown for binding of Glc 6-P (Fig. 6C) compared to binding of αGlc 1-P (Fig. 6A), thus explaining the relaxed donor and acceptor substrate specificities of the enzyme.
FIG 6.
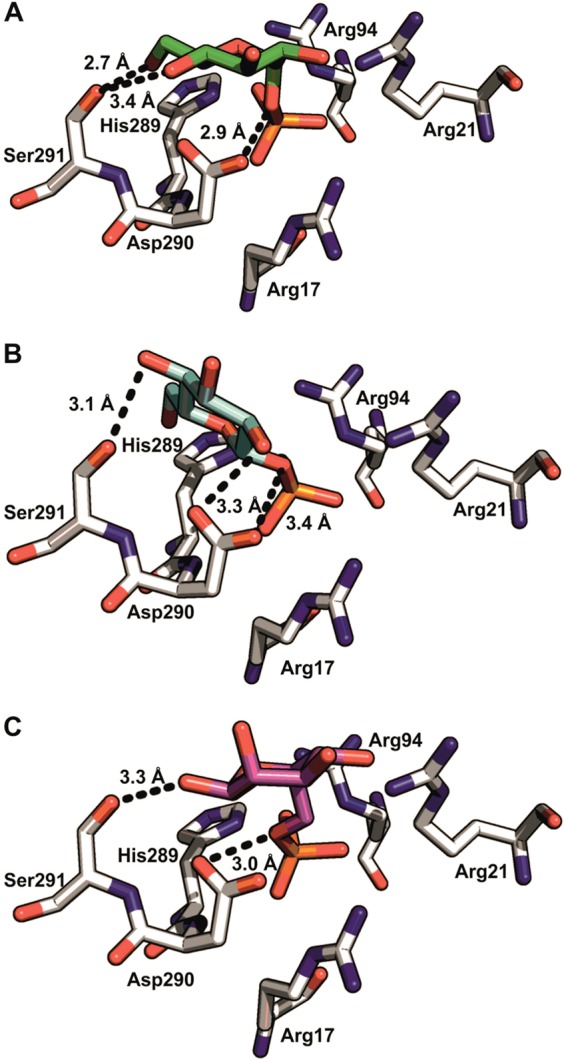
(A and C) Best-fit molecular-docking poses for αGlc 1-P (green) (A) and Glc 6-P (magenta) (C) in the substrate binding pocket of Agp (PDB entry 1NT4, molecule A). (B) βGlc 1-P ligand (blue) present in the published crystal structure of the enzyme. Hydrogen bonds (≤3.4 Å) between Ser291 and the C-4–OH and/or C-6–OH of the glucosyl moiety and/or Asp290 and the glycosidic oxygen atom are shown as dashed lines. The side chains of Arg17, Arg21, Arg94, and His289 interact with the phosphate group of the ligand; the glucosyl moiety is coordinated by the side chains of Asp290 and Ser291.
DISCUSSION
Synthesis of some sugar phosphates by enzymatic transphosphorylation from αGlc 1-P is reported, and E. coli Agp has been identified as an efficient catalyst of the reaction. Fru 1-P and Glc 6-P were obtained in good yields (≥55%) based on the limiting phosphoryl donor substrate utilized in a one-pot single-step biotransformation. Cytoplasmic expression of Agp in E. coli Origami B enabled recombinant production of functional enzyme. “Relocalization” of the naturally periplasmic enzyme into the cytosol circumvented the need to adapt N-terminal fusion strategies (e.g., attachment of a Strep tag) to protein-trimming events in the periplasm.
Molecular and kinetic properties of Agp underlying the enzyme's transphosphorylation activity.
Both Agp and Had13 catalyzed phosphoryl transfer from different sugar phosphates to water with relaxed specificity for the structure of the leaving group (Glc or Fru) and for the position of the phosphoryl group on the sugar moiety (αGlc 1-P or Glc 6-P). In a comparison of the α- and β-anomers of Glc 1-P, however, both enzymes discriminated strongly against phosphoryl transfer from βGlc 1-P to water. Docking analysis carried out on the X-ray crystal structure of Agp suggested a molecular basis for the anomeric selectivity of the enzyme (Fig. 6; see Fig. S8 in the supplemental material). It also provided an interpretation of the broad donor and acceptor substrate specificities of Agp.
Incorporation of 18O label from H218O solvent into the phosphate released during phosphoryl transfer from αGlc 1-P to water by Agp and Had13 supports enzymatic reactions through nucleophilic substitution at the phosphorus. According to mechanistic proposals for histidine acid phosphatases and Had-like phosphatases (Fig. 2), the overall conversion of αGlc 1-P is expected to proceed in a two-step double-displacement-like catalytic process via a covalent phosphohistidine and phosphoaspartate enzyme intermediate, respectively. Phosphoryl transfer to sugar occurs from the phosphorylated enzyme, probably after dissociation of the Glc, in direct competition with phosphoryl transfer to water. Efficient interception of the phosphoenzyme intermediate to prevent its reaction with water will therefore be a key characteristic of synthetically useful acceptor substrates. Partitioning of the phosphorylated enzyme to catalytic breakdown via phosphoryl transfer to water and to sugar is adjustable by the acceptor substrate concentration, as shown for the phosphorylation of Fru by Agp (Fig. 5A). Using the data from conversion of αGlc 1-P in the presence of 200 mM Glc, we can apply the experimental kcat_app ratio for formation of Glc 6-P and phosphate to calculate that Agp (kcat_app ratio = 34/4.0 = 8.5) surpassed Had13 (kcat_app ratio = 0.3/7.0 = 0.04) by more than 200-fold in partition efficiency to favor phosphoryl transfer to the 6-OH of Glc. Differences between the two enzymes are even larger when phosphoryl transfer to Fru is considered. With the current bioinformatics methodology, it is not possible to infer the catalytic ability of transphosphorylation from a phosphatase protein structure alone, necessitating the dedicated biochemical characterization. However, there is evidence from the literature (37, 72–74) that phosphatases related to Agp by common membership in the high-molecular-weight histidine acid phosphatase family also possess transphosphorylation activity, albeit on donor and acceptor substrates different from the ones identified here for Agp. Acceptor substrate selectivity and phosphorylation site selectivity of transphosphorylation will be fine-tuned by positioning of the sugar acceptor substrate in the binding pocket on the phosphoenzyme intermediate. Agp accommodated Fru in two distinct binding modes, where the preferred binding mode resulted in formation of Fru 1-P and the other resulted in formation of Fru 6-P.
Synthetic use of transphosphorylation from αGlc 1-P.
Fru 1-P is a high-value metabolite that is difficult to synthesize chemically (75), explaining the focus of this research on selective phosphorylation of Fru. Biocatalytic synthetic routes to Fru 1-P are aldolase (EC 4.1.2.13)-catalyzed carbon-carbon coupling between glyceraldehyde and dihydroxyacetone phosphate (76) or 1-phosphorylation of Fru from ATP by ketohexokinase (EC 2.7.1.3) (62, 63). Transphosphorylation from αGlc 1-P presents an interesting alternative that offers the advantage of a convenient and cheap phosphoryl donor substrate compared with ATP or dihydroxyacetone phosphate. Moreover, Agp showed excellent turnover frequency (≥100 s−1) (Table 3) for transphosphorylation between αGlc 1-P and Fru. By employing Fru at 600 mM, utilization of αGlc 1-P as the donor substrate for transphosphorylation was almost complete in the sense that phosphoryl transfer to water was prevented effectively (≤10%) (see Fig. S7 in the supplemental material). Based on the αGlc 1-P converted, Fru 1-P was obtained in a 70% yield (14 mM). The remaining products were Fru 6-P (4 mM) and Glc 6-P (0.5 mM). It would be interesting to increase the initial αGlc 1-P concentration in a subsequent step of optimization of the biocatalytic phosphorylation of Fru for synthesis of Fru 1-P. We clearly recognize the problem of the formation of other phosphorylated sugars next to Fru 1-P and therefore the need for efficient product purification. However, the methodology for chromatographic separation of phosphosugars has already been developed (77, 78), so that capture of Fru 1-P from a product mixture with Fru 6-P and Glc 6-P is certainly possible. Alternatively, selective phosphoryl transfer to water of the sugar 6-phosphates using a primarily hydrolytic phosphatase (79) might be useful. Note that noncharged monosaccharides present in the reaction mixture (Fru and Glc) can be easily separated from the phosphorylated product by using anion-exchange chromatography, as shown here during sample workup for NMR analysis. However, development of a complete downstream processing for Fru 1-P was considered to be beyond the scope of this study.
Following the early discovery of phosphoryltransferase activity in certain phosphatases (36), recent work has demonstrated the synthetic usefulness of biocatalytic transphosphorylation reactions in the preparation of different sugar phosphates. Bacterial phosphatases from the class A nonspecific acid phosphatase family were mostly used, and Shigella flexneri (37, 80), Salmonella enterica (80), and Morgenella morganii (81) were prominent sources of the enzyme. A key paper by Van Herk and colleagues showed phosphorylation of a series of aldohexose, aldopentose, and ketohexose acceptors from a pyrophosphate donor substrate using acid phosphatase from S. flexneri (37). Using the donor and acceptor at 100 mM each, the yield of phosphorylated product was typically 15% or lower, except for the 6-phosphates of Glc and 5-thio-d-glucose, which were obtained in substantially higher yields. Interestingly, Fru was a rather poor acceptor substrate for the Shigella phosphatase (5% phosphorylation yield), suggesting useful complementarity by the acceptor substrate specificities of Agp and the previously used transphosphorylation catalyst. Moreover, whereas the nonspecific acid phosphatases were used at pH 4.0, Agp can also be applied in the neutral pH range. Using aldohexose acceptors (e.g., Glc, d-mannose, and d-galactose), it was shown by van Herk et al. (37) that the maximum concentration of phosphorylated product obtained from 100 mM pyrophosphate was strongly dependent on the acceptor concentration used and that it went through a distinct kinetic optimum due to the pronounced effect of secondary phosphoryl transfer to water at extended reaction times. Glc 6-P was an exception, and it was obtained as a kinetically stable transphosphorylation product. Problems with secondary phosphoryl transfer to water were not encountered during Agp-catalyzed phosphorylations of Fru. However, Glc 6-P was hydrolyzed. Finally, even though pyrophosphate is generally viewed as a highly expedient phosphoryl donor substrate for enzymatic transphosphorylations, it must not be overlooked that even in the absence of phosphoryl transfer to water, the pyrophosphate conversion results in the release of inorganic phosphate, which can inhibit the phosphatase (40). The use of αGlc 1-P in combination with a dedicated αGlc 1-P phosphatase might help minimize the effect of product inhibition by phosphate in phosphatase-catalyzed transphosphorylation reactions. The enzyme from E. coli αGlc 1-P phosphatase is a promising biocatalyst for this type of transformation.
Supplementary Material
ACKNOWLEDGMENTS
We acknowledge financial support from the Austrian Science Funds FWF (project L586-B03).
We thank Alexander Yakunin (Department of Chemical Engineering and Applied Chemistry, University of Toronto, Toronto, Canada) for providing p15TvL_yida, Harald Pichler (Institute of Molecular Biotechnology, Graz University of Technology, Graz, Austria) for providing pMS470_dsbC, Tom Desmet (Centre for Industrial Biotechnology and Biocatalysis, Ghent University, Ghent, Belgium) for synthesis of βGlc 1-P, and Christian Fercher (Institute for Molecular Biosciences, Karl-Franzens University Graz, Graz, Austria) for help in recording CD spectra.
Footnotes
Supplemental material for this article may be found at http://dx.doi.org/10.1128/AEM.03314-14.
REFERENCES
- 1.Dzeja PP, Terzic A. 2003. Phosphotransfer networks and cellular energetics. J Exp Biol 206:2039–2047. doi: 10.1242/jeb.00426. [DOI] [PubMed] [Google Scholar]
- 2.Berg JM, Tymoczko JL, Stryer L. 2002. Biochemistry, 5th ed W. H. Freeman, New York, NY. [Google Scholar]
- 3.Wünschiers R. 2012. Carbohydrate metabolism and citrate cycle, p 37–58. In Biochemical pathways: an atlas of biochemistry and molecular biology, 2nd ed John Wiley & Sons, Inc., Hoboken, NJ. [Google Scholar]
- 4.Knowles JR. 1980. Enzyme-catalyzed phosphoryl transfer reactions. Annu Rev Biochem 49:877–919. doi: 10.1146/annurev.bi.49.070180.004305. [DOI] [PubMed] [Google Scholar]
- 5.Lassila JK, Zalatan JG, Herschlag D. 2011. Biological phosphoryl-transfer reactions: understanding mechanism and catalysis. Annu Rev Biochem 80:669–702. doi: 10.1146/annurev-biochem-060409-092741. [DOI] [PMC free article] [PubMed] [Google Scholar]
- 6.Frey PA, Hedgeman AD. Phosphotransfer and nucleotidyltransfer, p 476–546. In Enzymatic reaction mechanisms. Oxford University Press, Oxford, United Kingdom. [Google Scholar]
- 7.Allen KN, Dunaway-Mariano D. 2004. Phosphoryl group transfer: evolution of a catalytic scaffold. Trends Biochem Sci 29:495–503. doi: 10.1016/j.tibs.2004.07.008. [DOI] [PubMed] [Google Scholar]
- 8.Granot D, Kelly G, Stein O, David-Schwartz R. 2014. Substantial roles of hexokinase and fructokinase in the effects of sugars on plant physiology and development. J Exp Bot 65:809–819. doi: 10.1093/jxb/ert400. [DOI] [PubMed] [Google Scholar]
- 9.Agius L. 2008. Glucokinase and molecular aspects of liver glycogen metabolism. Biochem J 414:1–18. doi: 10.1042/BJ20080595. [DOI] [PubMed] [Google Scholar]
- 10.Kawai S, Mukai T, Mori S, Mikami B, Murata K. 2005. Hypothesis: structures, evolution, and ancestor of glucose kinases in the hexokinase family. J Biosci Bioeng 99:320–330. doi: 10.1263/jbb.99.320. [DOI] [PubMed] [Google Scholar]
- 11.Wilson JE. 2003. Isozymes of mammalian hexokinase: structure, subcellular localization and metabolic function. J Exp Biol 206:2049–2057. doi: 10.1242/jeb.00241. [DOI] [PubMed] [Google Scholar]
- 12.Kornberg HL. 2001. Routes for fructose utilization by Escherichia coli. J Mol Microbiol Biotechnol 3:355–359. [PubMed] [Google Scholar]
- 13.Luley-Goedl C, Nidetzky B. 2010. Carbohydrate synthesis by disaccharide phosphorylases: reactions, catalytic mechanisms and application in the glycosciences. Biotechnol J 5:1324–1338. doi: 10.1002/biot.201000217. [DOI] [PubMed] [Google Scholar]
- 14.Nakai H, Kitaoka M, Svensson B, Ohtsubo K. 2013. Recent development of phosphorylases possessing large potential for oligosaccharide synthesis. Curr Opin Chem Biol 17:301–309. doi: 10.1016/j.cbpa.2013.01.006. [DOI] [PubMed] [Google Scholar]
- 15.Westheimer FH. 1987. Why nature chose phosphates. Science 235:1173–1178. doi: 10.1126/science.2434996. [DOI] [PubMed] [Google Scholar]
- 16.Kamerlin SCL, Sharma PK, Prasad RB, Warshel A. 2013. Why nature really chose phosphate. Q Rev Biophys 46:1–132. doi: 10.1017/S0033583512000157. [DOI] [PMC free article] [PubMed] [Google Scholar]
- 17.Morrow JR, Amyes TL, Richard JP. 2008. Phosphate binding energy and catalysis by small and large molecules. Acc Chem Res 41:539–548. doi: 10.1021/ar7002013. [DOI] [PMC free article] [PubMed] [Google Scholar]
- 18.Nagano N, Orengo CA, Thornton JM. 2002. One fold with many functions: the evolutionary relationships between TIM barrel families based on their sequences, structures and functions. J Mol Biol 321:741–765. doi: 10.1016/S0022-2836(02)00649-6. [DOI] [PubMed] [Google Scholar]
- 19.Klimacek M, Krahulec S, Sauer U, Nidetzky B. 2010. Limitations in xylose-fermenting Saccharomyces cerevisiae, made evident through comprehensive metabolite profiling and thermodynamic analysis. Appl Environ Microbiol 76:7566–7574. doi: 10.1128/AEM.01787-10. [DOI] [PMC free article] [PubMed] [Google Scholar]
- 20.Zhang G-F, Sadhukhan S, Tochtrop GP, Brunengraber H. 2011. Metabolomics, pathway regulation, and pathway discovery. J Biol Chem 286:23631–23635. doi: 10.1074/jbc.R110.171405. [DOI] [PMC free article] [PubMed] [Google Scholar]
- 21.Büscher JM, Czernik D, Ewald JC, Sauer U, Zamboni N. 2009. Cross-platform comparison of methods for quantitative metabolomics of primary metabolism. Anal Chem 81:2135–2143. doi: 10.1021/ac8022857. [DOI] [PubMed] [Google Scholar]
- 22.McCloskey D, Palsson BØ, Feist AM. 2013. Basic and applied uses of genome-scale metabolic network reconstructions of Escherichia coli. Mol Syst Biol 9:661. doi: 10.1038/msb.2013.18. [DOI] [PMC free article] [PubMed] [Google Scholar]
- 23.Auriol D, Lefevre F, Nalin R, Redziniak G. April 2011. Cosmetic and pharmaceutical composition comprising N-acetylglucosamine-6-phosphate. US patent 20,130,012,475.
- 24.Auriol D, Nalin R, Lefevre F, Ginolhac A, Guembecker DD, Zago C. May 2008. Method for preparing C-6 phosphorylated D-aldohexoses and C-6 phosphorylated D-aldohexose derivatives. European patent 2150620.
- 25.Shin W-J, Kim B-Y, Bang W-G. 2007. Optimization of ascorbic acid-2-phosphate production from ascorbic acid using resting cell of Brevundimonas diminuta. J Microbiol Biotechnol 17:769–773. [PubMed] [Google Scholar]
- 26.Goedl C, Schwarz A, Minani A, Nidetzky B. 2007. Recombinant sucrose phosphorylase from Leuconostoc mesenteroides: characterization, kinetic studies of transglucosylation, and application of immobilised enzyme for production of α-d-glucose 1-phosphate. J Biotechnol 129:77–86. doi: 10.1016/j.jbiotec.2006.11.019. [DOI] [PubMed] [Google Scholar]
- 27.Van der Borght J, Desmet T, Soetaert W. 2010. Enzymatic production of β-d-glucose-1-phosphate from trehalose. Biotechnol J 5:986–993. doi: 10.1002/biot.201000203. [DOI] [PubMed] [Google Scholar]
- 28.De Groeve MRM, De Baere M, Hoflack L, Desmet T, Vandamme EJ, Soetaert W. 2009. Creating lactose phosphorylase enzymes by directed evolution of cellobiose phosphorylase. Protein Eng Des Sel 22:393–399. doi: 10.1093/protein/gzp017. [DOI] [PubMed] [Google Scholar]
- 29.Lange CF, Kohn P. 1961. Substrate specificity of hexokinases. J Biol Chem 236:1–5. [PubMed] [Google Scholar]
- 30.Nishimasu H, Fushinobu S, Shoun H, Wakagi T. 2006. Identification and characterization of an ATP-dependent hexokinase with broad substrate specificity from the hyperthermophilic archaeon Sulfolobus tokodaii. J Bacteriol 188:2014–2019. doi: 10.1128/JB.188.5.2014-2019.2006. [DOI] [PMC free article] [PubMed] [Google Scholar]
- 31.Nishimoto M, Kitaoka M. 2007. Identification of N-acetylhexosamine 1-kinase in the complete lacto-N-biose I/galacto-N-biose metabolic pathway in Bifidobacterium longum. Appl Environ Microbiol 73:6444–6449. doi: 10.1128/AEM.01425-07. [DOI] [PMC free article] [PubMed] [Google Scholar]
- 32.Cai L, Guan W, Kitaoka M, Shen J, Xia C, Chen W, Wang PG. 2009. A chemoenzymatic route to N-acetylglucosamine-1-phosphate analogues: substrate specificity investigations of N-acetylhexosamine 1-kinase. Chem Commun (Camb) 2944–2946. doi: 10.1039/b904853g. [DOI] [PubMed] [Google Scholar]
- 33.Chen M, Chen L, Zou Y, Xue M, Liang M, Jin L, Guan W, Shen J, Wang W, Wang L, Liu J, Wang PG. 2011. Wide sugar substrate specificity of galactokinase from Streptococcus pneumoniae TIGR4. Carbohydr Res 346:2421–2425. doi: 10.1016/j.carres.2011.08.014. [DOI] [PubMed] [Google Scholar]
- 34.Zhao H, van der Donk WA. 2003. Regeneration of cofactors for use in biocatalysis. Curr Opin Biotechnol 14:583–589. doi: 10.1016/j.copbio.2003.09.007. [DOI] [PubMed] [Google Scholar]
- 35.Berke W, Schüz HJ, Wandrey C, Morr M, Denda G, Kula MR. 1988. Continuous regeneration of ATP in enzyme membrane reactor for enzymatic syntheses. Biotechnol Bioeng 32:130–139. doi: 10.1002/bit.260320203. [DOI] [PubMed] [Google Scholar]
- 36.Wilson IB, Dayan J, Cyr K. 1964. Some properties of alkaline phosphatase from Escherichia coli: transphosphorylation. J Biol Chem 239:4182–4185. [PubMed] [Google Scholar]
- 37.Van Herk T, Hartog AF, van der Burg AM, Wever R. 2005. Regioselective phosphorylation of carbohydrates and various alcohols by bacterial acid phosphatases; probing the substrate specificity of the enzyme from Shigella flexneri. Adv Synth Catal 347:1155–1162. doi: 10.1002/adsc.200505072. [DOI] [Google Scholar]
- 38.Babich L, Hartog AF, van der Horst MA, Wever R. 2012. Continuous-flow reactor-based enzymatic synthesis of phosphorylated compounds on a large scale. Chem Eur J 18:6604–6609. doi: 10.1002/chem.201200101. [DOI] [PubMed] [Google Scholar]
- 39.Babich L, Hartog AF, van Hemert LJ, Rutjes FP, Wever R. 2012. Synthesis of carbohydrates in a continuous flow reactor by immobilized phosphatase and aldolase. ChemSusChem 5:2348–2353. doi: 10.1002/cssc.201200468. [DOI] [PubMed] [Google Scholar]
- 40.Fernley HN, Walker PG. 1967. Studies on alkaline phosphatase. Inhibition by phosphate derivatives and substrate specificity. Biochem J 104:1011–1018. [DOI] [PMC free article] [PubMed] [Google Scholar]
- 41.O'Brien PJ, Herschlag D. 2002. Alkaline phosphatase revisited: hydrolysis of alkyl phosphates. Biochemistry 41:3207–3225. doi: 10.1021/bi012166y. [DOI] [PubMed] [Google Scholar]
- 42.Goedl C, Sawangwan T, Wildberger P, Nidetzky B. 2010. Sucrose phosphorylase: a powerful transglucosylation catalyst for synthesis of α-d-glucosides as industrial fine chemicals. Biocatal Biotransform 28:10–21. doi: 10.3109/10242420903411595. [DOI] [Google Scholar]
- 43.Renirie R, Pukin A, van Lagen B, Franssen MCR. 2010. Regio- and stereoselective glucosylation of diols by sucrose phosphorylase using sucrose or glucose 1-phosphate as glucosyl donor. J Mol Catal B 67:219–224. doi: 10.1016/j.molcatb.2010.08.009. [DOI] [Google Scholar]
- 44.Pradel E, Marck C, Boquet PL. 1990. Nucleotide sequence and transcriptional analysis of the Escherichia coli agp gene encoding periplasmic acid glucose-1-phosphatase. J Bacteriol 172:802–807. [DOI] [PMC free article] [PubMed] [Google Scholar]
- 45.Lee DC, Cottrill MA, Forsberg CW, Jia Z. 2003. Functional insights revealed by the crystal structures of Escherichia coli glucose-1-phosphatase. J Biol Chem 278:31412–31418. doi: 10.1074/jbc.M213154200. [DOI] [PubMed] [Google Scholar]
- 46.Kuznetsova E, Proudfoot M, Gonzalez CF, Brown G, Omelchenko MV, Borozan I, Carmel L, Wolf YI, Mori H, Savchenko AV, Arrowsmith CH, Koonin EV, Edwards AM, Yakunin AF. 2006. Genome-wide analysis of substrate specificities of the Escherichia coli haloacid dehalogenase-like phosphatase family. J Biol Chem 281:36149–36161. doi: 10.1074/jbc.M605449200. [DOI] [PubMed] [Google Scholar]
- 47.Burroughs AM, Allen KN, Dunaway-Mariano D, Aravind L. 2006. Evolutionary genomics of the HAD superfamily: understanding the structural adaptations and catalytic diversity in a superfamily of phosphoesterases and allied enzymes. J Mol Biol 361:1003–1034. doi: 10.1016/j.jmb.2006.06.049. [DOI] [PubMed] [Google Scholar]
- 48.Collet JF, Stroobant V, Pirard M, Delpierre G, Van Schaftingen E. 1998. A new class of phosphotransferases phosphorylated on an aspartate residue in an amino-terminal DXDX(T/V) motif. J Biol Chem 273:14107–14112. doi: 10.1074/jbc.273.23.14107. [DOI] [PubMed] [Google Scholar]
- 49.Lahiri SD, Zhang G, Dunaway-Mariano D, Allen KN. 2006. Diversification of function in the haloacid dehalogenase enzyme superfamily: the role of the cap domain in hydrolytic phosphoruscarbon bond cleavage. Bioorg Chem 34:394–409. doi: 10.1016/j.bioorg.2006.09.007. [DOI] [PMC free article] [PubMed] [Google Scholar]
- 50.Morais MC, Zhang W, Baker AS, Zhang G, Dunaway-Mariano D, Allen KN. 2000. The crystal structure of Bacillus cereus phosphonoacetaldehyde hydrolase: insight into catalysis of phosphorus bond cleavage and catalytic diversification within the HAD enzyme superfamily. Biochemistry 39:10385–10396. doi: 10.1021/bi001171j. [DOI] [PubMed] [Google Scholar]
- 51.Wildberger P, Todea A, Nidetzky B. 2012. Probing enzyme-substrate interactions at the catalytic subsite of Leuconostoc mesenteroides sucrose phosphorylase with site-directed mutagenesis: the roles of Asp49 and Arg395. Biocatal Biotransform 30:326–337. doi: 10.3109/10242422.2012.674720. [DOI] [Google Scholar]
- 52.Krahulec S, Armao GC, Weber H, Klimacek M, Nidetzky B. 2008. Characterization of recombinant Aspergillus fumigatus mannitol-1-phosphate 5-dehydrogenase and its application for the stereoselective synthesis of protio and deuterio forms of D-mannitol 1-phosphate. Carbohydr Res 343:1414–1423. doi: 10.1016/j.carres.2008.04.011. [DOI] [PubMed] [Google Scholar]
- 53.Petersen TN, Brunak S, von Heijne G, Nielsen H. 2011. SignalP 4.0: discriminating signal peptides from transmembrane regions. Nat Methods 8:785–786. doi: 10.1038/nmeth.1701. [DOI] [PubMed] [Google Scholar]
- 54.Gibson DG, Young L, Chuang RY, Venter JC, Hutchison CA, Smith HO. 2009. Enzymatic assembly of DNA molecules up to several hundred kilobases. Nat Methods 6:343–345. doi: 10.1038/nmeth.1318. [DOI] [PubMed] [Google Scholar]
- 55.Whitmore L, Wallace BA. 2008. Protein secondary structure analyses from circular dichroism spectroscopy: methods and reference databases. Biopolymers 89:392–400. doi: 10.1002/bip.20853. [DOI] [PubMed] [Google Scholar]
- 56.Shevchenko A, Wilm M, Vorm O, Mann M. 1996. Mass spectrometric sequencing of proteins silver-stained polyacrylamide gels. Anal Chem 68:850–858. doi: 10.1021/ac950914h. [DOI] [PubMed] [Google Scholar]
- 57.Panchaud A, Singh P, Shaffer SA, Goodlett DR. 2010. xComb: a cross-linked peptide database approach to protein-protein interaction analysis. J Proteome Res 9:2508–2515. doi: 10.1021/pr9011816. [DOI] [PMC free article] [PubMed] [Google Scholar]
- 58.Saheki S, Takeda A, Shimazu T. 1985. Assay of inorganic phosphate in the mild pH range, suitable for measurement of glycogen phosphorylase activity. Anal Biochem 148:277–281. doi: 10.1016/0003-2697(85)90229-5. [DOI] [PubMed] [Google Scholar]
- 59.Eis C, Nidetzky B. 1999. Characterization of trehalose phosphorylase from Schizophyllum commune. Biochem J 341:385–393. doi: 10.1042/0264-6021:3410385. [DOI] [PMC free article] [PubMed] [Google Scholar]
- 60.Bradford MM. 1976. A rapid and sensitive method for the quantitation of microgram quantities of protein utilizing the principle of protein-dye binding. Anal Biochem 72:248–254. doi: 10.1016/0003-2697(76)90527-3. [DOI] [PubMed] [Google Scholar]
- 61.Jia Z, Cottrill M, Pal GP, Lee D, Sung M, Forsberg CW, Phillips JP. 2001. Purification, crystallization and preliminary X-ray analysis of the Escherichia coli glucose-1-phosphatase. Acta Crystallogr D 57:314–316. doi: 10.1107/S090744490001979X. [DOI] [PubMed] [Google Scholar]
- 62.Cottrill MA, Golovan SP, Phillips JP, Forsberg CW. 2002. Inositol phosphatase activity of the Escherichia coli agp-encoded acid glucose-1-phosphatase. Can J Microbiol 48:801–809. doi: 10.1139/w02-076. [DOI] [PubMed] [Google Scholar]
- 63.Kietzmann M, Schwab H, Pichler H, Ivancic M, May O, Luiten RGM. July 2011. Preparation of an esterase. European patent 2171061.
- 64.Berkmen M, Boyd D, Beckwith J. 2005. The nonconsecutive disulfide bond of Escherichia coli phytase (AppA) renders it dependent on the protein-disulfide isomerase, DsbC. J Biol Chem 280:11387–11394. doi: 10.1074/jbc.M411774200. [DOI] [PubMed] [Google Scholar]
- 65.Graff G, Krick TP, Walseth TF, Goldberg ND. 1980. The use of [18O4]phosphoric acid in the quantitation of phosphate by gas-liquid chromatography-mass spectrometry analysis. Anal Biochem 107:324–331. doi: 10.1016/0003-2697(80)90391-7. [DOI] [PubMed] [Google Scholar]
- 66.Pradines A, Klaebe A, Perie J, Paul F, Monsan P. 1991. Large-scale enzymatic synthesis of glycerol 1-phosphate. Enzyme Microbiol Technol 13:19–23. doi: 10.1016/0141-0229(91)90183-B. [DOI] [Google Scholar]
- 67.Oh B-C, Choi W-C, Park S, Kim Y-O, Oh T-K. 2004. Biochemical properties and substrate specificities of alkaline and histidine acid phytases. Appl Microbiol Biotechnol 63:362–372. doi: 10.1007/s00253-003-1345-0. [DOI] [PubMed] [Google Scholar]
- 68.Ray WJ Jr, Roscelli GA. 1964. A kinetic study of the phosphoglucomutase pathway. J Biol Chem 239:1228–1236. [PubMed] [Google Scholar]
- 69.Mitchell DB, Vogel K, Weimann BJ, Pasamontes L, van Loon APGM. 1997. The phytase subfamily of histidine acid phosphatases: isolation of genes for two novel phytases from the fungi Aspergillus terreus and Myceliophthora thermophila. Microbiology 143:245–252. doi: 10.1099/00221287-143-1-245. [DOI] [PubMed] [Google Scholar]
- 70.Tomschy A, Brugger R, Lehmann M, Svendsen A, Vogel K, Kostrewa D, Lassen SF, Burger D, Kronenberger A, van Loon APGM, Pasamontes L, Wyss M. 2002. Engineering of phytase for improved activity at low pH. Appl Environ Microbiol 68:1907–1913. doi: 10.1128/AEM.68.4.1907-1913.2002. [DOI] [PMC free article] [PubMed] [Google Scholar]
- 71.Koerner TAW, Voll RJ, Cary LW, Younathan ES. 1980. Carbon-13 nuclear magnetic resonance studies and anomeric composition of ketohexose phosphates in solution. Biochemistry 19:2795–2801. doi: 10.1021/bi00553a040. [DOI] [PubMed] [Google Scholar]
- 72.Ostanin K, Van Etten RL. 1993. Asp304 of Escherichia coli acid phosphatase is involved in leaving group protonation. J Biol Chem 268:20778–20784. [PubMed] [Google Scholar]
- 73.Herter T, Berezina OV, Zinin NV, Velikodvorskaya GA, Greiner R, Borriss R. 2006. Glucose-1-phosphatase (AgpE) from Enterobacter cloacae displays enhanced phytase activity. Appl Microbiol Biotechnol 70:60–64. doi: 10.1007/s00253-005-0024-8. [DOI] [PubMed] [Google Scholar]
- 74.Kim Y-O, Kim H-W, Park I-S, Lee J-H, Lee S-J, Kim K-K. 2009. Purification, characterization, and gene cloning of glucose-1-phosphatase from Citrobacter braakii. J Gen Appl Microbiol 55:345–350. doi: 10.2323/jgam.55.345. [DOI] [PubMed] [Google Scholar]
- 75.Pogell BM. 1953. A new synthesis of fructose-1-phosphate with phosphorus pentoxide. J Biol Chem 201:645–649. [PubMed] [Google Scholar]
- 76.Fessner W-D, Sinerius G, Schneider A, Dreyer M, Schulz GE, Badia J, Aguilar J. 1991. Diastereoselective enzymatic aldol additions: L-rhamnulose and L-fuculose 1-phosphate aldolases from E. coli. Angew Chem Int Ed Engl 30:555–558. doi: 10.1002/anie.199105551. [DOI] [Google Scholar]
- 77.Lefebvre MJ, Gonzalez NS, Pontis HG. 1964. Anion-exchange chromatography of sugar phosphates with triethylammonium borate. J Chromatogr 15:495–500. doi: 10.1016/S0021-9673(01)82808-9. [DOI] [PubMed] [Google Scholar]
- 78.Smits HP, Cohen A, Buttler T, Nielsen J, Olsson L. 1998. Cleanup and analysis of sugar phosphates in biological extracts by using solid-phase extraction and anion-exchange chromatography with pulsed amperometric detection. Anal Biochem 261:36–42. doi: 10.1006/abio.1998.2714. [DOI] [PubMed] [Google Scholar]
- 79.Lu Z, Dunaway-Mariano D, Allen KN. 2005. HAD superfamily phosphotransferase substrate diversification: structure and function analysis of HAD subclass IIB sugar phosphatase BT4131. Biochemistry 44:8684–8696. doi: 10.1021/bi050009j. [DOI] [PubMed] [Google Scholar]
- 80.Tanaka N, Hasan Z, Hartog AF, van Herk T, Wever R, Sanders RJ. 2003. Phosphorylation and dephosphorylation of polyhydroxy compounds by class A bacterial acid phosphatases. Org Biomol Chem 1:2833–2839. doi: 10.1039/b304012g. [DOI] [PubMed] [Google Scholar]
- 81.Mihara Y, Utagawa T, Yamada H, Asano Y. 2001. Acid phosphatase/phosphotransferases from enteric bacteria. J Biosci Bioeng 92:50–54. doi: 10.1016/S1389-1723(01)80198-5. [DOI] [PubMed] [Google Scholar]
- 82.Lu Z, Dunaway-Mariano D, Allen KN. 2008. The catalytic scaffold of the haloalkanoic acid dehalogenase enzyme superfamily acts as a mold for the trigonal bipyramidal transition state. Proc Natl Acad Sci U S A 105:5687–5692. doi: 10.1073/pnas.0710800105. [DOI] [PMC free article] [PubMed] [Google Scholar]
Associated Data
This section collects any data citations, data availability statements, or supplementary materials included in this article.