

Abstract
Escherichia coli isolates (n = 658) obtained from drinking water intakes of Comox Lake (2011 to 2013) were screened for the following virulence genes (VGs): stx1 and stx2 (Shiga toxin-producing E. coli [STEC]), eae and the adherence factor (EAF) gene (enteropathogenic E. coli [EPEC]), heat-stable (ST) enterotoxin (variants STh and STp) and heat-labile enterotoxin (LT) genes (enterotoxigenic E. coli [ETEC]), and ipaH (enteroinvasive E. coli [EIEC]). The only genes detected were eae and stx2, which were carried by 37.69% (n = 248) of the isolates. Only eae was harbored by 26.74% (n = 176) of the isolates, representing potential atypical EPEC strains, while only stx2 was detected in 10.33% (n = 68) of the isolates, indicating potential STEC strains. Moreover, four isolates were positive for both the stx2 and eae genes, representing potential EHEC strains. The prevalence of VGs (eae or stx2) was significantly (P < 0.0001) higher in the fall season, and multiple genes (eae plus stx2) were detected only in fall. Repetitive element palindromic PCR (rep-PCR) fingerprint analysis of 658 E. coli isolates identified 335 unique fingerprints, with an overall Shannon diversity (H′) index of 3.653. Diversity varied among seasons over the years, with relatively higher diversity during fall. Multivariate analysis of variance (MANOVA) revealed that the majority of the fingerprints showed a tendency to cluster according to year, season, and month. Taken together, the results indicated that the diversity and population structure of E. coli fluctuate on a temporal scale, reflecting the presence of diverse host sources and their behavior over time in the watershed. Furthermore, the occurrence of potentially pathogenic E. coli strains in the drinking water intakes highlights the risk to human health associated with direct and indirect consumption of untreated surface water.
INTRODUCTION
Fecal contamination is the primary contributor of pathogens to surface water and constitutes a significant public health risk. In Canada, the estimated rate of acute gastrointestinal illness attributable to water is 0.11 cases per person per year, which poses a substantial economic burden (1). Traditionally, the safety of water used for drinking and recreation as required by regulation is assessed in terms of the concentration of Escherichia coli, a dominant intestinal inhabitant of humans and warm-blooded animals, whose presence in water indicates fecal contamination and the potential presence of enteric pathogens (2). The sources of E. coli in the aquatic environment can originate from runoff from land applied with animal wastes or animal feeding operations, urban runoff, inadequate or failing septic or sewer systems, and wildlife (3). Identification of the source of fecal pollution is a high priority in order to protect and manage source water quality and also to assess the potential public health risk associated with fecal contamination from a given host source (4). To this end, many advances have been made in recent years to develop various phenotypic and genotypic (library-dependent or library-independent) microbial source tracking (MST) methods (5, 6), and these methods are recommended components of fecal pollution abatement strategies (7).
Traditionally, E. coli has been considered a harmless, commensal bacterium. However, several diarrheagenic pathotypes have been recognized based on virulence properties and mechanisms of pathogenicity (8). These pathotypes include Shiga toxin-producing E. coli (STEC), enteropathogenic E. coli (EPEC), enterotoxigenic E. coli (ETEC), enteroinvasive E. coli (EIEC), and enteroaggregative E. coli, and they are implicated in many waterborne outbreaks, including those in Canada (9–11). Among these pathotypes, STEC and EPEC are responsible for frequent waterborne outbreaks worldwide (9, 10, 12, 13). In British Columbia (BC), Canada, the rate of STEC infections has remained above the Canadian average since 2004, ranging between 2.4 and 4.3 cases/100,000 individuals (14).
The ability of STEC to cause disease is associated with the production of the Shiga-like toxins Stx1 and Stx2 (encoded by the stx1 and stx2 genes) and related virulence factors (8). STEC strains are defined as E. coli strains expressing either of the Shiga-like toxin genes stx1 and stx2 or other toxins sharing significant homology to the Shiga toxin gene originally identified in Shigella dysenteriae (15). EPEC strains are defined as intimin (eae)-harboring diarrheagenic E. coli strains that possess the ability to form attaching and effacing (A/E) lesions on intestinal cells but do not possess the stx gene (8). EPEC strains carrying the adherence factor (EAF) plasmid are referred to as typical EPEC (tEPEC), while those strains that lack the plasmid are referred to as atypical EPEC (aEPEC) (8). EPEC is a significant cause of gastrointestinal disease in the developing world (8); however, outbreaks in developed countries have also been reported (9, 16); among these outbreaks, typical EPEC is more dominant in developing countries, while atypical EPEC seems to be more important in developed countries (17). ETEC produces heat-labile enterotoxin (LT) and/or heat-stable enterotoxin (ST) (variants STh and STp) and is an important cause of diarrhea in infants and travelers. EIEC is associated with invasive, bloody diarrhea resembling that caused by Shigella sp. Invasion is mediated by genes encoding, for example, Ipa proteins and their transcription regulator invE (8). Although several studies have shown that fecal material from various animals and humans contains E. coli isolates carrying virulence genes (VGs) associated with pathogenic E. coli (18–22), only a few studies (23, 24) in Canada have determined whether E. coli strains isolated from water contain VGs and are potentially pathogenic, while other studies were particularly focused on the detection of E. coli O157:H7 (25, 26).
It has been reported that E. coli exhibits high genetic diversity and complex population dynamics in the primary (humans and warm-blooded animals) and secondary (environment outside the host) habitats. For instance, several studies using different fingerprinting methods have revealed enormous genetic diversity in E. coli populations obtained from different animals (21, 22, 27–29). Similarly extensive genetic diversity was also observed for E. coli populations isolated from various aquatic environments (4, 30, 31). Previous studies have suggested that there is a relationship between the genotypes of E. coli found among specific animal hosts and the geographical locations from which they were isolated (32, 33). Such variations have been observed among the genotypes of E. coli isolated from different animals and avian host sources in BC, Canada (21, 22). Despite the large amount of data available on the genetic diversity of E. coli in the aquatic environment (4, 30, 31, 34, 35), only limited information is available on the temporal variation of the diversity and population structure of E. coli in the surface water over multiple years in Canada on annual, seasonal, and monthly scales. Therefore, the objectives of the present investigation were (i) to determine the prevalence of diarrheagenic virulence genes in E. coli isolates obtained from the drinking water intakes of Comox Lake and (ii) to determine the temporal variation (annual, seasonal, and monthly) in the genetic diversity and population structure of these isolates over multiple years by using repetitive element palindromic PCR (rep-PCR) fingerprinting.
MATERIALS AND METHODS
Description of the study area.
Comox Lake is a large lake (49°35′10″N, 125°8′14″W), with a surface area of 2,100 ha, located near the village of Cumberland, BC. Drinking water supply is an important water use of this watershed. At present, the Comox Lake watershed provides drinking water to ∼38,000 people throughout the Comox Valley and will be increasingly relied upon for future population growth (36). The Comox Valley Regional District (CVRD) withdraws drinking water from the Puntledge River downstream from Comox Lake. About 97.1% of the watershed is natural area (forestry, park, water, and Crown Land) (37). Comox Lake also provides significant recreational opportunities (fishing, swimming, camping, and boating).
Water samples.
Five replicate water samples were collected in sterile polypropylene bottles (1 liter) from the current intake (Puntledge River) and from the proposed future intake location (Fig. 1) biweekly for a period of 3 years (2011 to 2013). The samples were shipped on ice to the laboratory and were stored at 4°C until processing, within 24 h. All five replicate samples (5 liters) were mixed together in a sterile 15-liter Lowboy container and shaken to homogenize the samples. E. coli strains were isolated from these water samples by membrane filtration (0.45-μm pore size) methods using m-ColiBlue24TM medium (Millipore Inc., USA). Standard water volumes of 100 ml were used for filtration. Blue colonies (presumptive E. coli) were isolated, purified by restreaking three times on MacConkey agar, and identified by using an array of biochemical tests (38) and also by a PCR-based assay targeting the uspA gene (39).
FIG 1.

Map showing Comox Lake and sampling locations. (Reprinted from Google Maps.)
Detection of virulence genes by a real-time PCR assay.
Bacterial cells were recovered from 1 ml of pure culture of E. coli cells grown for 18 h at 37°C, and genomic DNA was extracted with InstaGene Matrix (Bio-Rad, Canada) according to the manufacturer's protocol. Previously reported primers and probes were used for the detection of the virulence genes of pathogenic E. coli (Table 1). A triplex TaqMan real-time PCR targeting the stx1, stx2, and eae genes was used for the simultaneous detection of STEC and EPEC. Two separate singleplex reactions targeting E. coli O157 rfb (rfbO157) (which is responsible for the biosynthesis of the O antigen) and the EAF gene were used for the confirmation of stx- and stx- plus eae-positive E. coli strains as O157/non-O157 and EPEC (only eae-positive) strains as aEPEC/tEPEC, respectively. The reaction mixtures were dispensed into 96-well, thin-wall PCR plates (MicroAmp; Applied Biosystems, USA). Each well contained (20 μl) 2× TaqMan Universal PCR master mix (Applied Biosystems) with optimized concentrations of primers, probes, and the DNA template. Plates were covered with optically clear sealing film (Applied Biosystems) and briefly centrifuged. After uracil N-glycosylase treatment at 50°C for 2 min to prevent the amplification of carryover PCR products, followed by the activation of AmpliTaq Gold DNA polymerase at 95°C for 10 min, DNA was amplified for 40 cycles at 95°C for 15 s and at 60°C for 1 min by using the ABI Prism 7900HT sequence detection system (Applied Biosystems). Two separate SYBR green (duplex) real-time PCR assays were also used for the detection of STh, LT, STp, and ipaH genes. The reaction mix contained (20 μl) 2× Fast SYBR green master mix (Applied Biosystems) with optimized concentrations of primers and the DNA template. DNA amplification (40 cycles) was carried out at 95°C for 1 min and at 60°C for 20 s. After amplification, a melting-curve analysis of the amplified DNA was performed by using the default temperature profile. The instrument software was used for data analysis (SDS, version 2.4). The following E. coli isolates were used as positive controls: ATCC 43887 (EPEC), EDL 933 (E. coli O15:H7 [STEC]/EHEC), ATCC 43886 and ATCC 43896 (ETEC), and ATCC 43893 (EIEC). Ultrapure water without DNA was used as a negative control.
TABLE 1.
Primers and probes used in this studyd
| E. coli pathotype | Gene | Primer or probe | Sequence (5′–3′) | Final concn (nmol liter−1) | Amplicon size (bp) |
|---|---|---|---|---|---|
| STEC | stx1a | Forward primer | ACTTCTCGACTGCAAAGACGTATG | 200 | 132 |
| Reverse primer | ACAAATTATCCCCTGAGCCACTATC | 200 | |||
| TaqMan probe | VIC-CTCTGCAATAGGTACTCCA-MGB | 100 | |||
| stx2a | Forward primer | CCACATCGGTGTCTGTTATTAACC | 500 | 93 | |
| Reverse primer | GGTCAAAACGCGCCTGATAG | 500 | |||
| TaqMan probe | NED-TTGCTGTGGATATACGAGG-MGB | 200 | |||
| rfbO157c | Forward primer | ATGCTGCCCACAAAAATAATGTAAA | 600 | 89 | |
| Reverse primer | TTCCATAATCGGTTGGTGTGCTAA | 600 | |||
| TaqMan probe | NED-AACTGCTTTTCCTCGGTTCGTCGTGTAT-MGB | 200 | |||
| EPEC | eaea | Forward primer | CCGATTCCTCTGGTGACGA | 200 | 105 |
| Reverse primer | CCACGGTTTATCAAACTGATAACG | 200 | |||
| TaqMan probe | FAM-CGTCATGGTACGGGTAA-MGB | 100 | |||
| EAFc | Forward primer | GTTCTTGGCGAACAGGCTTGTC | 600 | 107 | |
| Reverse primer | TTAAGCCAGCTACCATCCACCC | 600 | |||
| TaqMan probe | TET-AGTACTGACGTGCAGGTCGCCTGTTCG-MGB | 200 | |||
| ETEC | SThb | Forward primer | CCTTTCGCTCAGGATGCTAAAC | 500 | 128 |
| Reverse primer | CAGTAATTGCTACTATTCATGCTTTCAG | 500 | |||
| LTb | Forward primer | TTCCCACCGGATCACCAA | 100 | 62 | |
| Reverse primer | CAACCTTGTGGTGCATGATGA | 100 | |||
| STpb | Forward primer | CTTTCCCCTCTTTTAGTCAGTCAACT | 300 | 137 | |
| Reverse primer | GCAGTAAAATGTGTTGTTCATATTTTCTG | 300 | |||
| EIEC | ipaHb | Forward primer | GAACTCAAATCTTGCACCATTCA | 600 | 107 |
| Reverse primer | CGTCCGTCCGAGAACAATTAAG | 600 |
Triplex reaction.
Duplex reaction.
Singleplex reaction.
FAM, 6-carboxyfluorescein; TET, 5-tetrachlorofluorescein phosphoramidite (Eurofins Genomics); NED, 2′-chloro-5′-fluoro-7′,8′-fused phenyl-1.4-dichloro-6-carboxyfluorescein (Life Technologies).
Rep-PCR genomic fingerprinting of E. coli isolates.
The genomic DNA from each E. coli isolate was extracted with an InstaGene DNA extraction kit (Bio-Rad, Canada) according to the manufacturer's instructions. BOX PCR was performed by using BOX A1R primer 5′-CTA CGG CAA GGC GAC GCT GAC G-3′ (Invitrogen) (5, 40). The reaction mix (25 μl) contained 5 μl (50 nM) the DNA template, 1 μl (2 μM) primer, 10 μl 2.5× 5 Prime Mastermix, 1 μl MgCl2 (1 mM), and ultrapure water. PCR amplifications were performed in a PxE0.2 thermal cycler (Thermo Electron Corporation) with an initial denaturation step (95°C for 2 min) followed by 30 cycles of denaturation (94°C for 3s and 92°C for 30s), annealing (50°C for 1 min), and extension (65°C for 8 min) and a single final extension step (65°C for 8 min). A negative control (molecular biology-grade water; Fermentas, Canada) and a positive control (genomic DNA of E. coli K-12 strain W3110) were included in the PCR assays. The amplification products were separated by horizontal electrophoresis on a 1.8% agarose gel after mixing with gel loading dye (Fermentas, Canada) at 100 V for 3 h. A GeneRuler 1-kb Plus molecular weight marker (Fermentas, Canada) was loaded into a well for every eight samples as an external reference standard. The gel was then stained with a DNA gel stain (SYBR Safe; Life Technologies, Canada) in 1× Tris-acetate-EDTA (TAE) buffer. The banding patterns of the gels were captured and processed by using a Gel Doc XR+, molecular imager and Image Lab 4.0 image acquisition and analysis software (Bio-Rad, Canada).
Statistical analysis.
DNA fingerprint data analysis was carried out by using BioNumerics, version 7 (Applied Maths, Belgium). Each gel was normalized by using 1-kb Plus DNA ladders (Fermentas, Canada), in the range of 75 to 2,000 bp, as an external reference standard. DNA fingerprint similarities were calculated by using the curve-based Pearson coefficient with 1% optimization. A dendrogram was generated by using the unweighted-pair group method using average linkages (UPGMA). A similarity score of 92% was used as the cutoff value for the same strain types. Isolates with similarity scores below this value were considered unique. Clustering of the isolates was accomplished by multivariate analysis of variance (MANOVA), a form of discriminant analysis accounting for variance (41). A binary band-matching character table generated by using the BOX-derived rep-PCR DNA fingerprint data was used for discriminant analysis and MANOVA. The percentages of isolates assigned to their correct source group were calculated by using Jackknife analysis with maximum similarities (28). The difference in the occurrences of VGs among different seasons was determined by analysis of variance (ANOVA).
Shannon diversity index.
The Shannon diversity index (H′) was used to calculate the genetic diversity of the E. coli isolates (30). The diversity index was calculated as follows:
where S is the number of unique genotypes and pi is the number of isolates sharing the same genotype, i, over the total number of isolates.
RESULTS
Prevalence of virulence genes.
In the present study, a total of 658 E. coli isolates obtained from the lake over a period of 3 years were screened for the presence of major virulence genes associated with diarrheagenic E. coli in order to determine their pathogenic potential. The results revealed that eae and stx2 were the only genes detected in these isolates, and the overall prevalence was 37.69% (248/658) (Table 2). None of the other genes (STh, STp, LT, and ipaH) were present in any of the E. coli isolates analyzed. Among the two genes detected, eae was the most frequently detected gene compared to the stx2 gene. Only the eae gene was carried by 26.74% (176/658) of the E. coli isolates, representing potential EPEC strains, while 10.33% (68/658) of the isolates harbored only the stx2 gene, indicating potential STEC strains. These potential STEC strains were further confirmed to be non-O157 STEC, as they did not possess the rfbO157 gene when an O157 (rfbO157)-specific TaqMan assay was performed on these isolates. Multiple genes were present in only four isolates, with a combination of eae and stx2 (0.60; 4/658) representing potential EHEC, as the additional virulence gene eae was present in these stx2-positive isolates. Further characterization of these multiple gene (eae and stx2)-carrying isolates with an O157 (rfbO157)-specific TaqMan assay revealed that these isolates were non-O157 EHEC, since none of them were positive for this gene. During different years, the highest number of isolates positive for VGs (46.51%; 100/215) was observed for E. coli isolates obtained in 2011 compared to 2012 (33.4%; 76/230) and 2013 (33.8%; 72/213) (Table 2). The combined seasonal occurrence of VGs in all the years showed a significantly (P < 0.0001) higher prevalence for E. coli isolates obtained in fall (33.23%; 219/658) than in other seasons (Table 2). The four isolates that were positive for both eae and stx2 (non-O157 EHEC) were detected only in the fall season.
TABLE 2.
Prevalence of virulence genes in E. coli strains isolated from water
| Season | No. of positive isolates (%) |
||||||
|---|---|---|---|---|---|---|---|
| 2011 |
2012 |
2013 |
|||||
| stx2 | eae | stx2 plus eae | stx2 | eae | stx2 | eae | |
| Fall | 28 (23.14) | 56 (46.28) | 4 (2.47) | 21 (14.68) | 45 (31.46) | 14 (10.21) | 51 (37.22) |
| Summer | 2 (4.65) | 4 (9.30) | 1 (2.94) | 5 (14.70) | 1 (3.12) | 2 (6.25) | |
| Winter | 0 (0) | 3 (8.33) | 0 (0) | 2 (5.12) | 0 | 3 (9.37) | |
| Spring | 1 (6.66) | 2 (13.33) | 0 (0) | 2 (14.28) | 0 | 1 (8.33) | |
| Totala | 31 (14.41) | 65 (30.23) | 4 (1.8) | 22 (9.56) | 54 (23.47) | 15 (7.04) | 57 (26.7) |
Please see the total number of isolates in Table 3.
Genetic diversity and population structure.
In the present study, a total of 658 E. coli isolates (2011, n = 215; 2012, n = 230; 2013, n = 213) were obtained from the drinking water intakes of Comox Lake (Table 3). The rep-PCR DNA fingerprint analyses of these isolates showed a high degree of genetic diversity, with various annual and seasonal contributions. Among the 215 E. coli fingerprints obtained in 2011, 134 (62.3%) were identified as unique, while out of the 230 fingerprints obtained in 2012, 143 (62.1%) fingerprints were identified as unique. In 2013, 58 (27%) unique genotypes were identified out of 214 fingerprints analyzed. When combined, a total of 335 (134 plus 143 plus 58) unique genotypes were obtained out of the 658 isolates, and the overall diversity index was 3.653. The diversity indices also showed variation among E. coli isolates obtained during different seasons (Table 3). In 2011, the highest genetic variability was observed for E. coli isolates obtained in fall, with an H′ of 3.91, followed by summer (H′, 2.17), spring (1.99), and winter (1.69), while in 2012, the highest diversity was recorded in summer (H′, 3.21), followed by winter (3.07), fall (2.84), and spring (2.7). Nevertheless, in 2013, the highest diversity was observed for E. coli isolates obtained in winter (H′, 2.311), followed by spring (1.81), fall (1.311), and summer (0.277).
TABLE 3.
Shannon diversity indices (H′) of E. coli isolates
| Season | 2011 |
2012 |
2013 |
||||||
|---|---|---|---|---|---|---|---|---|---|
| No. of isolates | No. of unique genotypes | H′ index | No. of isolates | No. of unique genotypes | H′ index | No. of isolates | No. of unique genotypes | H′ index | |
| Fall | 121 | 90 | 3.91 | 143 | 72 | 2.846 | 137 | 31 | 1.311 |
| Summer | 43 | 21 | 2.179 | 34 | 28 | 3.210 | 32 | 2 | 0.277 |
| Winter | 36 | 14 | 1.694 | 39 | 29 | 3.073 | 32 | 18 | 2.311 |
| Spring | 15 | 9 | 1.991 | 14 | 14 | 2.708 | 12 | 7 | 1.81 |
| Total | 215 | 134 | 3.715 | 230 | 143 | 3.748 | 213 | 58 | 1.691 |
In order to determine the seasonal association of the diversity of E. coli, dendrograms were constructed by using isolates obtained during different seasons. Only unique fingerprints (n = 134; n = 143; n = 58) were included in the dendrogram to study diversity without clonality and reduce the tree length. Figure 2 shows the seasonal dendrograms constructed for E. coli strains isolated in 2011, 2012, and 2013 (Fig. 2A to C, respectively). When the dendrograms were collapsed at a 60% similarity cutoff value, they were divided into several clusters, each containing at least two isolates. The seasonal dendrogram (n = 134) of E. coli fingerprints from 2011 generated 16 distinct clusters (Fig. 2A). Among them, cluster 3 contained the largest number (n = 36) of isolates, with DNA fingerprint similarity ranging from 62 to 90%, followed by clusters 6 (30 isolates; 61 to 92% similarity), 13 (14 isolates; 63 to 92% similarity), and 7 (13 isolates; 69 to 89% similarity). The remaining 12 groups had eight or fewer isolates. Three isolates (fall, 2; summer, 1) had individual lineages accounting for a similarity of between 44 and 52%, indicating a high diversity of these isolates. The dendrogram of E. coli fingerprints from 2012 was grouped into 14 clusters (Fig. 2B). Cluster 2 contained the largest number of isolates (28 isolates), with similarity values ranging from 60 to 91%, followed by clusters 3 (23 isolates; 62 to 92% similarity), 6 (16 isolates; 66 to 91% similarity), 9 (16 isolates; 64 to 92% similarity), and 4 (14 isolates; 64 to 90% similarity). The remaining 9 clusters contained 5 or fewer isolates. Seven isolates (fall, 5; summer, 1; winter, 1) had individual lineages accounting for a similarity of between 43 and 58.9%. The dendrogram of E. coli isolates from 2013 was divided into 8 clusters (Fig. 2C); among them, cluster 3 accommodated the highest number of isolates (n = 13), with fingerprint similarity ranging from 69 to 88%, followed by clusters 4 (10 isolates; 72 to 91% similarity), 5 (9 isolates; 58 to 88% similarity), 1 (8 isolates; 65 to 87% similarity), and 6 (7 isolates; 58 to 86% similarity). The remaining 3 clusters had 5 or fewer isolates. Two isolates (winter, 1; spring, 1) had individual lineages accounting for a similarity of between 34 and 13%, indicating a high diversity of these isolates. Overall, these results demonstrate that there was high degree of genetic variability in E. coli populations obtained during different seasons.
FIG 2.

Dendrogram showing the relatedness of E. coli strains isolated from Comox Lake during different seasons, as determined by rep-PCR fingerprint analysis using the BOX A1R primer. Because of the large population size (2011, n = 134 [A]; 2012, n = 143 [B]; 2013, n = 58 [C]), a condensed dendrogram (using a 60% cutoff value) is presented. DNA fingerprint similarities were calculated by using the curve-based Pearson coefficient, and dendrograms were generated by UPGMA. Data are shown as season (number of isolates); the total number of isolates in each cluster and percent similarities are given next to the clusters. F, fall; S, summer; W, winter; Sp, spring. Note that the cluster numbers mentioned in the text are presented on the clusters.
MANOVA demonstrated that the majority of the isolates showed a tendency to cluster according to their assigned groups (Fig. 3A to D). The yearwise (2011, 2012, and 2013) MANOVA results revealed that the majority of the isolates obtained in 2013 formed a large cluster, while isolates obtained in 2011 and 2012 formed two closely related clusters (Fig. 3A). This clustering was also shown by Jackknife analysis, as the percent correct assignments of isolates by year were 76, 79, and 88% for 2011, 2012, and 2013, respectively. The first and second discriminants accounted for 100% of the canonical variation (87 and 13%, respectively). The MANOVA plot of isolates from 2011 showed that isolates collected in fall and winter clustered separately, while the isolates obtained in summer and spring shared the same cluster (Fig. 3B). This was also confirmed by Jackknife analysis, as 82.64% of E. coli isolates were correctly assigned to fall, followed by winter (69.44%), summer (60.47%), and spring (46.67%). The first and second discriminants accounted for 88% of the canonical variation (54 and 34%, respectively), and altogether, the first three discriminants accounted for 100% of the variation. The E. coli isolates obtained in 2012 also formed well-separated clusters according to their respective groups; however, the isolates obtained in spring and winter shared the same cluster (Fig. 3C). Jackknife analysis showed that 90.91% of E. coli isolates were correctly assigned to the fall group, followed by winter (53%), summer (41.18%), and spring (14.29%). The first and second discriminants accounted for 53 and 35% of the canonical variation, respectively. Furthermore, E. coli isolates recovered in 2013 also showed distinct clustering according to their respective season (Fig. 3D). However, the isolates obtained in spring did not form a separate group. The first and second discriminants accounted for 92% of the canonical variation (53 and 39%, respectively), and altogether, the first three discriminants accounted for 100% of the variation. In all the years, the highest numbers of isolates was recovered during fall, and therefore, to determine the monthly variation, MANOVA was performed on E. coli fingerprints (2011, n = 121; 2012, n = 143; 2013, n = 137) obtained in different months (September to November) of the fall season (Fig. 4A to C). The results indicated that the isolates clustered independently into their respective months, with a slight overlap between September and October in 2011 and October and November in 2012. However, for isolates obtained in 2013, the overlap can be seen among the three clusters. The first and second discriminants of MANOVA accounted for 100% of the canonical variation (2011, 87and 13%, respectively; 2012, 73 and 27%, respectively; 2013, 67 and 33%, respectively).
FIG 3.

MANOVA plot of rep-PCR DNA fingerprint patterns of E. coli strains isolated from Comox Lake in 2011 (n = 215), 2012 (n = 230), and 2013 (n = 213) by year (A) and season (B to D). A binary band-matching character table was analyzed by MANOVA, accounting for variance. Only the first two discriminants are presented in this graph, as shown by the distances along the x and y axes.
FIG 4.
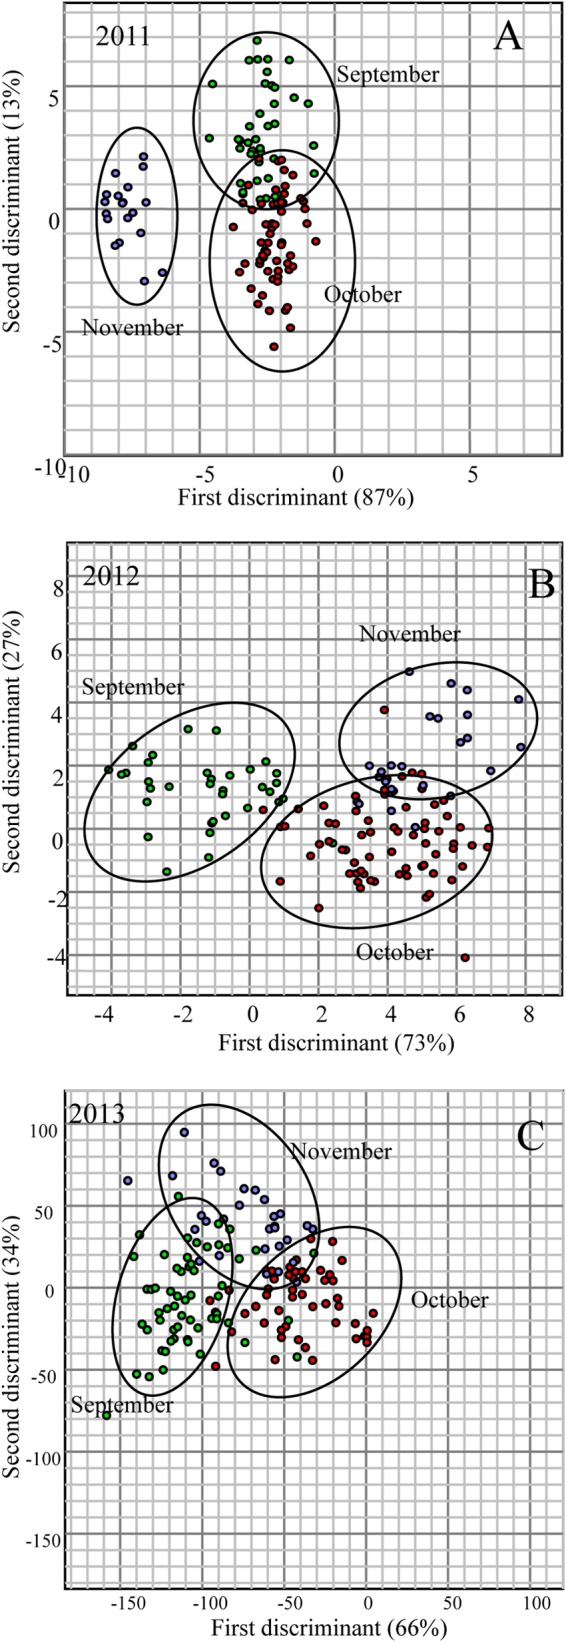
MANOVA plot of rep-PCR DNA fingerprint patterns of E. coli strains isolated from Comox Lake during different months of the fall season in 2011 (n = 121) (A), 2012 (n = 143) (B), and 2013 (n = 137) (C). A binary band-matching character table was analyzed by MANOVA, accounting for variance. Only the first two discriminants are presented in this graph, as shown by the distances along the x and y axes.
DISCUSSION
Despite the significance of E. coli as a traditional indicator bacterium, its importance as a potential pathogen has not been widely evaluated in most routine water quality monitoring programs, as some of the E. coli strains acquired pathogenicity and have been involved in waterborne outbreaks (8–11). Understanding the potential threat associated with their occurrence in drinking water sources is critical to assess public health risk and prevent waterborne infection. Furthermore, since the diversity of E. coli genotypes in the environment can fluctuate due to the influence of various environmental factors, it has been suggested that E. coli community dynamics must be examined in order to fully understand the ecology of this bacterium and its use for monitoring fecal contamination in the environment (42). Therefore, in the present study, the prevalence of virulence genes associated with pathogenic E. coli and the temporal (annual, seasonal, and monthly) variation in the genetic diversity and population structure of E. coli were examined at the drinking water intakes of Comox Lake over a period of 3 years.
Pathogenic potential of E. coli isolates.
The results of the present study revealed the occurrence of potentially pathogenic E. coli in the lake, as 37.69% of the isolates carried either a single gene or a combination of eae and stx2 genes associated with pathogenic E. coli. Overall, the prevalence of potential EPEC strains (only eae positive) was higher (26.74%) than the prevalence of potential STEC strains (only stx2 positive) (10.33%) and non-O157 EHEC strains (stx2 and eae positive and rfbO157 negative) (0.6%). It has been suggested that the occurrence of a single or multiple VGs in an E. coli strain does not necessarily indicate its pathogenicity unless it has the appropriate combination of VGs to cause disease in the host (43); however, VGs are ideal targets for determining the pathogenic potential of a given E. coli isolate (44). Recently, it was suggested that the direct screening of VGs in surface waters can be used as a tool to indicate water quality (45). However, in the absence of actual isolates, no conclusions could be drawn regarding the relative prevalence of pathotypes carrying VGs or the prevalence of potentially pathogenic E. coli strains (46). In contrast, in the present study, we evaluated the presence of VGs in E. coli isolates obtained from water, indicating the actual presence of E. coli strains carrying VGs in the water, which is more important from a public health point of view than detecting only the VGs directly from water without culturing the bacteria (45).
The significantly higher rate of detection of the eae gene in the present study was in agreement with the previously reported higher rate of detection of this gene in surface water (46). However, in that study, eae was detected in association with other genes in 56% of the isolates, and only eae was present in 3% of the isolates. This suggests that in the present study, the occurrence of potential EPEC strains harboring only the eae gene (26.74%) was significantly greater than that reported previously by Sidhu et al. (46). All these eae-positive strains were confirmed to be atypical EPEC, as they did not possess the EAF plasmid (15). EPEC is a major causative agent of gastrointestinal disease in the developing world (8), but developed countries have also witnessed outbreaks due to this pathogen (9, 16); among them, outbreaks caused by typical EPEC are more prevalent in developing countries, while atypical EPEC seems to be more important in developed countries (17). Taken together, these results indicate that the presence of potential atypical EPEC in this water may represent a potential public health risk.
All the strains designated non-O157 STEC carried only the stx2 gene. Although eae is an important virulence determinant in STEC infection, this gene was not found in association with most of the stx2-positive isolates, except for four isolates in which eae was detected in addition to stx2 and which were identified as non-O157 EHEC strains. The surveillance of Shiga toxin in stool specimens from diarrheal patients in Canada has revealed that a substantial portion of STEC illness is due to non-O157 STEC strains (47, 48). Furthermore, in BC, Canada, the rate of STEC infections has remained above the Canadian average since 2004, ranging between 2.4 and 4.3 cases/100,000 individuals (14). While considering the reported health risk posed by STEC, the presence of eae-negative non-O157 STEC strains observed in the present study could be a heath concern as outbreaks of bloody diarrhea and hemolytic-uremic syndrome (HUS) caused by non-O157 STEC strains lacking the eae gene (18, 49), suggesting that the primary virulence trait responsible for causing HUS is the production of Shiga toxin. It has also been documented that the stx2 gene was more strongly correlated with severe human disease than was stx1 (43, 50), indicating the importance of stx2 in human infection.
Although the prevalence is low, it is important to note the presence of non-O157 EHEC strains carrying both the eae and stx2 genes together, as this combination of genes is known to cause severe diarrhea in humans (10, 43, 51). The estimated annual occurrence of waterborne and foodborne infection due to this pathogens is ∼37,000 cases, with ∼1,000 hospitalizations and 30 deaths, and it is as dangerous as E. coli O157 (51). Similar to our results, the presence of STEC has been detected in other surface waters (25, 26). It has been observed that the occurrence of these potentially atypical EPEC and non-O157 STEC strains was significantly greater in the fall season, and more importantly, non-O157 EHEC strains were detected only in fall. A strong correlation (r2 = 0.980851) was observed for the number of E. coli strains obtained in the fall season and the presence of VGs. The higher prevalence of these pathogens in the fall season may be due to increased rainfall resulting in a higher loading of E. coli strains carrying various virulence genes into the water. Considering the strong association of rainfall in the reported waterborne outbreaks in Canada (10, 52) and the United States (53), the greater occurrence of pathogens in the fall season could be a health concern. In view of this, it is important to note that the CVRD issued a boil water advisory on 27 October 2014 to the users of Comox Lake water due to the heavy rainfall and advised boiling of drinking water and minimization of nonessential water use (http://www.comoxvalleyrd.ca/EN/meta/whats-new/news-archives/2014-news/boil-water-advisory-for-all-users-of-the-comox-valley-water-system.html).
This indicates the increased risk associated with high rainfall in fall, which further substantiates our findings on the higher rate of detection of these pathogens in fall and the related health risks.
Pollution of surface waters with pathogenic strains of E. coli has been implicated in an increased number of disease outbreaks and consequent deaths (9–11). In general, the pathogens that could be expected to occur in contaminated waters are dependent on the host source reservoir from which they are derived. MST has provided evidence for the contamination of surface water from various animal sources and their contribution of pathogens to the surface water (54, 55). Since Comox Lake is a forest-dominated watershed, the pathogens detected in the present study could primarily originate from animals present in the watershed. Furthermore, the relative input of pathogens into water is dependent on the distribution and frequency of these pathogens in the animal sources that share the same watershed. This is supported by our previous studies in BC, Canada, in which E. coli strains (n = 1,005) isolated from fecal material from 34 animal sources (avian, n = 15; animal, n = 19) collected from different watersheds were screened for the presence of various virulence gene (21, 22). The results revealed that EPEC and STEC were the predominant pathogens detected in these animals. Therefore, it can be suggested that the high prevalence of EPEC and STEC detected in present study was possibly due to their higher frequency of distribution in the animals present in this watershed. The lower frequency of non-O157 EHEC and the absence of ETEC and EIEC in present study can also be explained by our previous study, as the prevalence of these pathogens was relatively low or there were no pathogens detected in the animals studied (21, 22). Therefore, based on the distribution of various pathogenic E. coli strains from different animal and avian sources reported in our previous studies of different BC watersheds, it can be suggested that the pathogens detected in the present study could originate from any of these host sources present in the watershed as result of fecal contamination. However, MST studies should be conducted to confirm the source of contamination in this watershed, and therefore, future studies will focus on MST to find the source of E. coli pathogens in the water. Since the presence of a single or multiple VGs in an E. coli strain does not necessarily indicate the pathogenicity of that strain, screening of more virulence genes, serotyping, and other assays are required to determine its ability to cause infection. Overall, the results indicate that the presence of potentially pathogenic atypical EPEC, non-O157 STEC, and non-O157 EHEC strains at the drinking water intakes of Comox Lake may pose a potential health risk to humans when untreated water is consumed directly or indirectly and highlight the need to screen the VGs of E. coli isolates obtained from surface water samples in conjunction with enumeration of E. coli in water samples in order to assess the potential public health threat associated with these pathogens.
Genetic diversity and population structure.
The rep-PCR fingerprint analysis revealed that the E. coli isolates obtained from Comox Lake exhibited a high degree of genetic variability, with various annual and seasonal influences. Although no significant difference in the total diversity of E. coli strains obtained in 2011 and 2012 was observed (H′, 3.7), the relatively lower diversity detected for E. coli strains obtained in 2013 (H′, 1.69) was attributed to the high numbers (73%; 155/213) of clonal isolates (over 92% similarity). We also observed variation in E. coli diversity during different seasons in all 3 years. The highest number of E. coli isolates recovered in the fall season indicates that the maximum loading of E. coli occurred in this season. Overall, ∼51% (n = 335) of the genotypes identified in the present study were unique, and the corresponding diversity index was higher than those previously reported for different surface waters dominated by urban land use watersheds in the United States (30, 31) and farming land use watersheds in Canada (56), indicating the high genetic diversity of E. coli isolates obtained in the present study. However, the diversity index recorded in the present study was lower than that for isolates from an urban river (4), the Catoma Creek watershed in Alabama (54%) (35). It has been documented that E. coli strains isolated from contaminated surface water had less diversity than isolates obtained from human and nonhuman host sources (4). However, contrary to that finding, the combined diversity observed in the present study was higher than that for E. coli genotypes obtained from various animal and avian host sources in different Canadian watersheds (21, 22). Although the high genetic diversity of E. coli observed in our study was in agreement with previous results obtained for various aquatic environments (4, 30, 31, 34), it is difficult to directly compare measures of diversity based on different molecular methods. In general, the sources of E. coli in contaminated surface water are dependent on the host source (animal) origin from which they are derived and their presence in the watershed. Many source tracking studies have identified humans and animals as the dominant sources of E. coli in contaminated water. Based on the extensive genetic diversity observed for E. coli strains isolated from diverse animal and avian host sources in our previous studies conducted in various Canadian watersheds (21, 22) as well as the diversity reported for different host groups in other studies (28, 29), it can be suggested that the genetic diversity observed in the present study may reflect the likely contributing host sources present in the watershed.
It was observed by MANOVA that the majority of the E. coli isolates were clustered according to their assigned groups (year, month, and season), which indicates that the occurrence of E. coli populations had some association with the year, month, and season. Considerable temporal clustering was evident when E. coli fingerprint data from all the years were compared (Fig. 3A). A large proportion of the isolates obtained over the years, particularly in 2013, showed significant (P < 0.001) separation. This indicated that a shift in the E. coli population structure was occurring on an annual scale. Similar temporal clustering among Cladophora-associated E. coli populations obtained from Lake Michigan (30, 57) also demonstrated the annual shifting of E. coli populations over multiple years, supporting our findings.
The data were examined individually in each year to determine the seasonal population structure of E. coli isolates. MANOVA showed that there was considerable distinction among E. coli populations obtained in different seasons. This result indicates that there was strong shift in the population structure of E. coli in different seasons. As demonstrated in Fig. 2B, the independent clustering of the isolates obtained in fall and winter indicates the distinctive nature of these isolates, while the isolates obtained in summer and spring shared the same cluster, indicating a greater similarity of these isolates. Furthermore, in 2012, isolates obtained in fall and summer clustered separately, while the isolates obtained in spring and winter fell into the same cluster (Fig. 2C). In 2013, the isolates obtained in spring tended to share the cluster with fall and winter isolates, but this is not clear and may be due to the relatively low number of isolates obtained in spring (Fig. 2D). Nevertheless, the independent clustering of the majority of the E. coli isolates collected in different months (September to November) of the fall season over multiple years shows that there was a considerable relationship between the presence of E. coli and the month of collection (Fig. 2A to C), as MANOVAs consistently showed a significant separation of the isolates by month. The results further indicate that the shifting of the E. coli population was also occurring on a monthly scale. In agreement with our results, season-specific clustering of E. coli genotypes was observed previously for different surface waters (35, 42).
It has been evident from previous studies that host-specific E. coli genotypes were present in different host sources, and this host specificity makes the use of DNA fingerprint-based methods for source tracking purposes possible (28, 41). As the study site is a forest-dominated watershed, the primary contributing source of E. coli in the lake is assumed to be wildlife. Recently, temporal variation on an annual scale was observed for E. coli isolates obtained from different fecal pollution sources (animals) in BC, Canada (21, 22). Seasonal changes in fecal contamination sources have also been reported for spring samples originating mainly from treated wastewater effluent, whereas the percentage of E. coli strains from waterfowl increased from summer to autumn (58). Therefore, the temporal variation/association of E. coli on annual, seasonal, and monthly scales observed in the present study may be attributed to the variations in the contributing host sources (animals) from which they are originally derived, their dominance/activity during a particular time/season (28, 32, 33, 35), temporal variability or instability (9), and high clonal diversity from host or geographic locations (59). Overall, the results of fingerprint analyses indicated that the diversity and population structure of E. coli fluctuate on a temporal scale, reflecting the presence of diverse host sources and their behavior over time in the watershed. However, future work focusing on MST is required to determine the variations in contributing host sources present in the watershed.
ACKNOWLEDGMENTS
We thank Joyce Tze Yun Sun for laboratory assistance.
This research was supported by NSERC-Industry Research Chair Program, NSERC-Strategic Network Program (Reseau-WaterNet), and Public Health Agency of Canada grants to A.M.
REFERENCES
- 1.Messner M, Shaw S, Regli S, Rotert K, Blank V, Soller J. 2006. An approach for developing a national estimate of waterborne disease due to drinking water and a national estimate model application. J Water Health 4:201–240. doi: 10.2166/wh.2006.024. [DOI] [PubMed] [Google Scholar]
- 2.WHO. 2004. Guidelines for drinking-water quality. World Health Organization, Geneva, Switzerland. [Google Scholar]
- 3.Leclerc H, Mossel DAA, Edberg SC, Struijk CB. 2001. Advances in the bacteriology of the coliform group: their suitability as markers of microbial safety. Annu Rev Microbiol 55:201–234. doi: 10.1146/annurev.micro.55.1.201. [DOI] [PubMed] [Google Scholar]
- 4.McLellan SL. 2004. Genetic diversity of Escherichia coli isolated from urban rivers and beach water. Appl Environ Microbiol 70:4658–4665. doi: 10.1128/AEM.70.8.4658-4665.2004. [DOI] [PMC free article] [PubMed] [Google Scholar]
- 5.Mott J, Smith A. 2011. Library-dependent source tracking methods, p 31–59. In Hagedorn C, Blanch AR, Harwood VJ (ed), Microbial source tracking: methods, applications, and case studies. Springer Publishing Co, London, England. [Google Scholar]
- 6.Wuertz S, Wang D, Reischer GH, Farnleitner AH. 2011. Library-independent bacterial source tracking methods, p 61–112. In Hagedorn C, Blanch AR, Harwood VJ (ed), Microbial source tracking: methods, applications, and case studies. Springer Publishing Co, London, England. [Google Scholar]
- 7.Edge TA, Schaefer KA (ed). 2006. Microbial source tracking in aquatic ecosystems: the state of the science and an assessment of needs. National Water Research Institute, Burlington, Ontario, Canada. [Google Scholar]
- 8.Nataro JP, Kaper JB. 1998. Diarrheagenic Escherichia coli. Clin Microbiol Rev 11:142–201. [DOI] [PMC free article] [PubMed] [Google Scholar]
- 9.Jenkins C, Lawson AJ, Cheasty T, Willshaw GA, Wright P, Dougan G, Frankel G, Smith HR. 2003. Subtyping intimin genes from enteropathogenic Escherichia coli associated with outbreaks and sporadic cases in the United Kingdom and Eire. Mol Cell Probes 17:149–156. doi: 10.1016/S0890-8508(03)00046-X. [DOI] [PubMed] [Google Scholar]
- 10.Hrudey SE, Payment P, Huck PM, Gillham RW, Hrudey EJ. 2003. A fatal waterborne disease epidemic in Walkerton, Ontario: comparison with other waterborne outbreaks in the developed world. Water Sci Technol 47(3):7–14. [PubMed] [Google Scholar]
- 11.Hunter PR. 2003. Drinking water and diarrhoeal disease due to Escherichia coli. J Water Health 1:65–72. [PubMed] [Google Scholar]
- 12.Bruneau A, Rodrigue H, Ismael J, Dion R, Allard R. 2004. Outbreak of E. coli O157:H7 associated with bathing at a public beach in the Montreal-Centre region. Can Commun Dis Rep 30:133–136. [PubMed] [Google Scholar]
- 13.Nwachuku N, Gerba CP. 2008. Occurrence and persistence of Escherichia coli O157:H7 in water. Rev Environ Sci Biotechnol 7:267–273. doi: 10.1007/s11157-008-9132-0. [DOI] [Google Scholar]
- 14.British Columbia Centre for Disease Control. 2011. British Columbia annual summary of reportable diseases. British Columbia Centre for Disease Control, Vancouver, British Columbia, Canada: http://www.bccdc.ca/util/about/annreport/default.htm. [Google Scholar]
- 15.Kaper JB, Nataro JP, Mobley HL. 2004. Pathogenic Escherichia coli. Nat Rev Microbiol 2:123–140. doi: 10.1038/nrmicro818. [DOI] [PubMed] [Google Scholar]
- 16.Nguyen RN, Taylor LS, Tauschek M, Robins-Browne RM. 2006. Atypical enteropathogenic Escherichia coli infection and prolonged diarrhea in children. Emerg Infect Dis 12:597–603. doi: 10.3201/eid1204.051112. [DOI] [PMC free article] [PubMed] [Google Scholar]
- 17.Trabulsi LR, Keller R, Gomes TAT. 2002. Typical and atypical enteropathogenic Escherichia coli. Emerg Infect Dis 8:508–513. doi: 10.3201/eid0805.010385. [DOI] [PMC free article] [PubMed] [Google Scholar]
- 18.Caprioli A, Morabito S, Brugère H, Oswald E. 2005. Enterohaemorrhagic Escherichia coli: emerging issues on virulence and modes of transmission. Vet Res 36:289–311. doi: 10.1051/vetres:2005002. [DOI] [PubMed] [Google Scholar]
- 19.Fairbrother JM, Nadeau É. 2006. Escherichia coli: on-farm contamination of animals. Rev Sci Tech 25:555–569. [PubMed] [Google Scholar]
- 20.Ishii S, Meyer KP, Sadowsky MJ. 2007. Relationship between phylogenetic groups, genotypic clusters, and virulence gene profiles of Escherichia coli strains from diverse human and animal sources. Appl Environ Microbiol 73:5703–5710. doi: 10.1128/AEM.00275-07. [DOI] [PMC free article] [PubMed] [Google Scholar]
- 21.Chandran A, Mazumder A. 2013. Prevalence of diarrhea-associated virulence genes and genetic diversity in Escherichia coli isolates from fecal material of various animal hosts. Appl Environ Microbiol 79:7371–7380. doi: 10.1128/AEM.02653-13. [DOI] [PMC free article] [PubMed] [Google Scholar]
- 22.Chandran A, Mazumder A. 2014. Occurrence of diarrheagenic virulence genes and genetic diversity in Escherichia coli isolates from fecal material of various avian hosts in British Columbia, Canada. Appl Environ Microbiol 80:1933–1940. doi: 10.1128/AEM.03949-13. [DOI] [PMC free article] [PubMed] [Google Scholar]
- 23.Hamelin K, Bruant G, El-Shaarawi A, Hill S, Edge TA, Bekal S, Fairbrother JM, Harel J, Maynard C, Masson L, Brousseau R. 2006. Avirulence and antimicrobial resistance DNA microarray detects a high frequency of virulence genes in Escherichia coli from Great Lakes recreational waters. Appl Environ Microbiol 72:4200–4206. doi: 10.1128/AEM.00137-06. [DOI] [PMC free article] [PubMed] [Google Scholar]
- 24.Hamelin K, Bruant G, El-Shaarawi A, Hill S, Edge TA, Fairbrother J, Harel J, Maynard C, Masson L, Brousseau R. 2007. Occurrence of virulence and antimicrobial resistance genes in Escherichia coli isolates from different aquatic ecosystems within the St. Clair River and Detroit River areas. Appl Environ Microbiol 73:477–484. doi: 10.1128/AEM.01445-06. [DOI] [PMC free article] [PubMed] [Google Scholar]
- 25.Jokinen CC, Schreier H, Mauro W, Taboada E, Isaac-Renton JL, Topp E, Edge T, Thomas JE, Gannon VP. 2010. The occurrence and sources of Campylobacter spp., Salmonella enterica and Escherichia coli O157:H7 in the Salmon River, British Columbia, Canada. J Water Health 8:374–386. doi: 10.2166/wh.2009.076. [DOI] [PubMed] [Google Scholar]
- 26.Jokinen C, Edge TA, Ho S, Koning W, Laing C, Mauro W, Medeiros D, Miller J, Robertson W, Taboada E, Thomas JE, Topp E, Ziebell K, Gannon VP. 2011. Molecular subtypes of Campylobacter spp., Salmonella enterica and Escherichia coli O157:H7 isolated from faecal and surface water samples in the Oldman River watershed, Alberta, Canada. Water Res 45:1247–1257. doi: 10.1016/j.watres.2010.10.001. [DOI] [PubMed] [Google Scholar]
- 27.McLellan SL, Daniels AD, Salmore AK. 2003. Genetic characterization of Escherichia coli populations of host sources of fecal pollution by using DNA fingerprinting. Appl Environ Microbiol 69:2587–2594. doi: 10.1128/AEM.69.5.2587-2594.2003. [DOI] [PMC free article] [PubMed] [Google Scholar]
- 28.Johnson LK, Brown MB, Carruthers EA, Ferguson JA, Dombek PE, Sadowsky MJ. 2004. Sample size, library composition, and genotypic diversity among natural populations of Escherichia coli from different animals influence accuracy of determining sources of fecal pollution. Appl Environ Microbiol 70:4478–4485. doi: 10.1128/AEM.70.8.4478-4485.2004. [DOI] [PMC free article] [PubMed] [Google Scholar]
- 29.Anderson MA, Whitlock JE, Harwood VJ. 2006. Diversity and distribution of Escherichia coli genotypes and antibiotic resistance phenotypes in feces of humans, cattle, and horses. Appl Environ Microbiol 72:6914–6922. doi: 10.1128/AEM.01029-06. [DOI] [PMC free article] [PubMed] [Google Scholar]
- 30.Byappanahalli MN, Whitman RL, Shively DA, Ferguson J, Ishii S, Sadowsky M. 2007. Population structure of Cladophora-borne Escherichia coli in nearshore water of Lake Michigan. Water Res 41:3649–3654. doi: 10.1016/j.watres.2007.03.009. [DOI] [PubMed] [Google Scholar]
- 31.Casarez EA, Pillai SD, Di Giovanni GD. 2007. Genotype diversity of Escherichia coli isolates in natural waters determined by PFGE and ERIC PCR. Water Res 41:3643–3648. doi: 10.1016/j.watres.2007.03.020. [DOI] [PubMed] [Google Scholar]
- 32.Byappanahalli MN, Whitman RL, Shively DA, Sadowsky MJ, Ishii S. 2006. Population structure, persistence, and seasonality of autochthonous Escherichia coli in temperate, coastal forest soil from a Great Lakes watershed. Environ Microbiol 8:504–513. doi: 10.1111/j.1462-2920.2005.00916.x. [DOI] [PubMed] [Google Scholar]
- 33.Ishii S, Ksoll WB, Hicks RE, Sadowsky MJ. 2006. Presence and growth of naturalized Escherichia coli in temperate soils from Lake Superior watersheds. Appl Environ Microbiol 72:612–621. doi: 10.1128/AEM.72.1.612-621.2006. [DOI] [PMC free article] [PubMed] [Google Scholar]
- 34.Kon T, Weir SC, Howell ET, Lee H, Trevors JT. 2007. Genetic relatedness of Escherichia coli isolates in interstitial water from a Lake Huron (Canada) beach. Appl Environ Microbiol 73:1961–1967. doi: 10.1128/AEM.02437-06. [DOI] [PMC free article] [PubMed] [Google Scholar]
- 35.Udenika Wijesinghe R, Feng Y, Wesley Wood C, Stoeckel DM, Shaw JN. 2009. Population dynamics and genetic variability of Escherichia coli in a mixed land-use watershed. J Water Health 7:484–496. doi: 10.2166/wh.2009.105. [DOI] [PubMed] [Google Scholar]
- 36.CH2MHILL. 2009. Comox Lake Watershed assessment. Comox Lake intake conceptual design. Prepared for Comox Valley Regional District. Report CH2MHILL, Burnaby, British Columbia, Canada. [Google Scholar]
- 37.CH2MHILL. 2009. Comox Lake Watershed assessment: contaminant source inventory. Report. CH2MHILL, Burnaby, British Columbia, Canada. [Google Scholar]
- 38.Holt JG, Krieg NR, Sneath PHA, Staley JT, Williams ST (ed). 1994. Bergey's manual of determinative bacteriology, 9th ed Williams & Wilkins, Hagerstown, MD. [Google Scholar]
- 39.Chen J, Griffiths MW. 1998. PCR differentiation of Escherichia coli from other Gram-negative bacteria using primers derived from the nucleotide sequences flanking the gene encoding the universal stress protein. Lett Appl Microbiol 27:369–371. doi: 10.1046/j.1472-765X.1998.00445.x. [DOI] [PubMed] [Google Scholar]
- 40.Mohapatra BR, Broersma K, Mazumder A. 2007. Comparison of five rep-PCR genomic fingerprinting methods for differentiation of fecal Escherichia coli from humans, poultry and wild birds. FEMS Microbiol Lett 277:98–106. doi: 10.1111/j.1574-6968.2007.00948.x. [DOI] [PubMed] [Google Scholar]
- 41.Dombek PE, Johnson LK, Zimmerley ST, Sadowsky MJ. 2000. Use of repetitive DNA sequences and the PCR to differentiate Escherichia coli isolates from human and animal sources. Appl Environ Microbiol 66:2572–2577. doi: 10.1128/AEM.66.6.2572-2577.2000. [DOI] [PMC free article] [PubMed] [Google Scholar]
- 42.Jang J, Unno T, Lee SW, Cho KH, Sadowsky MJ, Ko G, Kim JH, Hur HG. 2011. Prevalence of season-specific Escherichia coli strains in the Yeongsan River Basin of South Korea. Environ Microbiol 13:3103–3113. doi: 10.1111/j.1462-2920.2011.02541.x. [DOI] [PubMed] [Google Scholar]
- 43.Boerlin P, McEwen SA, Boerlin-Petzold F, Wilson JB, Johnson RP, Gyles CL. 1999. Associations between virulence factors of Shiga toxin-producing Escherichia coli and disease in humans. J Clin Microbiol 37:497–503. [DOI] [PMC free article] [PubMed] [Google Scholar]
- 44.Kuhnert P, Boerlin P, Frey J. 2000. Target genes for virulence assessment of Escherichia coli isolates from water, food and the environment. FEMS Microbiol Rev 24:107–117. doi: 10.1111/j.1574-6976.2000.tb00535.x. [DOI] [PubMed] [Google Scholar]
- 45.Masters N, Wiegand A, Ahmed W, Katouli M. 2011. Escherichia coli virulence genes profile of surface waters as an indicator of water quality. Water Res 45:6321–6333. doi: 10.1016/j.watres.2011.09.018. [DOI] [PubMed] [Google Scholar]
- 46.Sidhu JP, Ahmed W, Hodgers L, Toze S. 2013. Occurrence of virulence genes associated with diarrheagenic pathotypes in Escherichia coli isolates from surface water. Appl Environ Microbiol 79:328–335. doi: 10.1128/AEM.02888-12. [DOI] [PMC free article] [PubMed] [Google Scholar]
- 47.Spika JS, Khakhria R, Michel P, Milley D, Wilson J, Waters J. 1998. Shiga toxin-producing Escherichia coli infections in Canada, p 23–29. In Kaper JB, O'Brien AD (ed), Escherichia coli O157:H7 and other Shiga toxin-producing E. coli strains. ASM Press, Washington, DC. [Google Scholar]
- 48.Thompson LH, Giercke S, Beaudoin C, Woodward D, Wylie JL. 2005. Enhanced surveillance of non-O157 verotoxin-producing Escherichia coli in human stool samples from Manitoba. Can J Infect Dis Med Microbiol 16:329–334. [DOI] [PMC free article] [PubMed] [Google Scholar]
- 49.Paton AW, Woodrow MC, Doyle RM, Lanser JA, Paton JC. 1999. Molecular characterization of a Shiga toxigenic Escherichia coli O113:H21 strain lacking eae responsible for a cluster of cases of hemolytic-uremic syndrome. J Clin Microbiol 37:3357–3361. [DOI] [PMC free article] [PubMed] [Google Scholar]
- 50.Käppeli U, Hächler H, Giezendanner N, Beutin L, Stephan R. 2011. Human infections with non-O157 Shiga toxin-producing Escherichia coli, Switzerland, 2000-2009. Emerg Infect Dis 17:180–185. doi: 10.3201/eid1702.100909. [DOI] [PMC free article] [PubMed] [Google Scholar]
- 51.Rasmussen MA, Casey TA. 2001. Environmental and food safety aspects of Escherichia coli O157:H7 infections in cattle. Crit Rev Microbiol 27:57–73. doi: 10.1080/20014091096701. [DOI] [PubMed] [Google Scholar]
- 52.Auld H, MacIver D, Klaassen J. 2004. Heavy rainfall and waterborne disease outbreaks: the Walkerton example. J Toxicol Environ Health A 67:1879–1887. doi: 10.1080/15287390490493475. [DOI] [PubMed] [Google Scholar]
- 53.Curriero FC, Patz JA, Rose JB, Subhash L. 2001. The association between extreme precipitation and waterborne disease outbreaks in the United States, 1948-1994. Am J Public Health 91:1194–1199. doi: 10.2105/AJPH.91.8.1194. [DOI] [PMC free article] [PubMed] [Google Scholar]
- 54.Krentz CA, Prystajecky N, Isaac-Renton J. 2013. Identification of fecal contamination sources in water using host-associated markers. Can J Microbiol 59:210–220. doi: 10.1139/cjm-2012-0618. [DOI] [PubMed] [Google Scholar]
- 55.Marti R, Gannon VP, Jokinen C, Lanthier M, Lapen DR, Neumann NF, Ruecker NJ, Scott A, Wilkes G, Zhang Y, Topp E. 2013. Quantitative multi-year elucidation of fecal sources of waterborne pathogen contamination in the South Nation River basin using Bacteriodales microbial source tracking marker. Water Res 47:2315–2324. doi: 10.1016/j.watres.2013.02.009. [DOI] [PubMed] [Google Scholar]
- 56.Lyautey E, Lu Z, Lapen DR, Wilkes G, Scott A, Berkers T, Edge TA, Topp E. 2010. Distribution and diversity of Escherichia coli populations in the South Nation river drainage basin, eastern Ontario, Canada. Appl Environ Microbiol 76:1486–1496. doi: 10.1128/AEM.02288-09. [DOI] [PMC free article] [PubMed] [Google Scholar]
- 57.Badgley BD, Ferguson J, Vanden Heuvel A, Kleinheinz GT, McDermott CM, Sandrin TR, Kinzelman J, Junion EA, Byappanahalli MN, Whitman RL, Sadowsky MJ. 2011. Multi-scale temporal and spatial variation in genotypic composition of Cladophora-borne Escherichia coli populations in Lake Michigan. Water Res 45:721–731. doi: 10.1016/j.watres.2010.08.041. [DOI] [PubMed] [Google Scholar]
- 58.Ishii S, Hansen DL, Hicks RE, Sadowsky MJ. 2007. Beach sand and sediments are temporal sinks and sources of Escherichia coli in Lake Superior. Environ Sci Technol 41:2203–2209. doi: 10.1021/es0623156. [DOI] [PubMed] [Google Scholar]
- 59.Gordon DM, Bauer S, Johnson JR. 2002. The genetic structure of Escherichia coli populations in primary and secondary habitats. Microbiology 148:1513–1522. [DOI] [PubMed] [Google Scholar]