

Summary
Understanding the mechanisms of cancer initiation will help to prevent and manage the disease. At present, the role of the breast microenvironment in transformation remains unknown. As BMP2 and BMP4 are important regulators of stem cells and their niches in many tissues, we investigated their function in early phases of breast cancer. BMP2 production by tumor microenvironment appeared to be specifically upregulated in luminal tumors. Chronic exposure of immature human mammary epithelial cells to high BMP2 levels initiated transformation toward a luminal tumor-like phenotype, mediated by the receptor BMPR1B. Under physiological conditions, BMP2 controlled the maintenance and differentiation of early luminal progenitors, while BMP4 acted on stem cells/myoepithelial progenitors. Our data also suggest that microenvironment-induced overexpression of BMP2 may result from carcinogenic exposure. We reveal a role for BMP2 and the breast microenvironment in the initiation of stem cell transformation, thus providing insight into the etiology of luminal breast cancer.
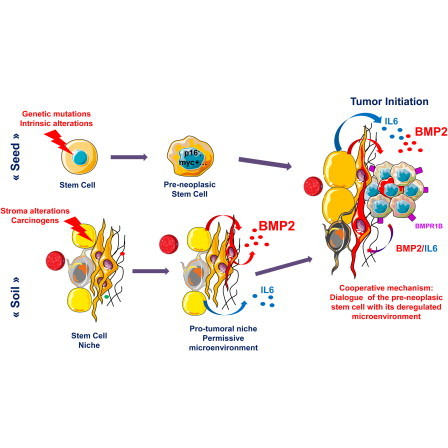
Graphical Abstract
Highlights
-
•
High BMP2 levels are provided by endothelial and stroma cells in luminal tumors
-
•
Chronic exposure to high BMP2 levels initiate mammary epithelial transformation
-
•
Luminal tumors likely arise from an amplified BMP2/BMPR1B-mediated normal response
-
•
Radiation and bisphenols perturbed BMP2 production by the mammary niche stroma
Carcinogens alter stromal cells, increasing local concentrations of BMP2 as specifically measured in human breast luminal tumors. Chronic exposure of immature mammary epithelial cells to high BMP2 levels initiated transformation toward a luminal tumor-like phenotype through the receptor BMPR1B. Maguer-Satta and colleagues show that the stem cell microenvironment could therefore represent a driving force to promote transformation and dictate the ultimate breast tumor subtype.
Introduction
Understanding the cell of origin of cancer is pivotal for a better prevention and more efficient cure of the disease. Some examples of cancers arising from the transformation of stem cells have been shown, but in most cases, the cell of origin remains unknown. In healthy tissue, the microenvironment (niche) governs the fate of stem cells by balancing their self-renewal and differentiation through the regulation of the availability of soluble molecules, cell-cell contact, cell-matrix interactions, and physical constraints (Maguer-Satta, 2011). Increasing evidence indicates that the microenvironment plays an active role in cancer, such as alterations of mesenchymal stem cells that promote the proliferation and dissemination of cancer cells (McLean et al., 2011). However, the role of the microenvironment in the initial steps of cell transformation remains unexplored.
The niche can affect normal stem cells and their malignant counterparts through soluble signals that create a carcinogenic microenvironment (Li et al., 2012). Among the soluble signals, inflammatory cytokines such as interleukin-6 (IL-6) play an important role in cancer (Iliopoulos et al., 2011; Vendramini-Costa and Carvalho, 2012). Abnormalities in bone morphogenetic protein (BMP) expression and their signaling pathway have also been reported in many systems (Davies et al., 2008; Thawani et al., 2010). BMP proteins are soluble members of the transforming growth factor β (TGF-β) superfamily that govern stem cell regulation in embryonic development, hematopoietic, neural, and epithelial systems, including the mammary gland (Alarmo et al., 2013; Forsman et al., 2013; Jeanpierre et al., 2008; Rendl et al., 2008). BMP signaling affects the stem cell niche both directly and indirectly (Zhang et al., 2003). Within this family, BMP2 and BMP4 are important regulators of both normal and cancer stem cells (Laperrousaz et al., 2013; Sagorny et al., 2012). In breast cancer, BMP2 and BMP4 have both protumor and antitumor functions (Balboni et al., 2013; Clement et al., 2005), but alterations of BMP receptors and their intracellular signal transducers SMAD1/5/8 clearly contribute to cancer progression and metastasis (Helms et al., 2005; Katsuno et al., 2008). Multiple abnormalities of BMP signaling have been reported in breast cancer, but available data only document a role in advanced disease, while effects on early transforming events remain to be identified.
Using primary tissue, we have analyzed the expression levels of BMP molecules in the breast microenvironment and signaling in normal mammary cells and tumors. We identified BMP2 as an important factor of the stem cell niche that regulates the luminal differentiation of mammary progenitors. Using a cell line model of immature human mammary epithelial cells, we investigated the impact of continuous deregulation of BMP levels on cell transformation. Our data evidence that some luminal breast tumors likely arose as a result of an amplified response of mammary stem cells to normal BMP2- and BMPR1B-mediated signaling. We provide evidence that the alteration of the microenvironment upon exposure to common carcinogens increases BMP2 production. We uncover a role for the BMP pathway in the origin of luminal breast cancer.
Results
Luminal Breast Tumors Exhibit Altered BMP2 Levels Provided by Tumor Microenvironment
We compared concentrations of BMP2 and BMP4 in the supernatant obtained from fresh normal, luminal, or basal tumor tissue. While no difference was observed for BMP4, BMP2 levels were significantly increased in luminal tumors compared with normal tissue or basal tumors (Figure 1A). By analyzing gene expression of the BMPs pathway (Figure S1A available online) using data from 161 primary breast tumors and three normal samples (Farmer et al., 2005), we found significant lower levels of BMP2 transcript in luminal tumor cells compared to normal samples (Figure 1B). BMP2 expression in normal and tumor tissue was examined by immunohistochemical (IHC) staining of breast tissue obtained from healthy donors or normal tissue area of luminal or basal tumor sections as well as analysis of a tumor microarray (TMA) of 440 tumors. In normal breast, BMP2 was mainly expressed by myo/basal epithelial cells and endothelial cells constituting vessels (Figure 1C). IHC analysis of tumor sections revealed only weak global staining of both basal and luminal tumors with almost no signal in epithelial tumor cells (Figure 1D). TMA IHC showed no significant differences in the percentage of BMP2-positive (50%) tumors with respect to tumor subtype (Figure 1E), and for both tumor subtypes, less than 20% percent of tumor cells stained positive (Figure 1F). It suggests that high levels of BMP2 detected in tumor supernatants are not produced by tumor cells themselves. To identify BMP-secreting cells, we analyzed BMP2 and BMP4 expression in different fractions of normal mammary tissue enriched in epithelial organoids, fibroblasts, adipocytes, and a variable mix of epithelial cells, hematopoietic cells, and other stromal cells (Stingl et al., 2005) (Figure S1B). Unlike BMP4, BMP2-expression was comparable across all fractions (Figure 2A). Flow cytometry revealed enrichment of mesenchymal, myoepithelial, and endothelial cells in the stromal and hematopoietic fraction (Figure S1C). Using IHC staining of serial sections of normal tissue for BMP2, pan-keratin, smooth muscle actin (SMA), and CD45, we identified epithelial cells (pan-keratin-positive), fibroblasts and other stromal cells (SMA-positive) as BMP2-secreting cells, while CD45-positive leukocytes rarely stained positive (Figure 2B). Based on cell morphology, the BMP2-positive cells detected in luminal tumors were classified as stromal cells and endothelial cells disseminated within the luminal tumor (Figure 2C). Accordingly, TMA quantification showed a consistent increase in the percentage of BMP2-positive vessels (2.1-fold) and stroma (1.5-fold) in luminal over basal tumors (Figure 2D). Finally, IHC analysis of serial luminal tumor sections confirmed that keratin-positive/SMA-negative epithelial tumor cells stained negative while CD31-positive endothelial cells clearly stained for BMP2 (Figures 2C and 2E). These results are consistent with the quantification of soluble BMP2 by ELISA (Figure 1A) and transcript analysis (Figures 2A and S1C), and identify endothelial cells of vessels as the principal source of BMP2 and to a lesser extent, fibroblasts, and other stromal cells. While in normal tissue, BMP2 is predominantly produced by normal myoepithelial cells, fibroblasts, stromal cells, and some rare luminal epithelial cells, in luminal tumors, increased BMP2 levels are produced by the microenvironment alone.
Figure 1.
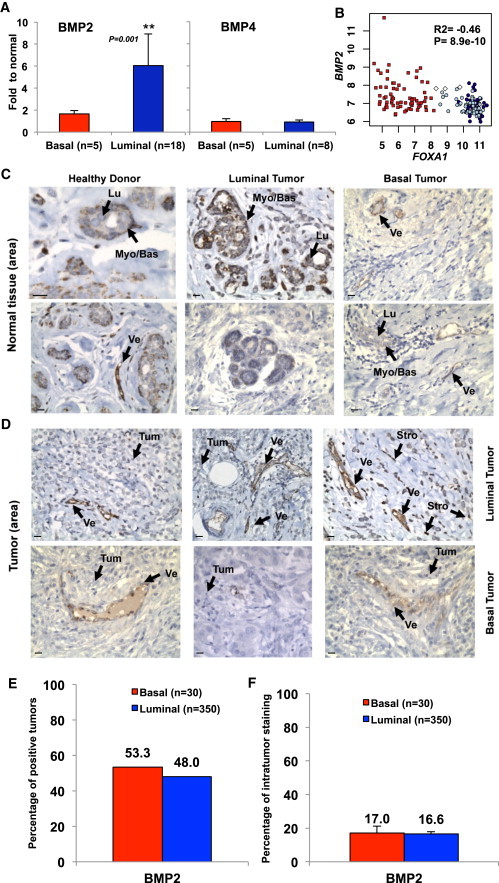
Luminal Breast Tumors Exhibit Altered BMP2 Expression
(A) ELISA quantification of BMP4 and BMP2 in supernatant obtained from normal (n = 6), basal tumor (n = 5), or luminal tumor (n = 17) samples. Data represent the ratio to normal ± SEM, ∗∗p < 0.001.
(B) Microarray analysis of BMP2 versus FOXA1 expression. White diamonds, normal samples; red squares, basal tumors; dark blue circles, luminal tumors; light blue circles, apocrine tumors. Pearson’s values of statistical testing R2 and p value are presented.
(C and D) IHC analysis of BMP2 expression in (C) normal breast tissue or (D) tumor area. Arrows indicate the following cells: myoepithelial/basal (Myo/Bas), luminal epithelial (Lu), tumor cells (Tum), stromal/fibroblast (Stro), or endothelial vessel (Ve). Scale bar represents 20 μm.
(E and F) Quantification of BMP2 IHC staining of 350 luminal and 30 basal tumors. (E) Percentage of tumors that stained positive for BMP2. (F) Percentage of BMP2-positive tumor area.
Figure 2.
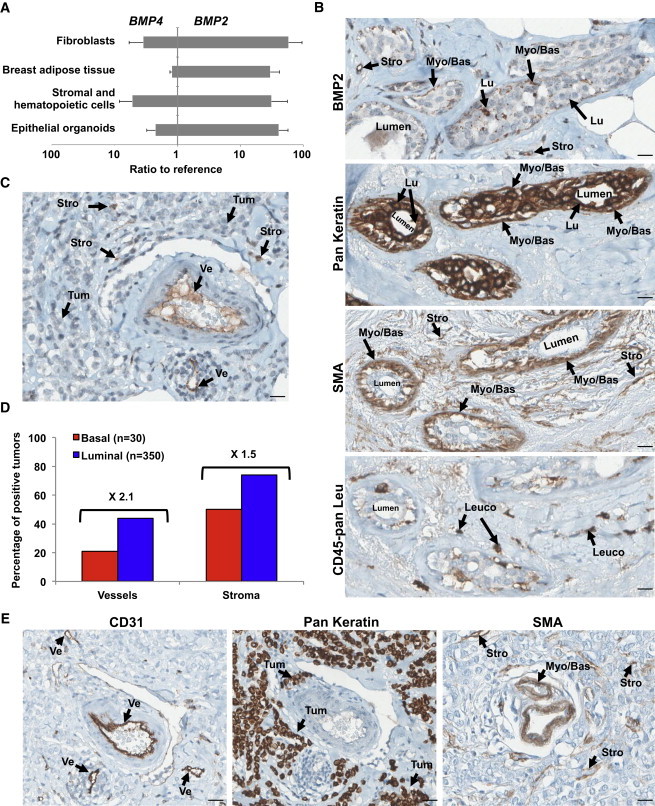
BMP2 Is Produced by Stromal and Endothelial Cells in Luminal Tumors
(A) qPCR analysis of BMP2 and BMP4 expression in indicated cellular fractions from normal human mammoplasty and adipose tissue samples. Data represent the mean ratio to reference ± SEM, n = 5 independent experiments.
(B, C, and E) IHC staining for BMP2, epithelial (Pan Keratin), SMA, endothelial (CD31), and pan leukocyte (CD45-pan Leu) of serial sections of the same luminal tumor. (B) Normal peritumoral tissue. (C and E) Tumor tissue. Arrows indicate the following cells: myoepithelial/basal (Myo/Bas), luminal epithelial (Lu), tumor cells (Tum), leukocytes (Leuco), stromal/fibroblast (Stro), or endothelial (Ve). Scale bar represents 20 μm.
(D) Quantification of BMP2 IHC staining of 350 luminal and 30 basal tumors. Data are presented as a percentage of BMP2-positive vessels or stromal cells for each subtype.
Deregulation of the Intrinsic BMP Pathway in Luminal Breast Tumors
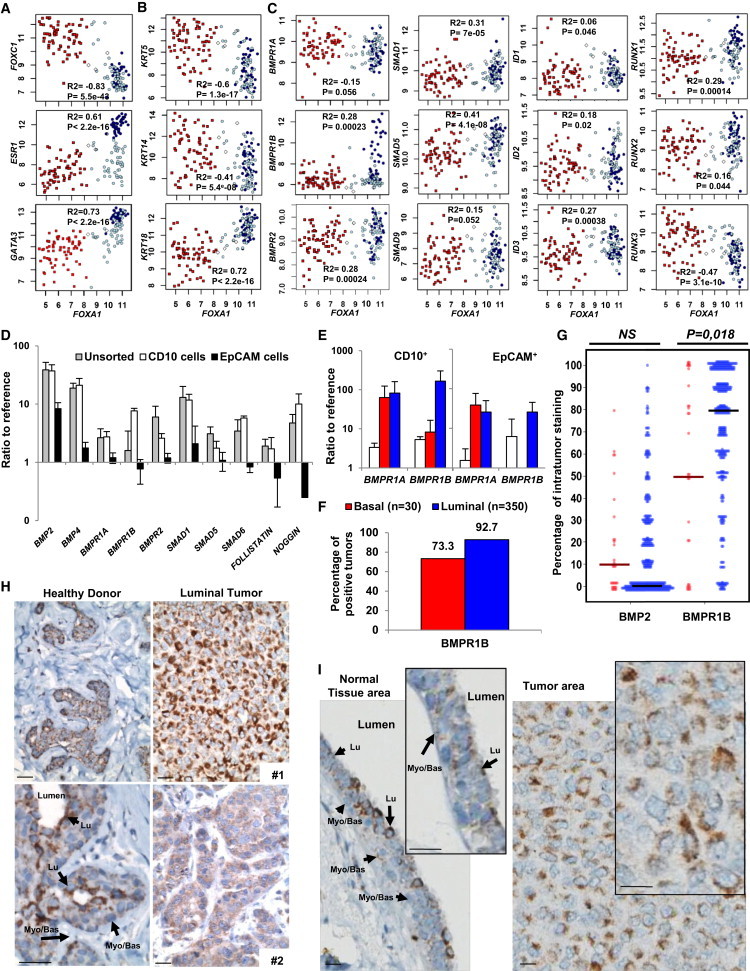
We analyzed Affymetrix data for a correlation of BMP pathway gene expression with breast cancer markers (Farmer et al., 2005). Breast cancer subtypes were classified as indicated in methods by estrogen receptor alpha (ESR1) and forkhead box transcription factor A1 (FOXA1) expression. Expression of FOXC1, a biomarker of aggressiveness and basal-like subtype, is inversely correlated with ESR1, GATA3, or FOXA1 (Figure 3A). FOXA1-positive luminal tumors expressed high KERATIN 18 and low KERATIN 14 and 5, as shown in both Affymetrix data and freshly isolated breast tumors (Figures 3B and S2E). The most striking BMP pathway alteration was a high expression of the BMP receptor type 1B (BMPR1B) in the majority of luminal tumors, while BMPR1A and BMPR2 receptors were expressed in a subtype-independent manner (Figure 3C). Expression of BMP-regulated SMAD5 and target genes RUNX1 and RUNX2 was increased in FOXA1-positive tumors, while SMAD1/6/7/9, ID1/2/3, and RUNX3 levels appeared either unchanged or repressed (Figures 3C and S2A).
Figure 3.
BMP2 Cooperates with IL-6 to Initiate Mammary Epithelial Cell Transformation
(A–C) Microarray analysis of normal and tumor samples for the expression of FOXA1 versus (A) FOXC1, ESR1 or GATA3; (B) KRT5, KRT14, or KRT18; (C) BMPR1A/1B/2, SMAD1/5/9, and target genes ID1/2/3 and RUNX1/2/3. White diamonds, normal samples; red squares, basal; dark blue circles, luminal; light blue circles, apocrine tumors. Pearson’s values of statistical testing R2 and p value are presented.
(D) Single cells derived from normal mammoplasties were sorted for CD10 and EpCAM, and qPCR analysis was performed for BMP signaling elements. The expression is represented as the mean ratio to reference ± SEM, n = 8.
(E) qPCR analysis of CD10+ and EpCAM+ subpopulations from normal tissue (white bars), luminal (blue bars) and basal (red bars) tumors for BMPR1A and BMPR1B. Data represent the mean ratio to reference ± SEM, n = 3. (D and E) n indicates the number of independent experiments.
(F and G) Quantification of BMPR1B IHC staining of 350 luminal and 30 basal tumors. (F) Percentage of tumors that stained positive for BMR1B. (G) Percentage of BMPR1B-positive tumor area for each tumor. Solid bars represent median values.
(H) IHC BMPR1B staining of mammoplasty tissue from two different healthy donors and luminal tumor tissue from two patients. Arrows indicate luminal (Lu) and myoepithelial (Myo/Bas) cells. Scale bar represents 20 μm.
(I) IHC BMPR1B staining of the same section of luminal tumor 1. (Left) Normal peritumoral tissue. (Right) Tumor tissue. Arrows indicate luminal (Lu) and myoepithelial (Myo/Bas) cells. Scale bar represents 20 μm.
We separated by flow cytometry luminal (EpCAM+) and immature/myoepithelial (CD10+) cells of primary normal and tumor tissue (Bachelard-Cascales et al., 2010; Keller et al., 2012). In the normal breast, all key elements of the BMP pathway were expressed (Figure 3D), but the CD10+ subpopulation was enriched for BMP2, BMP4, BMPR1B, and the negative regulators SMAD6 and NOGGIN. BMPR1A expression was overall increased in tumor compared with normal breast tissue (Figure 3E). In contrast, BMPR1B expression was higher in luminal than in basal tumors, and tumors expressed higher levels of BMPR1B in the CD10+ than in the EpCAM+ fraction, while subpopulations of the normal tissue displayed comparable levels of BMPR1B. Flow cytometry analysis confirmed these findings, suggesting that in luminal tumors, BMPR1B was predominantly expressed on the surface of immature/myoepithelial CD10+ cells but not EpCAM+ luminal cells (Figures S2B and S2C). IHC staining for BMPR1B and CD10 further showed that no significant staining is measured for CD10 (Figure S2D) while 93% of luminal tumors stained positive for BMPR1B compared with 73% of basal tumors (Figure 3F). On average, a higher percentage of tumor area stained positive in luminal tumors (Figure 3G), but the staining intensity varied between different tumor samples and cell types (Figure 3H). Higher magnification identified heterogenous location of BMPR1B staining predominantly in normal luminal cells and rare in myoepithelial/basal cells while tumor cells strongly expressed BMPR1B but mostly confined to the cytoplasm (Figures 3H and 3I). Our data indicate that luminal breast tumors, unlike basal tumors, are characterized by increased expression of BMPR1B.
BMP2 Initiates Malignant Transformation of Mammary Epithelial Cells
Our data indicate that luminal breast tumors are characterized by mammary epithelial cells expressing a high level of BMPR1B and exposed to elevated concentrations of BMP2. We then used the basal MCF10A cell line to evaluate whether chronic exposure of mammary epithelial stem cells to BMP2 could be involved in their transformation. The MCF10A cell line (nonmalignant fibrocystic mammary tissue, p16/CDKN2A deletion, MYC amplification) (Kadota et al., 2010) is considered as a model for immature mammary epithelial cells that differentiate in 3D culture (3D terminal ductal lobular unit [TDLU] assay) (Debnath et al., 2003; Neve et al., 2006). Used as a preneoplastic model, MCF10A cells form colonies in soft agar and tumors in mice after oncogenic events (Pires et al., 2013) favored by IL-6 (Van Huffel et al., 2011). MCF10A cells were exposed to long-term BMP2 or BMP4 treatment with or without IL-6 and assayed weekly for their tumorigenic properties in the absence of cytokines (Figure 4A). BMP4 and IL-6 alone or in combination had no effect, while BMP2 led to the formation of soft agar colonies (Figure 4B). The size of BMP2-induced colonies was not increased in the presence of IL-6 (Figures 4C and 4D). We analyzed the expression of classic luminal genes, KERATIN 18, ESR1, GATA3, and FOXA1 (Figures 3A and 3B). IL-6 or BMP2 alone had no obvious effect following 10 weeks of continuous treatment, while combined treatment led to an induction of ESR1, FOXA1, and BMPR1B (Figures 4F and S3A). No change was observed in BMPR1A, BMPR2, KERATIN 5, and 14 expression and immunofluorescent staining confirmed an increased KERATIN 18 expression (Figures 4E, 4F, S3A, and S3B). This molecular profile resembled that of epithelial cells isolated from primary luminal but not of basal-like tumors (Figures 4G and S3A). As expected, we observed a coexpression of ESR1, FOXA1, and GATA3 (a well-known regulator of luminal differentiation; Kouros-Mehr et al., 2006) characteristic to luminal tumors (Figures 3A and 4H). Accordingly, our model reliably reproduced this phenotype as time course analysis showed that BMP2 but not by IL-6-induced GATA3 (Figure 4I) while rapidly and progressively decreased FOXC1 (Figures 3A and 4J) expression. Conversely, FOXA1 upregulation occurred later (Figure 4K), suggesting that it constituted a secondary event not directly caused by BMP2. Therefore, upon chronic BMP2 exposure, a progressive switch of the FOXA1/FOXC1 ratio in favor of FOXA1 occurred, ultimately resulting in a luminal tumor phenotype and confirmed by the capacity of cells to respond to estrogen signaling (Figures S3C and S3D). Our data indicate a role for BMP2 in controlling GATA3 and the FOXA1/FOXC1 balance during the initiation of luminal tumors. In summary, we show that prolonged exposure to high BMP2 levels initiate immature mammary epithelial cells transformation, resulting in a luminal phenotype.
Figure 4.
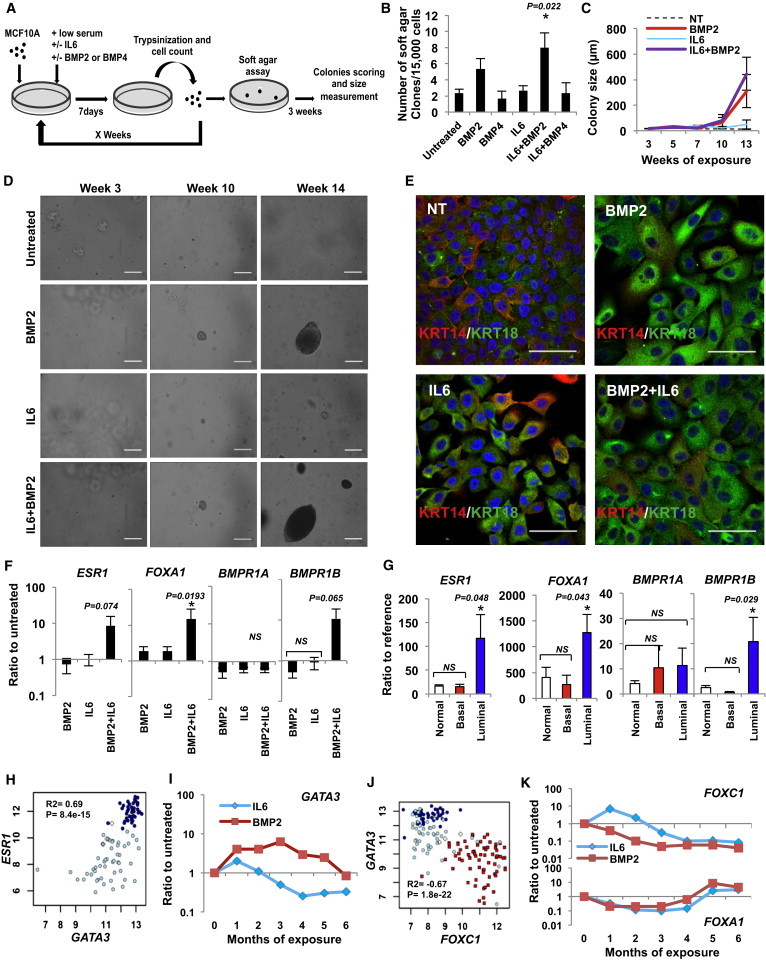
BMP2 Cooperates with IL-6 to Initiate Mammary Epithelial Cell Transformation
(A) Protocol representation: MCF10A cells were cultured for x weeks with chronic exposure to BMP2 or BMP4 ± IL-6 (10 ng/ml). Soft agar colony formation assays were performed at each passage and colonies were measured and counted after 3 weeks.
(B) Quantification of soft agar colonies at 14 weeks ± SEM, n = 6.
(C) Colony size corresponding to x weeks of treatment. Data are presented in μm ± SEM, n = 6.
(D) Bright-field images of soft agar clones after x weeks of BMP2 ± IL-6 treatment. Scale bar represents 200 μm.
(E) Immunofluorescent staining of MCF10A cells for keratin 14 (KRT14, red) and keratin 18 (KRT18, green) after chronic exposure to BMP2 ± IL-6. Scale bar represents 100 μm.
(F) qPCR analysis of ESR1, FOXA1, BMPR1A, and BMPR1B expression after 10-week BMP2 ± IL-6 treatment. Data represent the mean ratio to untreated cells ± SEM, n = 6, ∗p < 0.05. (B, C, and F) n indicates the number of independent experiments.
(G) qPCR analysis of ESR1, FOXA1, BMPR1, and BMPR1B expression in normal (n = 10), luminal (n = 16), and basal (n = 4) tumor samples; data represent the mean ratio to reference pool of mammary primary cells ± SEM, ∗p < 0.05.
(H and J) Microarray analysis of (H) GATA3 versus ESR1 expression in 92 FOXA1-positive tumors. (J) FOXC1 versus GATA3 expression in normal samples (white diamonds), basal (red squares), luminal (dark blue circles), and apocrine tumors (light blue circles). Pearson’s values of statistical testing R2 and p values are presented.
(I and K) Time course representative of six independent experiments of (I) GATA3 or (J) FOXA1 (upper) and FOXC1 (lower) expression in BMP2 versus IL-6-treated cells.
BMP2-Mediated Transformation Involves BMPR1B
We next followed BMPR1B expression over time and observed that it gradually increased upon prolonged BMP2 treatment (Figure 5A). The enrichment in BMPR1B-expressing cells was confirmed by flow cytometric analysis that showed an increase of 18% in membrane protein expression at 10 weeks, while BMPR1A expression remained unchanged (Figure 5B). BMPR1B induction (29%) was reproduced by intrinsic lentiviral-based overexpression of BMP2 in MCF10A cells (Figure 5C). This suggests that BMP2/IL-6 enriched in immature cells according to CD10-BMPR1B staining observed in both normal and luminal tumors (Figures 3D, 3F, S2C, and S2D) and further sustained by the increased ability of treated MCF10A to form ducts and lobules in the TDLU assay (Figure S4A). When MCF10A cells were purified based on BMPR1B expression and continuously exposed for only 4 weeks to BMP2 with or without IL-6, treated BMPR1B-negative cells did not form colonies (Figure 5D), while BMPR1B-postive cells formed colonies upon BMP2/IL-6 treatment (but not by IL-6 alone) at a rate 3.5 times higher (4 versus 14 weeks) than that of unsorted cells (Figures 4B–4D and 5D). To confirm that the observed effect was BMPR1B specific, we silenced its expression in purified BMPR1B-MCF10A cells (>99% purity) using a short hairpin RNA (shRNA) lentivirus directed against BMPR1B (Figure S4B). shControl and shBMPR1B cells were treated with BMP2/IL-6 and assayed for colonies in soft agar. shControl cells behaved like their nontransduced counterparts at 4 weeks of treatment (Figures 5D and 5E). In contrast, knockdown of BMPR1B decreased colony formation 5-fold (Figure 5E).
Figure 5.
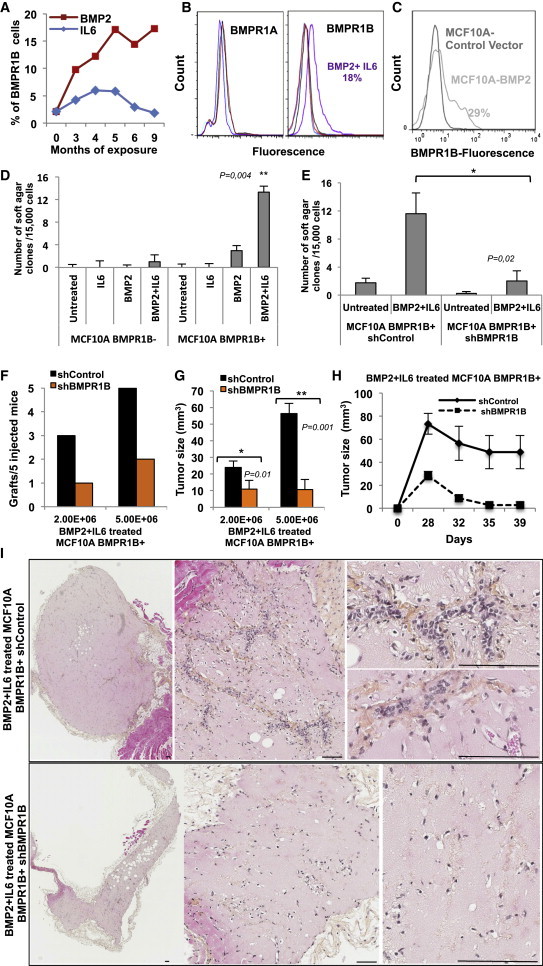
BMPR1B Is Required for the Initiation of Transformation of MCF10A Cells
(A) Flow cytometry analysis of BMPR1B expression in MCF10A cells over 9 months of BMP2 or IL-6 chronic exposure.
(B) Flow cytometry analysis of BMPR1A and BMPR1B expression in untreated (black) versus BMP2 (red), IL-6 (blue), or BMP2+IL-6-treated (purple) cells at 10 weeks.
(C) Flow cytometry analysis of MCF10A cells transduced with a control or BMP2 vector.
(D and E) Soft agar colonies numbers ± SEM from MCF10A cells exposed 4 weeks to BMP2 ± IL-6 of four independent experiments,∗p < 0.05, ∗∗p < 0.005, using either (D) flow cytometry-sorted BMPR1B+ and BMPR1B− cells or (E) BMPR1B+ cells from the same batch transduced with shControl or shBMPR1B lentiviral vector.
(F–I) Xenografts of the indicated number of shControl or shBMPR1B-expressing MCF10A cells in nude mice following 6 weeks of BMP2/IL-6 treatment. Data represent (F) number of successful grafts per number of mice and (G) mean tumor size in mm3 after 6 weeks ± SEM, n = 5 mice. (H) Time course of tumor growth following injection with 5E+06 cells. (I) Tumors were harvested after 6 weeks, paraffin embedded, and sectioned. Representative images of H&E stained sections are shown. Scale bar represents 60 μm.
Tumorigenicity of MCF10A cells expressing shControl or shBMPR1B constructs was tested by orthotopic injection into nude mice following 6 weeks of BMP2/IL-6 treatment. Tumor growth was monitored for 6 weeks prior to harvest, paraffin inclusion, and hematoxylin and eosin (H&E) staining. shControl cells engrafted with a higher frequency compared with shBMPR1B cells, and the average tumor size was significantly reduced in BMPR1B knockdown cells (Figures 5F and 5G). Tumor growth over time clearly showed the loss of transforming effect upon BMPR1B knockdown (Figure 5H). H&E staining of tumor sections showed that cells expressing BMPR1B induced the formation of an organized network of blood vessels containing red blood cells, which were surrounded by clusters of human cells that proliferated and formed abnormally large structures (Figure 5I). In contrast, BMPR1B knockdown cells were spread out, proliferated significantly less, and did not induce angiogenesis. Our data indicate that BMP2/IL-6-induced transformation enables MCF10A cells to engraft and proliferate and to form premalignant lesions in a BMPR1B-dependent manner. These results confirmed the involvement of BMPR1B in BMP2-mediated transformation of epithelial cells and further suggest that luminal tumors may originate in immature mammary epithelial cells.
BMP2 Sustains and Expands Luminal Progenitors and Is Induced by Carcinogens
While our data revealed an effect on luminal cell transformation exclusive to BMP2, normal stem/progenitor cells expressed most elements of the BMP signaling and are exposed to soluble BMP2 and BMP4 both present in adult healthy human breast tissue. Epithelial cells from normal tissue were enriched for immature cells by several passages in mammosphere culture and treated 7 days by BMPs in the absence of serum (Figure 6A). BMP2 or BMP4 decreased cellular proliferation 2-fold without any evidence of toxicity (Figures 6B, 6C, S5D, and S5E). To explore effects on stem cells, we treated cells in the epithelial common progenitor-derived colony (ECP-DC) assay (Figures 6A and S5A; Bachelard-Cascales et al., 2012) and observed with either BMP a decreased number of all types of derived progenitors; however, results were not statistical significant (Figure 6D). To evaluate whether this decrease in ECP-DC was due to a response of the sphere-forming compartment, sorted CD49f+CD10+EpCAM− cells (100 cells/well) were treated 1 week in mammospheres assay (Figure 6E) and showed a significantly reduced sphere-forming ability of cells in response to BMP4 than to BMP2 (Figure 6F). Subsequent seeding of the obtained single-sphere in epithelial colony-forming cell (E-CFC) assay revealed that only BMP2 significantly increased colony frequency (Figure 6G). To assess direct effect on committed progenitors, sphere-enriched immature cells were treated within the E-CFC assay. BMP4 treatment decreased all types of colonies (distinguished as described in the Supplemental Experimental Procedures and Figures S5B and S5C), while BMP2 reduced the number of mixed and myoepithelial colonies, but increased early and maintained late luminal progenitors (Figure 6H). Together with the increase in the E-CFC frequency (Figure 6G), it identifies BMP2 as a luminal lineage commitment factor. This was confirmed by treating sorted CD49f+CD10+EpCAM− immature cells or CD49f+CD10−EpCAM+ purified committed luminal progenitors. CD10-cells treated only in E-CFC assay (not during sphere-forming steps to exclude BMP-dependent effects on lineage commitment) showed that BMP4 and BMP2 maintained mixed colonies and decreased the number of committed progenitor-derived colonies of both lineages (Figure 6I). It indicates that several days of pre-exposure of immature cells to BMP2 is required to significantly increase luminal progenitors. Furthermore, BMP2 constitutes a growth factor for EpCAM-committed luminal progenitors, as increasing their numbers of derived early luminal CFCs (Lu-CFCs) and maintaining their late Lu-CFC content (Figure 6J). Therefore, in normal breast, BMP2 and BMP4 play different roles, with BMP4 that inhibit proliferation and differentiation of immature cells and BMP2 that promote engagement and expansion of luminal progenitors. These finding are in line with a specific role for BMP2 in the emergence of luminal tumors.
Figure 6.
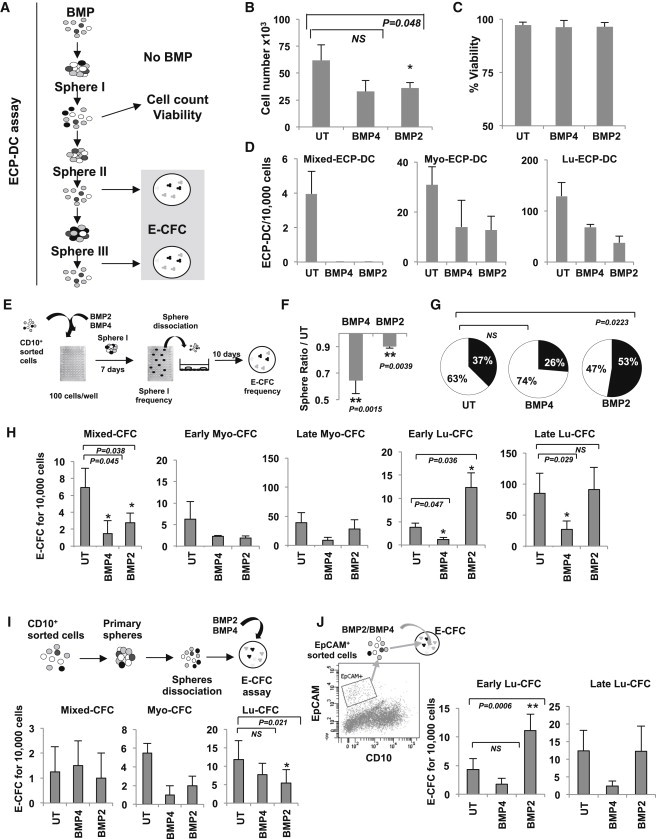
BMP2 and BMP4 Regulate Immature Human Epithelial Mammary Cells
(A) Schematic diagram of the ECP-DC assay to determine the influence of BMP treatment on stem cell content. Primary mammary epithelial cells were grown under mammosphere culture conditions ± 50 ng/ml BMP2 or BMP4 for 7 days over several passages. Spheres from 1+x passages were seeded in the ECP-DC assay without BMP treatment.
(B) Proliferation of cells in response to BMP treatment. Number of cells ± SEM, n = 6, ∗p < 0.05.
(C) Percentage of viable cells ± SEM, n = 6.
(D) Effect of BMP treatment on ECP-DC formation. Date represent the number of luminal (Lu-ECP-DC), myoepithelial (Myo-ECP-DC), and mixed ECP-DC colonies derived from secondary spheres ± SEM, n = 3.
(E) Schematic diagram depicting E-CFC assay for the analysis of progenitor content.
(F) Sphere formation in presence of 50 ng/ml BMP2/4. The sphere frequency is shown ± SEM, n = 7.
(G) The percentage of sphere-derived cells that form colonies are shown (n = 3). UT, untreated; white area of chart, no E-CFC formation; black, E-CFC.
(H) E-CFC assay: Cells were treated as shown in (E), and mixed, early/late myoepithelial, early/late luminal CFC (Mixed-CFC, Early Myo-CFC, Late Myo-CFC, Early Lu-CFC, and Late Lu-CFC) were scored as described in Figures S5B and S5C, ± SEM, n = 9.
(I) CD10+ cells were grown as spheres and seeded in the E-CFC assay in the presence of 50 ng/ml BMP2/4. The colony number is shown ± SEM, n = 4.
(J) EpCAM+ cells were directly seeded in the E-CFC assay ± 50 ng/ml BMP2/4. The colony number is shown ± SEM, n = 9, ∗p < 0.05. (B–D and F–J) n indicates the number of independent experiments.
To identify potential causes of deregulated BMP2 production, we tested the effect of radiation, shown to induce BMP2 in stromal cells (Sun et al., 2012) and important environmental pollutants involved in breast tumorigenesis, Bisphenol A(BPA), an estrogen mimetic, Bisphenol S (BPS), a BPA substitute with lower estrogen-receptor binding capacity, and Benzo[a]pyrene (BaP, an aromatic hydrocarbon) (Rundle et al., 2000; Weber Lozada and Keri, 2011). Cells isolated from mammoplasty or peripheral adipose tissue (Figure S1A) were precultured 2 days prior to irradiation or 5-day treatment with BPA, BPS, or BaP. BMP2 quantification in culture supernatants showed no significant effects of BaP on any cell subtype as well as unaffected adipose tissue-derived cells (Figure 7A). In contrast, breast fibroblasts produced more de novo BMP2 upon BPA (3.6-fold increase) and BPS (2.8-fold) exposure or irradiation (2.7-fold) than the mixed breast stroma fraction treated with BPA (3.7-fold), BPS (1.9-fold), or radiation (3.4-fold). This is consistent with a BMP2 production in luminal tumors by endothelial and stromal cells (Figures 2C–2E). Finally, fibroblast of patients with a breast cancer history are more prone to produce BMP2 in response to BPA treatment (78% increased BMP2 mRNA expression) as compared with samples derived from healthy donor tissue (Figure 7B). Secreted BMP2 protein was found in 33% of supernatants of BPA-treated cells from cancer patients and only in 10% of stroma from healthy donors (Figure 7C). Collectively, our data indicate that luminal tumors may arise from a carcinogen-perturbed BMP2 production by the microenvironment of mammary stem or progenitor cells, which in turn commit to a BMP2-driven luminal lineage and expand (Figure 7D).
Figure 7.
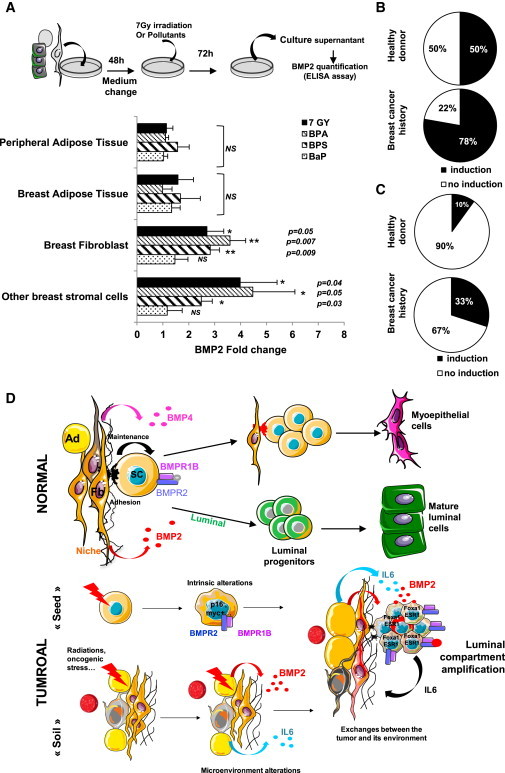
BMP2, which Production Is Induced by Carcinogens, Is Involved in Regulation and Transformation of Human Mammary Stem Cells
(A) ELISA quantification of BMP2 after exposure of peripheral adipose tissue (n = 7), breast adipose tissue (n = 4), breast fibroblasts (n = 6), and stromal cells (n = 9) to 7 Gy irradiation, 10−7 M Bisphenol A/S (BPA/BPS), 10−10 M Benz(a)pyrene (BaP). BMP2 levels are represented as ratios to untreated control ± SEM.
(B and C) Induction of BMP2 expression after 10−7 M BPA treatment of fibroblasts from adipose or breast tissue from healthy donors or breast cancer patients at least 1 year after treatment. Data represent the percentage of patients showing an induction of BMP2 expression quantified by (B) qPCR (healthy donor, n = 15; breast cancer history, n = 10) or (C) ELISA (healthy donor, n = 10; breast cancer history, n = 10).
(D) Proposed mechanism of BMP2 function. In the normal breast, BMP2 commits common progenitors to the luminal lineage, while BMP4 favors the maintenance of immature cells and myoepithelial differentiation. Exposure to environmental carcinogens increases BMP2 levels. Intrinsic alterations of luminal progenitors make the cells susceptible to BMP2 and IL-6-dependent changes of the microenvironment, leading to full transformation. Ad, adipocyte; Fb, fibroblast; SC, stem cell.
Discussion
While current data implicate BMPs in late stages of tumorigenesis and metastasis, we uncovered here that BMP2 plays a role in very early stages of the transformation of immature cells.
Abnormally elevated levels of BMP2 were specifically detected in luminal breast tumors but produced by tumor microenvironment and not by cancer cells themselves as reported in leukemia (Gerber et al., 2013; Laperrousaz et al., 2013). Chronic exposure to BMP2 in the presence of IL-6 promotes the engagement of immature epithelial cells toward transformation, as shown by anchorage-independent growth and in vivo experiments. Consistent with difficulties engrafting established human breast tumors in recipient mice (2.5% for luminal versus 30% for nonluminal tumors) (Cottu et al., 2012), we did not observe large and aggressive cell outgrowth. Nevertheless, we obtained a significant and reproducible engraftment of long-term BMP2-treated-MCF10A cells, and loss of BMPR1B expression resulted in a decrease in engrafted cells. BMP2-treated cells displayed a robust luminal tumor-like phenotype, as confirmed by multiparameter comparison using two independent sets of primary tumors and induce and amplify intrinsic alterations, such as BMPR1B overexpression. However, the observed in vivo lesions did not yet resemble human breast carcinoma, suggesting that our model mimics an early stage of tumor development. Very interestingly, in vivo cells organized close to neovessels that colonized the coinjected matrigel. This was not observed in the xenografts of cells expressing shBMPR1B, confirming that BMPR1B was required for transformation and identifying it as the predominant receptor involved in luminal tumors from the earliest stages to established tumors despite its contradictory role in breast cancer prognosis (Bokobza et al., 2009; Helms et al., 2005). This is also consistent with our demonstration that in chronic phase of chronic myeloid leukemia the BMP/BMPR1B pathway provides key proliferation and expansion signals to leukemic stem cells (Laperrousaz et al., 2013). Aberrant regulation of the BMP pathway could therefore be a general mechanism in early phases of the transformation of immature cells.
We showed that the BMPR1B ligands BMP2 and BMP4 are present in the human normal mammary gland, where they occupy different functions in the regulation of mammary stem/progenitor cell fate (Figure 7). BMP2, but not BMP4, is able to commit cell to luminal differentiation and expansion of the luminal progenitor compartment, like in the murine mammary gland (Forsman et al., 2013). Interestingly, luminal progenitors have been reported to be potentially more susceptible to oncogenic events (Lim et al., 2009; Molyneux et al., 2010) due to short telomere length (Kannan et al., 2013). This might confer a more genetically unstable feature to these cells, also specific targets of BMP2 biological cell fate control. Our data indicate that binding of BMP2 to BMPR1B rapidly induces a sustained signaling involving GATA3 (as in development; Forsman et al., 2013) and a change of the FOXA1/FOXC1 balance leading to luminal immature progenitors expansion that further transformed through a BMPR1B-dependent signaling. Therefore, it is possible that under BMP2 signal transformation arises either from a stem/basal cell that first engages toward a luminal progenitor and then proliferates and further progresses or directly emerges from an already genetically altered committed luminal progenitor. Based on our findings, we cannot rule out one of the two hypotheses. Irrespective of the impact of BMP2 on luminal lineage commitment, the IHC analysis of normal and tumor tissue indicated that tumor cells themselves are the target rather than the origin of BMP2 overproduction. The transformation process may therefore either lead to the loss of BMP2 expression in mammary epithelial cells or occur in an epithelial cell that does not produce BMP2.
We showed that environmental pollutants such as BPA (Rundle et al., 2000), and its substitutes, BPS or radiation (Sun et al., 2012), are able to shift the balance of secreted BMP molecules in favor of BMP2. This seems to happen more frequently in individuals susceptible of developing breast cancer. Radiation and/or BPA accumulation in the mammary stem cell niche might contribute to increase the local concentrations of BMP2 and IL-6, which in turn may facilitate epithelial cell transformation and progression. Indeed, IL-6 secretion by stromal cells can be induced by BPA (Ben-Jonathan et al., 2009) and BMP2 (Hyzy et al., 2013; Zara et al., 2011), suggesting a possible feedback loop that maintains transforming conditions. This is consistent with the high BMP2 staining detected in tumor endothelial cells also involved in increased angiogenesis (Finkenzeller et al., 2012; Raida et al., 2005), causing a continuous influx of BMP-laden platelets, thereby sustaining local high concentrations of BMPs (Labelle et al., 2011).
Epithelial stem cells in the mammary microenvironment may be exposed to abnormally high levels of BMP2 over a prolonged period. Simultaneously, epithelial cells, including stem cells, may accumulate genetic alterations that increase their susceptibility to transforming agents, such as a change in BMPR1B expression. These events affect both the microenvironment of the niche and the epithelial stem cells and create the context for malignant transformation and progression (Figure 7D). In conclusion, we provide an insight into the mechanism of epithelial cell transformation at early steps of breast cancer development driven by an alteration of the stem cell niche in response to environmental factors. We have highlighted the importance of the BMP2 signaling pathway in luminal differentiation, which may explain the higher incidence of luminal versus basal tumors.
Experimental Procedures
Preparation of Single-Cell Suspensions from Human Primary Tissue
The culture of human tissue samples was approved by the ethics board of the Leon Berard Cancer Center, and patients gave informed consent. Human mammary epithelial and stromal cells were prepared from reduction mammoplasty or abdominal lipoplasty tissue, as described in the Supplemental Information.
Primary Mammary Cell Culture and Functional Assays
For mammosphere assays, single primary mammary epithelial cells were seeded at limiting dilutions (100 cells/ml) on 96-well ultra-low-attachment plates (BD Corning) in serum-free basal mammary epithelial growth medium (Promocell) supplemented with B27, 4 μg/ml heparin, 20 ng/ml basic fibroblast growth factor (both Life Technologies) and epithelial growth factor (EGF) (Sigma). For E-CFC, primary cells were seeded in complete Epicult-B medium (STEMCELL Technologies) (Stingl et al., 2005). Colonies were fixed, stained, and counted according to size and morphological criteria. Early, highly proliferative E-CFCs were considered to give rise to large colonies and late, slowly proliferating E-CFC produced small colonies, measured by Ki67 staining (Figure S5C). Lineage properties of colonies are defined using classical criteria and based on keratin 14 and keratin 18 staining (Bachelard-Cascales et al., 2010). Quantification of E-CFC following primary mammosphere formation and dissociation reveals the initial progenitor content that is rapidly exhausted by in vitro culture. In contrast, performing the E-CFC assay using cells obtained from sequential spheres (secondary, tertiary, or more in some cases) allows quantification of epithelial colonies derived from early common progenitors that have differentiated during prolonged culture to generate new progenitors and tested in the ECP-DC assay (Figure S5A) (Bachelard-Cascales et al., 2012).
Culture of Cell Lines and Functional Assays
MCF10A cells were purchased from the ATCC and cultured according to recommendations in phenol red-free Dulbecco’s modified Eagle’s medium (DMEM)/F-12 nutrient mix supplemented with 5% horse serum (Life), 10 μg/ml insulin, 0.5 μg/ml hydrocortisone, 100 ng/ml cholera toxin, 20 ng/ml EGF (all Sigma), 1% penicillin/streptomycin (Life Technologies). BMP2 or IL6 were used at a concentration of 10 ng/ml for chronic exposure or 50 ng/ml for 48 hr of treatment in 2% serum. 3D TDLU assays were carried out in complete medium as described previously (Bachelard-Cascales et al., 2010).
Quantification of Soluble BMPs
To determine the concentration of secreted BMPs in the microenvironment of primary tissue samples, standardized normal and tumor tissue supernatants were prepared (Faget et al., 2011). Undigested tissue was mechanically dissociated in DMEM/F-12 nutrient mix, 2% bovine serum albumin (BSA) at a concentration of 1 ml/0.5 g tissue using scalpels. Supernatants were filtered using a 40 μM cell strainer and used to quantify soluble BMP2 and BMP4. Supernatants from cultured cells were concentrated using an Eppendorf Concentrator. ELISA quantifications of BMP2 and BMP4 were performed following the manufacturer’s instructions (Quantikine ELISA Kit; R&D Systems).
Microarray Expression Analysis
Normal and tumor tissue samples were prepared using the same protocol. Briefly, tissue samples were embedded in Optimal Cutting Temperature. Frozen sections were made. Total RNA were used for microarray analysis (accession number GSE6861; Gene Expression Omnibus entry) (Farmer et al., 2005). Tumors were classified into FOXA1-low (basal-like), FOXA1-high/ESR1-high (luminal), and FOXA1-high/ESR1-low (molecular apocrine), as described. The cutoffs to define high and low were defined as the nadirs of the bimodal distributions for the respective genes. Since the BMPR1B distribution is not bimodal, the cutoff was defined as the mean plus 5 SDs of the values for samples in the negative peak. The R script to generate the figures is available from the authors. The CEL files were processed in R with robust multiarray average. Probesets with a length under 56 nt were removed, and redundant probesets were removed based on the Entrez gene ID and the SD across the entire data set.
IHC Staining of Paraffin-Embedded Tissues and Tissue Microarray
Immunohistochemistry analysis was performed on a tissue microarray prepared from 440 breast tumors (Centre Leon Berard, BB-033-00050) as well as several additional normal breast and tumor tissue sections. H&E and IHC staining of paraffin sections of normal human breast tissue and primary breast tumors was carried out using standard methods and the following antibodies: BMPR1B (ab78417) and BMP2 (ab6285; both Abcam), and Pan-keratin (clone AE1/AE3, 1/50, CC1 buffer), CD31 (clone JC70A, 1/50, ICC1) and Pan-CD45 (clone 2B11+PD7/26, 1/20, ICC1) (all Dako) and SMA (Roche Diagnostic, clone 1A4, 1/1) and CD10 (Novacastra, Clone 56C6), Staining of 380 tumors of the TMA was interpretable, and the statistical significance of staining was tested by Monte Carlo simulation.
Author Contributions
M.C., E.B.-C., X.S., and F.C. conceived the study, designed and performed experiments, analyzed data, and wrote the manuscript. A.J., G.P., R.B., and T.V. performed and analyzed experiments. E.D., C.M.-C., I.T., and R.I. provided key biological material/reagents and microarray data. I.T. provided key tumor biological material and performed all IHC data analysis. C.C.F., C.C., and J.Y.B. provided administrative and scientific support and final approval of manuscript. V.M.-S. conceived the study, designed experiments, analyzed data, provided financial and administrative support, and wrote the manuscript.
Acknowledgments
We thank I. Durand (CRCL-cell sorting), I. Goddard (LMT animal facilities), C. Vanbelle (SFR), S. Goddard-Leon, and C. Fournel (CRCL-U1052-UMR5286) for excellent assistance and Servier for providing images. This study was funded by INSERM, Canceropôle Rhone-Auvergne (CLARA), La Ligue Nationale Contre le Cancer (Ain, Rhône), ARC (SFI20111203500), and partly by ANR (ANR-10-LABX-0061 and 2011 ANR-CESA-018-04) and Region Rhône-Alpes (CMIRA-COOPERA-12-004945-01) grants to V.M.-S.; INCA grant to R.I., V.M.-S., and C.C.-F. PhD fellowships for M.C. were from the French government and ARC and for F.C. from CLARA and Region Rhône-Alpes. X.S. and E.B.-C. had INCA-CLARA postdoctoral fellowships.
Footnotes
This is an open access article under the CC BY-NC-ND license (http://creativecommons.org/licenses/by-nc-nd/3.0/).
Supplemental Information
References
- Alarmo E.L., Huhtala H., Korhonen T., Pylkkanen L., Holli K., Kuukasjarvi T., Parkkila S., Kallioniemi A. Bone morphogenetic protein 4 expression in multiple normal and tumor tissues reveals its importance beyond development. Mod. Pathol. 2013;26:10–21. doi: 10.1038/modpathol.2012.128. [DOI] [PubMed] [Google Scholar]
- Bachelard-Cascales E., Chapellier M., Delay E., Pochon G., Voeltzel T., Puisieux A., Caron de Fromentel C., Maguer-Satta V. The CD10 enzyme is a key player to identify and regulate human mammary stem cells. Stem Cells. 2010;28:1081–1088. doi: 10.1002/stem.435. [DOI] [PubMed] [Google Scholar]
- Bachelard-Cascales E., Chapellier M., Delay E., Maguer-Satta V. A protocol to quantify mammary early common progenitors from long-term mammosphere culture. Curr. Protoc. Stem Cell Biol. 2012;Chapter 1 doi: 10.1002/9780470151808.sc01e07s20. Unit 1E.7, 1E.7.1–1E.7.6. [DOI] [PubMed] [Google Scholar]
- Balboni A.L., Hutchinson J.A., DeCastro A.J., Cherukuri P., Liby K., Sporn M.B., Schwartz G.N., Wells W.A., Sempere L.F., Yu P.B., DiRenzo J. ΔNp63α-mediated activation of bone morphogenetic protein signaling governs stem cell activity and plasticity in normal and malignant mammary epithelial cells. Cancer Res. 2013;73:1020–1030. doi: 10.1158/0008-5472.CAN-12-2862. [DOI] [PMC free article] [PubMed] [Google Scholar]
- Ben-Jonathan N., Hugo E.R., Brandebourg T.D. Effects of bisphenol A on adipokine release from human adipose tissue: Implications for the metabolic syndrome. Mol. Cell. Endocrinol. 2009;304:49–54. doi: 10.1016/j.mce.2009.02.022. [DOI] [PMC free article] [PubMed] [Google Scholar]
- Bokobza S.M., Ye L., Kynaston H.E., Mansel R.E., Jiang W.G. Reduced expression of BMPR-IB correlates with poor prognosis and increased proliferation of breast cancer cells. Cancer Genomics Proteomics. 2009;6:101–108. [PubMed] [Google Scholar]
- Clement J.H., Raida M., Sänger J., Bicknell R., Liu J., Naumann A., Geyer A., Waldau A., Hortschansky P., Schmidt A. Bone morphogenetic protein 2 (BMP-2) induces in vitro invasion and in vivo hormone independent growth of breast carcinoma cells. Int. J. Oncol. 2005;27:401–407. [PubMed] [Google Scholar]
- Cottu P., Marangoni E., Assayag F., de Cremoux P., Vincent-Salomon A., Guyader Ch., de Plater L., Elbaz C., Karboul N., Fontaine J.J. Modeling of response to endocrine therapy in a panel of human luminal breast cancer xenografts. Breast Cancer Res. Treat. 2012;133:595–606. doi: 10.1007/s10549-011-1815-5. [DOI] [PubMed] [Google Scholar]
- Davies S.R., Watkins G., Douglas-Jones A., Mansel R.E., Jiang W.G. Bone morphogenetic proteins 1 to 7 in human breast cancer, expression pattern and clinical/prognostic relevance. J. Exp. Ther. Oncol. 2008;7:327–338. [PubMed] [Google Scholar]
- Debnath J., Muthuswamy S.K., Brugge J.S. Morphogenesis and oncogenesis of MCF-10A mammary epithelial acini grown in three-dimensional basement membrane cultures. Methods. 2003;30:256–268. doi: 10.1016/s1046-2023(03)00032-x. [DOI] [PubMed] [Google Scholar]
- Faget J., Biota C., Bachelot T., Gobert M., Treilleux I., Goutagny N., Durand I., Léon-Goddard S., Blay J.Y., Caux C., Ménétrier-Caux C. Early detection of tumor cells by innate immune cells leads to T(reg) recruitment through CCL22 production by tumor cells. Cancer Res. 2011;71:6143–6152. doi: 10.1158/0008-5472.CAN-11-0573. [DOI] [PubMed] [Google Scholar]
- Farmer P., Bonnefoi H., Becette V., Tubiana-Hulin M., Fumoleau P., Larsimont D., Macgrogan G., Bergh J., Cameron D., Goldstein D. Identification of molecular apocrine breast tumours by microarray analysis. Oncogene. 2005;24:4660–4671. doi: 10.1038/sj.onc.1208561. [DOI] [PubMed] [Google Scholar]
- Finkenzeller G., Hager S., Stark G.B. Effects of bone morphogenetic protein 2 on human umbilical vein endothelial cells. Microvasc. Res. 2012;84:81–85. doi: 10.1016/j.mvr.2012.03.010. [DOI] [PubMed] [Google Scholar]
- Forsman C.L., Ng B.C., Heinze R.K., Kuo C., Sergi C., Gopalakrishnan R., Yee D., Graf D., Schwertfeger K.L., Petryk A. BMP-binding protein twisted gastrulation is required in mammary gland epithelium for normal ductal elongation and myoepithelial compartmentalization. Dev. Biol. 2013;373:95–106. doi: 10.1016/j.ydbio.2012.10.007. [DOI] [PMC free article] [PubMed] [Google Scholar]
- Gerber J.M., Gucwa J.L., Esopi D., Gurel M., Haffner M.C., Vala M., Nelson W.G., Jones R.J., Yegnasubramanian S. Genome-wide comparison of the transcriptomes of highly enriched normal and chronic myeloid leukemia stem and progenitor cell populations. Oncotarget. 2013;4:715–728. doi: 10.18632/oncotarget.990. [DOI] [PMC free article] [PubMed] [Google Scholar]
- Helms M.W., Packeisen J., August C., Schittek B., Boecker W., Brandt B.H., Buerger H. First evidence supporting a potential role for the BMP/SMAD pathway in the progression of oestrogen receptor-positive breast cancer. J. Pathol. 2005;206:366–376. doi: 10.1002/path.1785. [DOI] [PubMed] [Google Scholar]
- Hyzy S.L., Olivares-Navarrete R., Hutton D.L., Tan C., Boyan B.D., Schwartz Z. Microstructured titanium regulates interleukin production by osteoblasts, an effect modulated by exogenous BMP-2. Acta Biomater. 2013;9:5821–5829. doi: 10.1016/j.actbio.2012.10.030. [DOI] [PMC free article] [PubMed] [Google Scholar]
- Iliopoulos D., Hirsch H.A., Wang G., Struhl K. Inducible formation of breast cancer stem cells and their dynamic equilibrium with non-stem cancer cells via IL6 secretion. Proc. Natl. Acad. Sci. USA. 2011;108:1397–1402. doi: 10.1073/pnas.1018898108. [DOI] [PMC free article] [PubMed] [Google Scholar]
- Jeanpierre S., Nicolini F.E., Kaniewski B., Dumontet C., Rimokh R., Puisieux A., Maguer-Satta V. BMP4 regulation of human megakaryocytic differentiation is involved in thrombopoietin signaling. Blood. 2008;112:3154–3163. doi: 10.1182/blood-2008-03-145326. [DOI] [PubMed] [Google Scholar]
- Kadota M., Yang H.H., Gomez B., Sato M., Clifford R.J., Meerzaman D., Dunn B.K., Wakefield L.M., Lee M.P. Delineating genetic alterations for tumor progression in the MCF10A series of breast cancer cell lines. PLoS ONE. 2010;5:e9201. doi: 10.1371/journal.pone.0009201. [DOI] [PMC free article] [PubMed] [Google Scholar]
- Kannan N., Huda N., Tu L., Droumeva R., Aubert G., Chavez E., Brinkman R.R., Lansdorp P., Emerman J., Abe S. The luminal progenitor compartment of the normal human mammary gland constitutes a unique site of telomere dysfunction. Stem Cell Rep. 2013;1:28–37. doi: 10.1016/j.stemcr.2013.04.003. [DOI] [PMC free article] [PubMed] [Google Scholar]
- Katsuno Y., Hanyu A., Kanda H., Ishikawa Y., Akiyama F., Iwase T., Ogata E., Ehata S., Miyazono K., Imamura T. Bone morphogenetic protein signaling enhances invasion and bone metastasis of breast cancer cells through Smad pathway. Oncogene. 2008;27:6322–6333. doi: 10.1038/onc.2008.232. [DOI] [PubMed] [Google Scholar]
- Keller P.J., Arendt L.M., Skibinski A., Logvinenko T., Klebba I., Dong S., Smith A.E., Prat A., Perou C.M., Gilmore H. Defining the cellular precursors to human breast cancer. Proc. Natl. Acad. Sci. USA. 2012;109:2772–2777. doi: 10.1073/pnas.1017626108. [DOI] [PMC free article] [PubMed] [Google Scholar]
- Kouros-Mehr H., Slorach E.M., Sternlicht M.D., Werb Z. GATA-3 maintains the differentiation of the luminal cell fate in the mammary gland. Cell. 2006;127:1041–1055. doi: 10.1016/j.cell.2006.09.048. [DOI] [PMC free article] [PubMed] [Google Scholar]
- Labelle M., Begum S., Hynes R.O. Direct signaling between platelets and cancer cells induces an epithelial-mesenchymal-like transition and promotes metastasis. Cancer Cell. 2011;20:576–590. doi: 10.1016/j.ccr.2011.09.009. [DOI] [PMC free article] [PubMed] [Google Scholar]
- Laperrousaz B., Jeanpierre S., Sagorny K., Voeltzel T., Ramas S., Kaniewski B., Ffrench M., Salesse S., Nicolini F.E., Maguer-Satta V. Primitive CML cell expansion relies on abnormal levels of BMPs provided by the niche and on BMPRIb overexpression. Blood. 2013;122:3767–3777. doi: 10.1182/blood-2013-05-501460. [DOI] [PubMed] [Google Scholar]
- Li H.J., Reinhardt F., Herschman H.R., Weinberg R.A. Cancer-stimulated mesenchymal stem cells create a carcinoma stem cell niche via prostaglandin E2 signaling. Cancer Discov. 2012;2:840–855. doi: 10.1158/2159-8290.CD-12-0101. [DOI] [PMC free article] [PubMed] [Google Scholar]
- Lim E., Vaillant F., Wu D., Forrest N.C., Pal B., Hart A.H., Asselin-Labat M.L., Gyorki D.E., Ward T., Partanen A., kConFab Aberrant luminal progenitors as the candidate target population for basal tumor development in BRCA1 mutation carriers. Nat. Med. 2009;15:907–913. doi: 10.1038/nm.2000. [DOI] [PubMed] [Google Scholar]
- Maguer-Satta V. The stem cell niche: the black master of cancer. In: Stanley S., editor. Cancer Stem Cells. Intech; 2011. pp. 215–240. [Google Scholar]
- McLean K., Gong Y., Choi Y., Deng N., Yang K., Bai S., Cabrera L., Keller E., McCauley L., Cho K.R., Buckanovich R.J. Human ovarian carcinoma–associated mesenchymal stem cells regulate cancer stem cells and tumorigenesis via altered BMP production. J. Clin. Invest. 2011;121:3206–3219. doi: 10.1172/JCI45273. [DOI] [PMC free article] [PubMed] [Google Scholar]
- Molyneux G., Geyer F.C., Magnay F.A., McCarthy A., Kendrick H., Natrajan R., Mackay A., Grigoriadis A., Tutt A., Ashworth A. BRCA1 basal-like breast cancers originate from luminal epithelial progenitors and not from basal stem cells. Cell Stem Cell. 2010;7:403–417. doi: 10.1016/j.stem.2010.07.010. [DOI] [PubMed] [Google Scholar]
- Neve R.M., Chin K., Fridlyand J., Yeh J., Baehner F.L., Fevr T., Clark L., Bayani N., Coppe J.P., Tong F. A collection of breast cancer cell lines for the study of functionally distinct cancer subtypes. Cancer Cell. 2006;10:515–527. doi: 10.1016/j.ccr.2006.10.008. [DOI] [PMC free article] [PubMed] [Google Scholar]
- Pires M.M., Hopkins B.D., Saal L.H., Parsons R.E. Alterations of EGFR, p53 and PTEN that mimic changes found in basal-like breast cancer promote transformation of human mammary epithelial cells. Cancer Biol. Ther. 2013;14:246–253. doi: 10.4161/cbt.23297. [DOI] [PMC free article] [PubMed] [Google Scholar]
- Raida M., Clement J.H., Leek R.D., Ameri K., Bicknell R., Niederwieser D., Harris A.L. Bone morphogenetic protein 2 (BMP-2) and induction of tumor angiogenesis. J. Cancer Res. Clin. Oncol. 2005;131:741–750. doi: 10.1007/s00432-005-0024-1. [DOI] [PMC free article] [PubMed] [Google Scholar]
- Rendl M., Polak L., Fuchs E. BMP signaling in dermal papilla cells is required for their hair follicle-inductive properties. Genes Dev. 2008;22:543–557. doi: 10.1101/gad.1614408. [DOI] [PMC free article] [PubMed] [Google Scholar]
- Rundle A., Tang D., Hibshoosh H., Estabrook A., Schnabel F., Cao W., Grumet S., Perera F.P. The relationship between genetic damage from polycyclic aromatic hydrocarbons in breast tissue and breast cancer. Carcinogenesis. 2000;21:1281–1289. [PubMed] [Google Scholar]
- Sagorny K., Chapellier M., Laperrousaz B., Maguer-Satta V. [BMP and cancer: the Yin and Yang of stem cells] Med. Sci. (Paris) 2012;28:416–422. doi: 10.1051/medsci/2012284020. [DOI] [PubMed] [Google Scholar]
- Stingl J., Raouf A., Emerman J.T., Eaves C.J. Epithelial progenitors in the normal human mammary gland. J. Mammary Gland Biol. Neoplasia. 2005;10:49–59. doi: 10.1007/s10911-005-2540-7. [DOI] [PubMed] [Google Scholar]
- Sun Y., Campisi J., Higano C., Beer T.M., Porter P., Coleman I., True L., Nelson P.S. Treatment-induced damage to the tumor microenvironment promotes prostate cancer therapy resistance through WNT16B. Nat. Med. 2012;18:1359–1368. doi: 10.1038/nm.2890. [DOI] [PMC free article] [PubMed] [Google Scholar]
- Thawani J.P., Wang A.C., Than K.D., Lin C.Y., La Marca F., Park P. Bone morphogenetic proteins and cancer: review of the literature. Neurosurgery. 2010;66:233–246. doi: 10.1227/01.NEU.0000363722.42097.C2. discussion 246. [DOI] [PubMed] [Google Scholar]
- Van Huffel S.C., Tham J.M., Zhang X., Lim K., Yang C., Tan Y., Ong F., Lee I., Hong W. Systematic analysis of secreted proteins reveals synergism between IL6 and other proteins in soft agar growth of MCF10A cells. Cell Biosci. 2011;1:13. doi: 10.1186/2045-3701-1-13. [DOI] [PMC free article] [PubMed] [Google Scholar]
- Vendramini-Costa D.B., Carvalho J.E. Molecular link mechanisms between inflammation and cancer. Curr. Pharm. Des. 2012;18:3831–3852. doi: 10.2174/138161212802083707. [DOI] [PubMed] [Google Scholar]
- Weber Lozada K., Keri R.A. Bisphenol A increases mammary cancer risk in two distinct mouse models of breast cancer. Biol. Reprod. 2011;85:490–497. doi: 10.1095/biolreprod.110.090431. [DOI] [PMC free article] [PubMed] [Google Scholar]
- Zara J.N., Siu R.K., Zhang X., Shen J., Ngo R., Lee M., Li W., Chiang M., Chung J., Kwak J. High doses of bone morphogenetic protein 2 induce structurally abnormal bone and inflammation in vivo. Tissue Eng. Part A. 2011;17:1389–1399. doi: 10.1089/ten.tea.2010.0555. [DOI] [PMC free article] [PubMed] [Google Scholar]
- Zhang J., Niu C., Ye L., Huang H., He X., Tong W.G., Ross J., Haug J., Johnson T., Feng J.Q. Identification of the haematopoietic stem cell niche and control of the niche size. Nature. 2003;425:836–841. doi: 10.1038/nature02041. [DOI] [PubMed] [Google Scholar]
Associated Data
This section collects any data citations, data availability statements, or supplementary materials included in this article.