Abstract
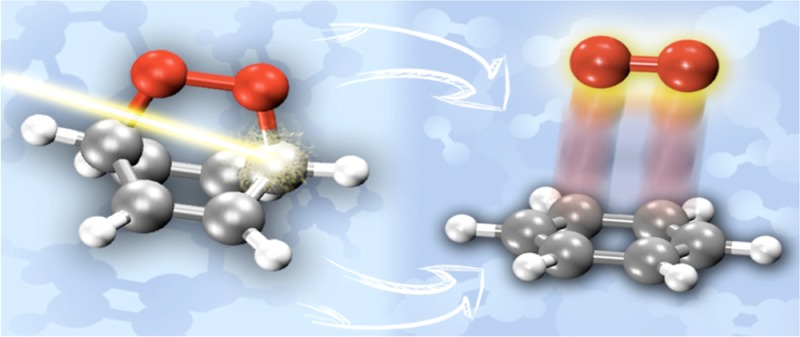
A synergistic approach combining high-level multiconfigurational static calculations and full-dimensional ab initio surface hopping dynamics has been employed to gain insight into the photochemistry of endoperoxides. Electronic excitation of endoperoxides triggers two competing pathways, cycloreversion and O–O homolysis, that result in the generation of singlet oxygen and oxygen diradical rearrangement products. Our results reveal that cycloreversion or the rupture of the two C–O bonds occurs via an asynchronous mechanism that can lead to the population of a ground-state intermediate showing a single C–O bond. Furthermore, singlet oxygen is directly generated in its most stable excited electronic state 1Δg. The triplet states do not intervene in this mechanism, as opposed to the O–O homolysis where the exchange of population between the singlet and triplet manifolds is remarkable. In line with recent experiments performed on the larger anthracene-9,10-endoperoxide, upon excitation to the spectroscopic ππ* electronic states, the primary photoreactive pathway that governs deactivation of endoperoxides is O–O homolysis with a quantum yield of 65%.
Introduction
The lowest excited state of singlet oxygen, 1O2 (1Δg), has become in the last few years a precious chemical. Its versatility and physical and chemical characteristics have opened the door to a wide range of application fields.1 For instance, properties such as its stereoselectivity are exploited for the synthesis of oxygen-containing fine organic chemicals,2 whereas its extreme reactivity and oxidation power3 are key to its use in the decontamination of waters1,4 or in medical and environmental photodynamic processes including the sterilization of blood or plasma samples5 and cancer therapy.6 Moreover, the particularly long radiative lifetime of this excited state and its excess of energy relative to the ground state (GS), resonant to iodine atoms, allows its use in laser technology for the production of excited iodine atoms via energy transfer.7
This great heterogeneity of scenarios has motivated the quest for the search of new methods for its synthesis, specifically adapted to the conditions and requirements of the different contexts where this species needs to be produced.
Attending to the nature of the force that drives the 1O2 generation mechanism, these protocols can be classified into physical or chemical. Physical processes produce 1O2 from the direct excitation of molecular oxygen with photons of different wavelengths (i.e., radiofrequency or IR).7,8 Chemical methods that can be mediated or not by light, however, involve the participation of other reagents that chemically evolve to 1O2 or that alternatively act as intermediates for the storage of energy that is then transferred to molecular oxygen in its GS, leading to the desired excited product.
Decomposition of polyoxygenated species such as ozonides, endoperoxides, peroxyacetyl nitrate, or superoxide ions stand out as important chemical sources of 1O2 in the absence of light.9 The following reactions of hydrogen peroxide:10
| i |
(ref (11))
| ii |
(ref (12))
| iii |
(ref (13))
| iv |
(Haber-Weiss reaction)14or the self-reaction of alkylhydroperoxides
| v |
(Russell reaction)15 have been also reported as efficient chemical methods for producing 1O2 in the dark.
Interestingly, some of these reactions have been as well proposed to be responsible for the generation of 1O2 in biological systems. In fact, reactions (i) and (iv) have been postulated as part of the defense strategy occurring during phagocytosis,16 and lipid hydroperoxides generated along oxidative stress processes connected to diseases such as atherosclerosis17 were found to decompose with the participation of a metal cation catalyst or enzymes following reaction (v), leading to 1O2.10,15
Much more efficient than their GS counterparts are 1O2 photosensitizing reactions. Conventional 1O2 reactions initiated by light require the excitation of a sensitizer, showing preferably an important yield for intersystem crossing (ISC) and characterized by long-lived triplets. Once the triplet state of the photosensitizer has been populated, an energy-transfer process occurs during the collision of this species with surrounding GS molecular oxygen molecules that leads to the generation of 1O2 and the recovery of the sensitizer in its initial GS (Type II mechanism of photosensitization). Obviously, keeping the concentration of environmental oxygen molecules constant and high is a key factor for the success of these techniques but can, however, pose problems for particular applications where the oxidant needs to be generated in oxygen depleted conditions.18 This is for instance the case of solid or vascular damaged tumors where oxygen is not able to reach their interior. In these cases, the efficacy of conventional photosensitizing reactions is expected to be low and thus alternative photosensitive oxygen carriers, able to release singlet oxygen upon their activation with the correct wavelength, have been specifically designed for this purpose. An example of a prototype of oxygen carrier photosensitizer is the tetraantraporphyrazine proposed by Freyer and Leupold,19 which combines the virtues of tetrapyrrole standard photosensitizers (i.e., absorption maxima in the red/NIR region of the electromagnetic spectrum, etc.) with the possibility to eject 1O2 regardless the concentration of molecular oxygen in the tissues, thanks to the four anthraceneendoperoxide (APO) moieties with which the porphyrazine core is substituted. It is precisely APO that has been considered as a model to delve in the understanding of how 1O2 alone, without considering other reactive oxygen species, participates in cell damaging in photodynamic processes.20
The photochemistry of endoperoxides has also been investigated in detail from both theoretical21 and experimental22 standpoints. It has been demonstrated that 1O2 is not the only photoproduct that results from the interaction of endoperoxides with UV photons (see Scheme 1). In addition to cycloreversion or the breaking of the pair of C–O bonds that leads to the aromatic hydrocarbon + 1O2, competing O–O homolysis (recall Scheme 1) is responsible of diverse photoproducts, such as quinones, acetals, or diepoxides.22b,22c
Scheme 1. CHDEPO and Its Main Photoproducts: Benzoquinone (BQ) + H2 and Singlet Oxygen (1O2) + the Aromatic Hydrocarbon (B).
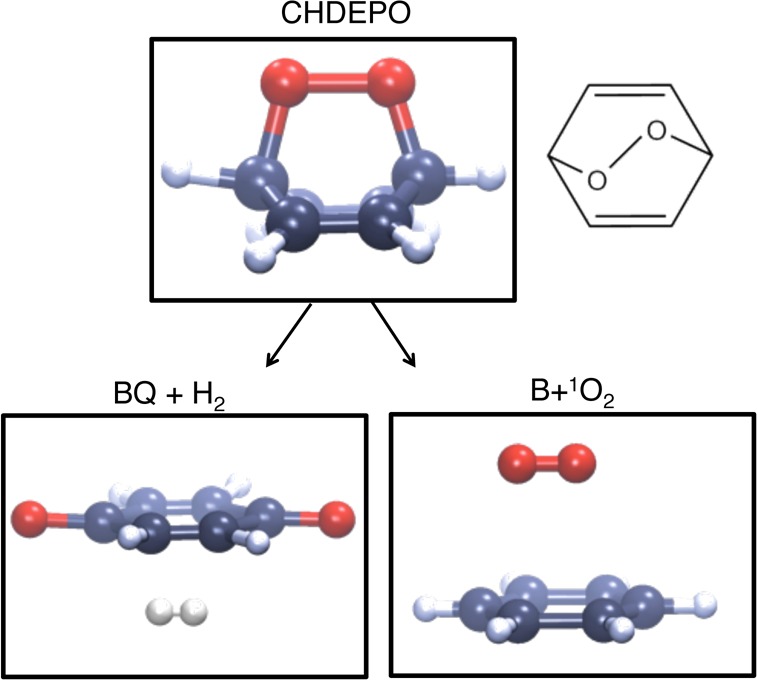
Although the aromatic moiety influences greatly the absorption spectrum of endoperoxides, a common feature to this class of compounds is the nature of the electronic states leading to the two main photochemical decomposition pathways. While ππ* states are responsible for cycloreversion, πσ* states can lead to O–O homolysis.21c,21e−21g,22b,22h
This work presents the first full-dimensional dynamical study of a model endoperoxide, the cyclohexadieneendoperoxide (CHDEPO, C6H6O2) system, which shows an eight-fold degeneracy region (8CI) in the potential energy surface (PES), where four singlets and four triplets are degenerate. This time-resolved picture, complemented with key frames extracted from quantum chemistry calculations, sheds light on the two competing mechanisms that account for O–O homolysis and the cleavage of C–O bonds, leading to 1O2. Particular key questions that will be addressed are (i) the mechanism by which 1O2 is produced from endoperoxides, (ii) the degree of competition between 1O2 generation and O–O homolysis, and (iii) the role played by the triplets in the photochemistry of these systems.
Results and Discussion
Computational Details
Stationary points and conical intersections (CI) were optimized at the CASSCF23 level of theory, employing an ANO-S24 basis set, contracted for H as [2s1p] and for C,O as [3s2p1d]. Unless otherwise specified, the active space used throughout the calculations includes the complete π valence space (two pairs of πCC/π*CC and πOO/π*OO) and the σ orbitals sitting on the oxygens σCO/σ*CO (two pairs) and σOO/σ*OO, necessary to properly account for O–O homolysis and cycloreversion; this comprises altogether a total of 14 electrons distributed into 12 orbitals, (see Figure S1). Stationary points in the first singlet potential were optimized using a single root, whereas in the case of CIS2/S1 and CIS1/S0 (see below) state average CASSCF calculations over three and two roots were used, respectively. The connection between critical points and with the Franck–Condon region was ensured by computing minimum energy paths (MEPs) at the same level of theory as specified above with a 6-31G* basis set25 and using the minimum number of roots necessary, i.e., equal to the root numbering of the gradient followed. Final energies were calculated as state average over four singlet and four triplet states at MS-CASPT223//CASSCF(14,12)/ANO-RCC26 on the optimized geometries. The contraction scheme for the ANO-RCC is H [3s2p] and for C, O as [4s3p2d]. Unless otherwise specified, all the calculations were performed with the 76 version of the MOLCAS program.27 For completeness and consistency, since the basis set and active spaces used herein differ from previous studies, we have recomputed particular regions of the O–O homolysis MEP already discussed in other works, following the CASSCF(14,12)/ANO-RCC protocol and calculated from the scratch others, necessary to interpret the dynamical results.
Semiclassical dynamics including nonadiabatic and spin–orbit couplings (SOC) were simulated using Tully’s fewest switches surface hopping scheme (see Supporting Information for further details), as described in the SHARC method.28 Other applications of SHARC can be found elsewhere.29 Within this methodological framework, nuclei are treated classically and follow Newton’s equations, whereas electrons are treated quantum mechanically. For the integration of Newton’s equations the velocity Verlet30 algorithm was employed with a time step of 0.5 fs. The evolution of the probability amplitudes determining the contribution of the different adiabatic states to the total wave function was integrated using the fourth order Runge–Kutta algorithm with a time step of 10–2 fs. A decoherence correction was applied, as recommended by Granucci and Persico31 with the parameters C = 1 and α = 0.1 hartree. These parameters (C and α) rescale the amplitudes of the electronic wavepacket after each nuclear time step, accounting for the evolution of hypothetical trajectories running in other electronic states along other gradients different to that of the current electronic state. Previous studies on three-dimensional atom-molecule systems have highlighted the importance of accounting for decoherence effects but have also demonstrated that the precise value of these parameters has a small influence in the dynamics when comparing with quantum approaches.32 However, other larger systems as polyconjugated organic molecules have been demonstrated to be much more sensitive to their variation.33
For the simulation of the UV spectrum, a set of 1000 initial uncorrelated geometries and velocities was generated according to a Wigner harmonic distribution of the lowest vibrational state of the ground electronic state, taking as input an harmonic frequency calculation at the CASSCF(14,12)/6-31G* level of theory. CASSCF/ANO-RCC26 and CASPT2 spectra, considering the first four singlet states, were constructed from a superposition of Gaussians with the maximum height modified according to the oscillator strength of the transitions and sitting at the position of the vertical excitation energies computed at these two levels of theory (width of the Gaussian = 0.1 eV). For comparison, the CASSCF and MS-CASPT2 vertical absorption spectra of CHDEPO were calculated following the same protocol specified above, using the CASSCF/6-31G* optimized geometry as a reference. From the initial ensemble of 1000 geometries, a subset of 78 initial conditions, concentrated in an energy window of 0.15 eV centered around the absorption maximum at 4.65 eV, were selected, based on their oscillator strengths. For these trajectories, energies and gradients for the first four singlets and triplets were computed on-the-fly using the CASSCF(14,12)/ANO-RCC protocol as implemented in MOLCAS package.27 After the hop events the kinetic energy was adjusted with the goal to conserve the total energy of the system, scaling the atom velocities along their current direction. Finally, and unless otherwise specified to avoid the artificial elongation of the C–H bonds due to the failure of the harmonic approximation, dynamics simulations were performed substituting hydrogen atoms for deuterium, as suggested elsewhere.34
Absorption Spectrum
The vertical CASSCF and CASPT2 absorption spectra of CHDEPO are shown in Table 1. The CASSCF method predicts the brightest transitions (ππ*) above 8 eV, not shown in Table 1. The low-energy region of the CASSCF spectrum is in turn dominated by two weaker absorptions at 5.0 and 6.0 eV, showing a mixed πOOπ*CC/π*OOσ*OO character. Inclusion of dynamic correlation shifts the spectrum to the red. In contrast to the CASSCF spectrum, the most intense bands (ππ*) are concentrated in the region around 5.5 eV, whereas two transitions governing the lowest energy region of the spectrum are calculated below 5 eV at 3.9 and 4.7 eV, the second four times more intense than the first one. Similarly to CASSCF, CASPT2 predicts a strong π*OOπ*CC/π*OOσ*OO mixing for the S1 and S2 electronic states.
Table 1. CASSCF and CASPT2 Transition Energies, ΔE, in eV and Oscillator Strenghs, f, Calculated for the Low-Energy Region of the Spectrum of CHDEPO.
| CASSCF/ANO-RCC |
MS-CASPT2/ANO-RCC |
|||
|---|---|---|---|---|
| main configuration | ΔE (eV) | ΔE (eV) | f | |
| S1 | π*OOπ*CC(b2)/ π*OOσ*OO | 5.02 | 3.90 | 0.002 |
| S2 | π*OOσ*OO/ π*OOπ*CC(b2) | 6.03 | 4.72 | 0.008 |
| S3 | πCC(b1)π*CC(b2) | 7.11 | 5.07 | 0.000 |
Subtle differences with previous works21d are attributed to small changes in the reference geometry and the basis set.
Figure 1 displays the position of the CASSCF and CASPT2 vertical excitations (black and red vertical lines below 8 and 6 eV, respectively), superimposed to the CASSCF and CASPT2 spectra based on the 1000 geometries generated to mimic the nuclear wavepacket (solid black and red spectra). Both spectra consist of an intense band, showing a shoulder at higher energies, preceded by a weaker absorption. Consistently with what is observed for the vertical spectrum, we find that CASSCF overestimates by a factor of 0.25 the absorption energies, taking CASPT2 as a reference; compare the position of the least (4.8 vs 3.8 eV) and most energetic bands (6.2 vs 4.7 eV) at CASSCF and CASPT2. A decomposition analysis of these bands in terms of the contributing states (see Figures S6 and S7) reveals that the weakest band mainly results from the first excited state in both spectra, whereas the S2 and S3 states are the responsible for the principal band, increasing the S3 its contribution to the main band after including dynamic correlation. These results are consistent with the vertical picture obtained in Table 1. The pathological overestimation of excitation energies by CASSCF at the FC region, as compared with CASPT2 calculations, could be detrimental for the dynamics, leading to undesired photoproducts due to the excess of energy accumulated by the starting ensemble of initial geometries. However, taking into account that CASPT2 analytical gradients are not available in MOLCAS and that the use of CASPT2 numerical gradients is computationally unaffordable for a study as the one suggested here, we opted for a common solution previously adopted by other authors that consists in the scaling of the energies and gradients35 (See Supporting Information for more details).
Figure 1.
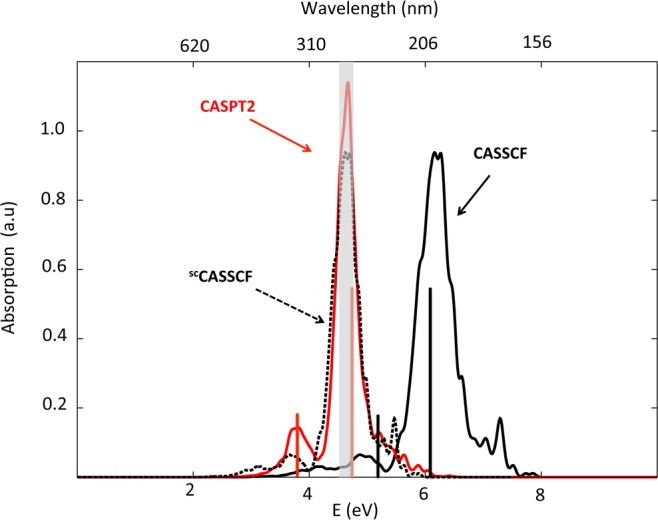
Simulated absorption spectra for CHDEPO. Black solid line corresponds to the spectrum calculated using SA4-CASSCF(14,12)/ANO-RCC level of theory, while red solid line represents the results corrected using the MS-CASPT2 method. Black dotted line outlines the CASSCF scaled spectrum (scCASSCF).
To quantify the impact of such approximation, we have scaled by a factor of 0.75 the CASSCF spectrum and compare it with the CASPT2 one. The almost complete superposition of the red solid line and the dotted black line in Figure 1 denotes a very good agreement between the scaled CASSCF and the CASPT2 results at the Franck–Condon region. A similar assessment of the impact of the scaling was performed along the MEP, taking as a reference the GS equilibrium geometry. The results can be found in the following section.
Cycloreversion and O–O Homolysis Pathways from a Static Perspective
To both guide the interpretation of the dynamical results and to assess the quality of the method used in the on-the-fly electronic structure calculations, we have investigated the MEP connected to both O–O homolysis and cycloreversion with the CASSCF method. Since the reaction paths are independent of the nuclear masses, all the static calculations were performed on hydrogenated CHDEPO. More reliable CASPT2 calculations were performed at the stationary, critical, and intermediate points along the MEP where the comparison with CASPT2 benchmark values was found to be critical for the dynamics. Interestingly, CASSCF and CASPT2 provide PES in qualitatively good agreement, at least for the regions relevant to the photochemistry of these systems. Therefore, in the following only CASPT2 relative energies will be discussed.
The scaling of the CASSCF energies along the two MEPs was found to reduce the slope of the profiles mimicking the CASPT2 result but also to decrease the energy barriers. However, since CASSCF provides similar reaction barriers as CASPT2 and the system has only to face these barriers at the GS PES, the scaling of the energies was suppressed once the trajectory deactivates to the GS. Thus, overall, we expect the scaling to have a small effect on the time scales of the two photochemical processes studied but not to influence the mechanism or product distributions.
Figure 2 shows the scheme proposed for O–O homolysis mechanism based on the CASSCF MEP calculated following the gradient of the second root (i.e., first excited state). Similarly to previous calculations for the same21e and other endoperoxides,21c the MEP from the Franck–Condon region leads barrierlessly to an energetically accessible high degeneracy point of four singlet states (4CI), among which the GS is included. Structurally speaking, this corresponds to a point of the PES where the system presents an internuclear O–O distance at which the distribution of six electrons into the πOO, π*OO, σOO and σ*OO orbitals leads to four different configurations energetically indistinguishable.
Figure 2.
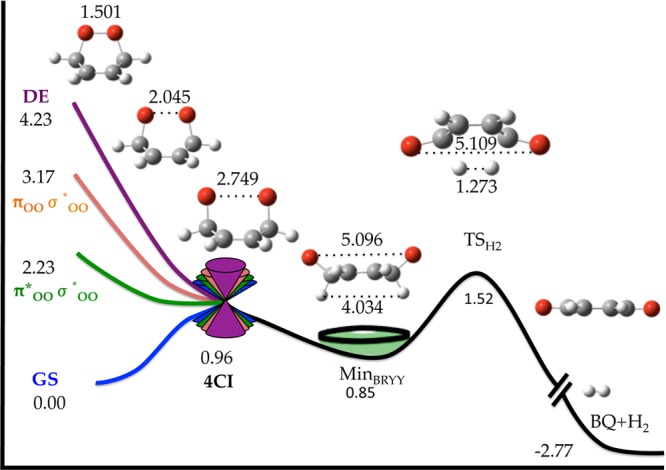
Global static picture of the O–O homolysis mechanism of CHDEPO based on MEP calculations (from this work and ref (21e)). Final energies relative to the GS minimum (in eV) were calculated at MS-CASPT2//SA4-CASSCF(14,12)/ANO-RCC level of theory. Bond distances in angstroms. The state labeling was inferred from the final products of the MEP. The label 4CI stands for a degeneracy of four singlet states.
Extrapolating from other previous dynamics works studying nonadiabatic dynamics across more than two state degeneracy points,36 deactivation through this particular funnel is expected to be achieved on very short time scales due to the occurrence of large regions of seams of three and two degenerate states that would significantly enhance the population transfer toward the GS.
This high-order degeneracy point of the PES was previously shown to be connected21e with four different diradical minima in the GS PES approximately of the same stability. Starting from the most stable, MinBRYY, we have estimated in 0.7 eV the energy barrier, TSH2, that requires the breaking of the two CH bonds sitting at the endoperoxide carbons, leading to the formation of the benzoquinone and molecular H2 photoproducts. These photoproducts have been identified as the most stable for CHDEPO and the only ones observed from our dynamics simulations following O–O homolysis mechanism, see below.
The cycloreversion mechanism was investigated with a MEP starting from the Franck–Condon region following the gradient of the brighter second excited state (third root). Similarly to the MEP from the first excited state in Figure 2, this path proceeds showing neither minima nor energy barriers toward a CI with the GS, see Figure 3. On the way to the GS, however, a CI S2/S1 with the second root is also found that might deviate population to the lower lying state. The S1/S0 conical intersection is expected to bifurcate population between two minima in the ground PES, i.e., the Franck–Condon minimum (MinFC) and MinSW.
Figure 3.
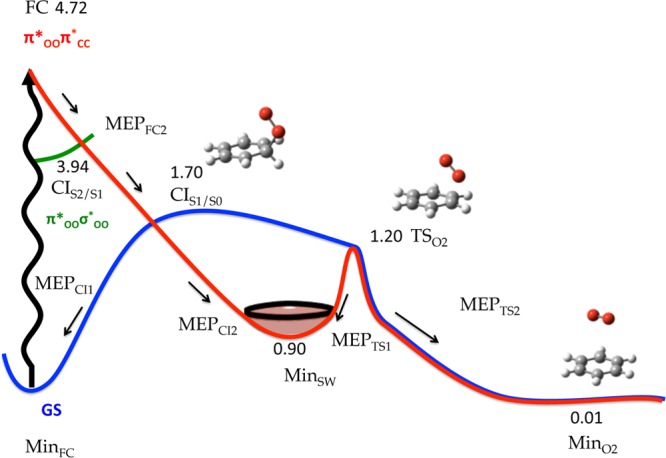
Global static picture of the cycloreversion mechanism of CHDEPO based on MEP calculations. Final energies relative to the GS minimum (in eV) were calculated at MS-CASPT2//SA4-CASSCF(14,12)/ANO-RCC level of theory. Other information on the MEP calculations can be found in the Supporting Information. The state labeling was inferred from the final products of the MEP.
Along the MEP coordinate, we observe the stretching of one of the two C–O bonds that increases from a 1.472 Å value at the FC geometry to 3.901 Å at the position of the MinSW, corresponding to the intermediate along the stepwise cleavage of the endoperoxide bridge. Logically, the rupture of one of the two C–O bonds is concomitant to the progressive recovery of the planarity of the hydrocarbon moiety, due to the redistribution of electronic density among all the C of the ring. A single C–O bond still separates the population reaching MinSW from the final cycloreversion photoproducts, benzene + 1O2 (recall Scheme 1 and Figure 3). Starting from this minimum, the breaking of the second C–O bond involves overcoming an energy barrier of 0.3 eV to reach a predissociation minimum, MinO2, where the hydrocarbon and oxygen are weakly interacting through van der Waals forces. For this minimum, the dissociation energy was calculated to amount to ca. 0.2 eV at CASPT2 level of theory. The height of the barrier (0.3 eV), much lower than the initial Franck–Condon energy (4.72 eV), is not expected to prevent the formation of the cycloreversion products along the dynamics.
The probability to populate the triplets along both O–O homolysis and cycloreversion pathways was evaluated by computing the SOC at selected points of the PES. Especially relevant are the values of the couplings calculated at the position of the 4CI that amount to ∼70 cm–1 or at the region of the PES corresponding to minimum MinO2, where the SOC increases up to ∼180 cm–1.
Although very mixed at the FC region, from the inspection of the fate of the MEPs constructed along the gradient of the two lowest lying excited states, it could be inferred that the character of the two first excited states is respectively π*OOσ*OO and π*OOπ*CC, which is also consistent with the oscillator strengths computed vertically.
In summary, the static picture described above reveals that the two proposed deactivation mechanisms for CHDEPO, O–O homolysis and cycloreversion, are likely to take place simultaneously upon UV excitation. In both scenarios, the system would reach barrierlessly a GS minimum, MinBRYY/MinSW, from which a small energy barrier separates the final photoproducts. The following dynamics simulations will help elucidating additional details on the deactivation mechanisms as well as the final ratio of different photoproducts.
Excited-State Dynamics of CHDEPO
Singlet/Triplet Dynamics Simulations
Figure 4 shows the time evolution of the four singlet (S0, S1, S2, and S3) and four triplet states (T1, T2, T3, and T4) population of the 78 trajectories propagated, created using deuterated CHDEPO, along 100 fs. Although the propagation was done in 16 spin–orbit states, arising from the diagonalization of the total Hamiltonian, for simplicity the analysis will be done on the spin-free states, where the electronic wave function was projected back into the initial singlet and triplet states. Initially, the trajectories are distributed according to a 65:35 ratio between the S2 and S3 electronic states. This translates into a mixture of π*OOσ*OO and π*OOπ*CC states, where the π*OOπ*CC states are dominant (85% vs 15%).
Figure 4.
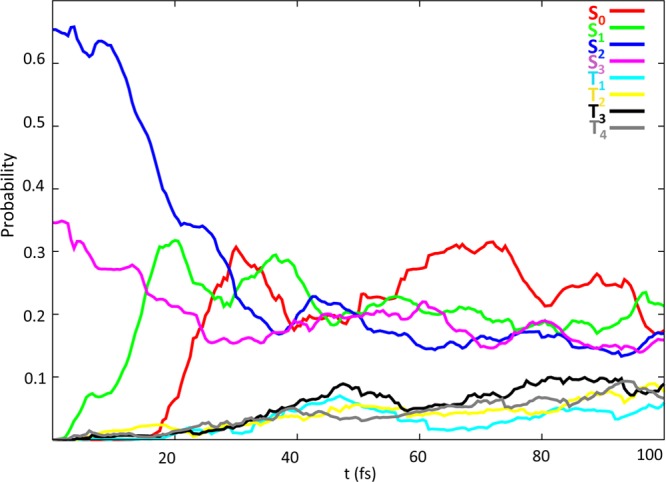
Time evolution of the average quantum probability of singlet (S0 in red, S1 in green, S2 dark blue, S3 in pink) and triplet (T1 in light blue, T2 in yellow, T3 in black, T4 in gray) states.
Interestingly, 30 fs only after photoexcitation, the population of the initially populated states (S2 and S3) rapidly decays in favor of the S1 and S0 states. This fast decay is perfectly consistent with the steep MEPs computed for O–O homolysis and cycloreversion mechanisms, which do not predict any barrier on the way to the population of lower lying electronic states.
At t = 50 fs, the population of the four singlets becomes equal and oscillates for 10 fs around an average value of 0.2, which is compatible with a situation of the wavepacket exploring the region of the PES corresponding to the 4CI. From 60 fs onward, the population of the S0 grows momentarily slightly larger than for the other singlets to decrease again at the final time of the propagation. At the final time of the simulations, the total population is distributed as 60% in the singlet and 40% in the triplet manifold, with all the electronic states within each manifold carrying approximately the same population.
A particularly interesting observation is that the triplet character of the trajectories shows up at very early times of the simulation, i.e., below 20 fs, and that the maximum total expected population of the triplets is achieved already at a t = 50 fs. This observation is in line with the conclusions drawn in other works that support that ISC in organic molecules can be ultrafast37 even if no heavy elements are present.29a,29c
In order to determine the final distribution of photoproducts derived from O–O homolysis and cycloreversion processes, we have followed the evolution of the distance between the centers of mass of the benzene and O2 moieties, dBenz–OO, see Figure 5. This distance is expected to oscillate around small values for the trajectories evolving via the O–O homolysis mechanism, whereas for cycloreversion this value is expected to increase gradually as the two CO bonds are cleaved.
Figure 5.
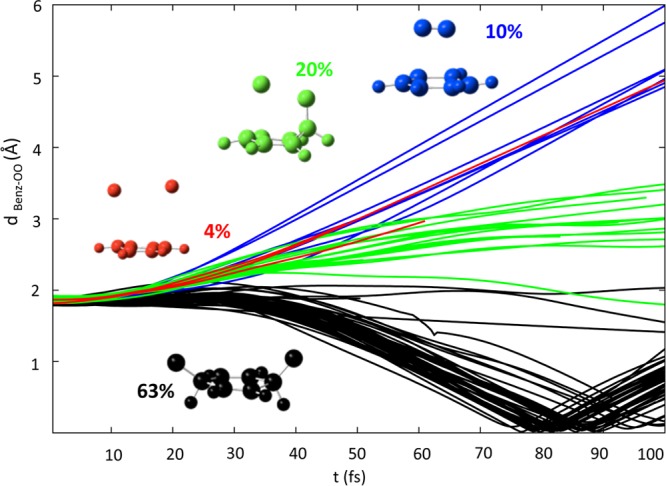
Time evolution of the dBenz–OO distance for different groups of trajectories. In black, trajectories leading to O–O homolysis, in blue the ones producing B+1O2 and other products in red and green. Percentages for the different products are specified.
According to this criterion, we have classified all the trajectories into four main groups. All the trajectories start from an initial value of ca. 2 Å, which corresponds to the distance between O2 and benzene centers of mass at the optimized CASSCF GS geometry. The first group of trajectories, denoted in black in Figure 5, is characterized by a progressive diminishing of the dBenz–OO distance until reaching the value of zero; this corresponds to a structure where the two oxygens, although still bonded to their adjacent C atoms, lie at the largest possible distance, coplanar with the rest of the atoms of the ring. After t = 80 fs, this distance again increases until reaching a slightly smaller value than the initial one. These trajectories, which represent a 63% of the total, have been ascribed to the O–O homolysis mechanism and perfectly describe the oscillating bending movement that the system experiences as the endoperoxide bond is broken and the 8CI degeneracy point is reached. These trajectories will end up in any of the four theoretically predicted minima,21e characterized by a dBenz–OO distance slightly smaller than the original endoperoxide. Next group of trajectories, distinguished in blue in Figure 5, are characterized by a linear increase in the dBenz–OO distance with time, reaching a maximum value of ∼6 Å at the final time of the simulation. These trajectories, which amount to 10%, correspond to cycloreversion, leading to benzene and 1O2 as final products.
Another 20% of the trajectories, in green in Figure 5, evolve to a structure in which both the endoperoxide and a single C–O bonds are dissociated. A similar situation is observed for the remaining 4% of the trajectories, highlighted in red in Figure 5, which show the simultaneous increase of both the O–O and the two C–O distances. From the very high energy expected for these processes, we could infer that the employed ab initio methodology is not able to correctly describe this region of the PES and significantly underestimates the energy barrier for the dissociation of two or more bonds simultaneously.
In principle, the shape of the potential energy profiles for cycloreversion depicted in Figure 3 shows energy barriers flanking MinSW, that would favor the evolution of the system toward the formation of cycloreversion products, rather than reverting to the initial GS or O–O homolysis products, and the structural evolution of the red and green trajectories in Figure 5 parallel to the blue group of trajectories would justify directly imputing these later trajectories to cycloreversion (in blue). With this more logical assumption, a final total yield for cycloreversion of ca. 30% is obtained, in line with the experimental observations for the larger endoperoxide, APO.22c
An analysis of the multiplicity at the final point of the propagation for different groups of trajectories reveals that no cycloreversion products are formed in the triplet manifold (blue trajectories in Figure 5). However, ca. 50% of the trajectories leading to O–O homolysis end up in a triplet state. This is compatible with the existence of the 8CI along the rupture of the endoperoxide bridge. Also interesting is the fact that none of the trajectories revert to the starting point of the simulation, leading to a 100% yield of photoproducts, also in line with the experiments in refs (22b and 22c).
Although we have evidence that birradical minima are formed from the O–O homolysis mechanism along the dynamics, quite unexpectedly, none of these trajectories was found to lead to the final products, i.e., benzoquinone + D2 during the 100 fs propagation time. We attribute these results to the combination of dynamic effects and the use of a reduced active space. In principle, the correct and simultaneous description of both O–O homolysis and cycloreversion processes would require that the active space includes a pair of σCO, σ*CO, σCH, and σ*CH orbitals. After including the remaining π orbitals from the ring and π and σ orbitals of the endoperoxide, such an active space would necessarily increase its size to 16 orbitals, which is computationally prohibitive for a dynamical study, such as the one proposed here. However, since the inclusion of the σCH and σ*CH orbitals is decisive for a correct description of the TSH2 structure, lacking these orbitals most likely overestimates the energy barrier connected to the loss of H2, hindering the evolution of the trajectories toward the final photoproducts. Further dynamical effects might also influence the output of this product in the dynamics. The formation of H2 involves on the one hand the concerted cleavage of the two CH bonds and, on the other, the in phase bending vibration of the two OC1C2 angles, where C1 and C2 stand for the C atoms holding the endoperoxide bridge. This bending mode would allow the symmetric puckering of the hydrocarbon ring and the H atoms to encounter. In other words, the momenta of the oxygen and H atoms should point in opposite directions to direct the approach between the two H atoms. This precise alignment of the momenta of O and H atoms might need longer time scales than the ones allowed here, partially explaining the absence of trajectories leading to the final products BQ + H2. In fact, an exemplary trajectory propagated during additional 80 fs demonstrates the formation of H2 (see next section). Further details on the O–O homolysis and cycloreversion mechanisms will be provided in the next Analysis of Representative Trajectories section.
Analysis of Representative Trajectories
In this section, several trajectories representative for the O–O homolysis and cycloreversion photoreactions will be discussed in detail. Figures 6 and 7A, respectively, exemplify the generation of 1O2 and H2 from excited CHDEPO.
Figure 6.
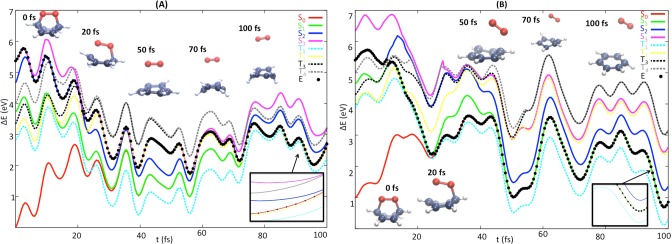
Time evolution of two representative trajectories of deuterated CHDEPO leading to B + 1O2 products. Singlet states are represented by solid lines, (S0 in red, S1 in green, S2 in blue, and S3 in pink), while triplet states are denoted with dotted lines in light blue T1, yellow T2, black T3, and gray T4. Black points indicate the current potential energy of the system at each time.
Figure 7.
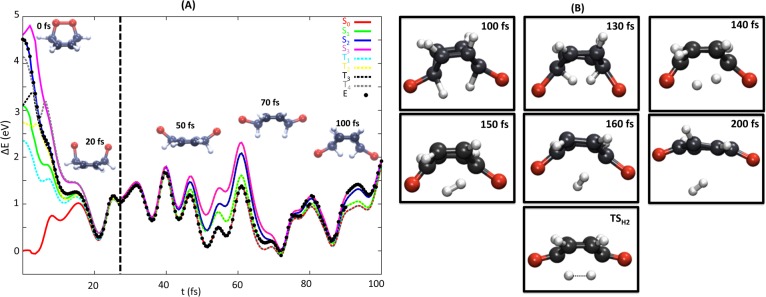
(A) Time evolution of a representative trajectory leading to BQ + H2 products. Singlet states are represented as solid lines, (S0 in red, S1 in green, S2 in blue, and S3 in pink), while triplet states are denoted with dotted lines in light blue T1, yellow T2, black T3, and gray T4. Black points indicate the current potential energy of the system at each time. The vertical dotted line in black in panel A indicates the point when the trajectory reaches the S0 and the energy scaling is switched off. (B) Snapshots for longer propagation times and the optimized geometry of the TSH2 for comparison. Note that for this trajectory deuterium atoms where replaced by hydrogens (see text).
For the description of cycloreversion (Figure 6), we have chosen two trajectories with CHDEPO initially photoexcited to the S3 (panel A) and the S2 (panel B). The trajectory in panel A, illustrates the generation of 1O2 in the excited state followed by GS relaxation, whereas the trajectory in panel B, is representative for the other trajectories where the dissociation of 1O2 takes place in two sequential stages: the first in the excited state and the second in the GS, in agreement with the static picture described in Figure 3.
The trajectory of Figure 6A relaxes to the S2 very fast after 10 fs. The cleavage of one of the two C–O bonds induces the degeneracy of the S3 and S2 electronic states, promoting the backward hop to the upper electronic state 10 fs later. During the following 40 fs the system evolves in the S3, where it experiences the dissociation of the second C–O bond. In this region of the PES, we observe the degeneracy between the S3 and the second triplet state (T2 in yellow). However, no ISC is observed at this point of the propagation. For t = 60 fs, the system hops back to the S2 state, where it remains for 15 fs more and then finally decays to the S0. This last stage of the mechanism structurally translates into the distancing of the O2 molecule from the hydrocarbon moiety.
The second trajectory in Figure 6B relaxes as well via internal conversion within the first 10 fs to the immediately below excited state, S1, where it spends the following 10 fs, until it reaches a new internal conversion funnel to the S0. The former two interstate crossings can be readily identified with the CIS2/S1 and CIS1/S0 conical intersections optimized along the static calculations, see Figure 3. At t = 20 fs, the oxygen moiety is bonded to the hydrocarbon through a single C–O bond, while the other has been dissociated on the way to the GS. An increase of the potential energy for the S0 is observed upon the dissociation of the remaining C–O bond. Finally, an additional barrier needs to be overcome for the dissociation of the weak van der Waals complex, in agreement again with the topology of the potential energy profiles depicted in Figure 3.
From the careful analysis of the electronic structure of the final benzene and oxygen moieties and the degeneracy (double) of the singlet electronic states where the system is at the final time of the propagation for all the trajectories leading to 1O2, we infer that the hydrocarbon and O2 are generated in their ground and 1Δg electronic state, respectively. Also interesting is the fact that the electronic state reached at the end of the propagation does not correspond to the most stable, since there is at least another triplet of lower energy (T1). In spite of the significant SOC computed along this mechanism and the occurrence of degeneracy regions between singlets and triplets, no ISC was observed along none of the trajectories evolving according to the cycloreversion mechanism. We ascribe this negligible role of the triplets in the cycloreversion mechanism to the topology of the singlet and triplet potentials along the global cycloreversion reaction coordinate. In fact, the only region of the PES where ISC is likely to occur, i.e., where close lying triplet states (see Figure 6B) and considerable spin-orbit coupling (60 cm–1) exist, is at the position of the MinSW minimum, where the system could be trapped. However, the orientation of the momentum of the trajectories undergoing cycloreversion in the direction of the access to the transition state TSO2 prevents the confinement of the trajectories in this region of the PES long enough time for the system to reach the triplet manifold.
The trajectory selected for describing O–O homolysis (Figure 7) was created using hydrogenated CHDEPO. This trajectory starts from the second excited state, S2, and evolves very rapidly (in 20 fs) following a very steep potential to the 8CI region, consistently with the static results discussed above, recall Figure 2. During this time, the system starts dissociating the endoperoxide bridge. Once in the high degeneracy region, the system spends several tens of fs visiting different electronic states, including triplets. The GS is reached for the first time only 25 fs after the trajectory is initiated, supporting the findings of previous work,36a stating that high order degeneracy points constitute extremely efficient deactivation funnels to the GS.
From a structural viewpoint, during its journey along the 8CI, the endoperoxide bond continues dissociating at the same time that the two D atoms sitting at the carbons holding the endoperoxide bridge move closer. Since for none of the trajectories computed, the two D atoms succeeded in forming molecular H2, the opposite movement, restoring the endoperoxide bridge while separating the D atoms, was observed. For some trajectories, this oscillatory movement was repeatedly observed until the final time of the simulations. In order to study the last stages of the O–O homolysis mechanism, an additional trajectory based on initial conditions generated using H instead of D was propagated for a longer time. Since the short CH distances of the structure for t = 100 fs did not allow introducing the σCH and σ*CH orbitals, we decided to propagate further the trajectory with the smaller active space (10,8) excluding CH and CO σ orbitals and the 6-31G basis set. The snapshots can be found in Figure 7B. This figure also presents the optimized geometry for the TSH2, accounting for the concerted dissociation of the two CH bonds leading to H2, that is similar to the geometries recorded at t = 140 and 150 fs. As concluded from the sequence of frames of this trajectory, the generation of H2 from the preceding biradicals requires ca. 100 more fs either to evolve the active space so as to exchange other less important valence orbitals for the σCH and σ*CH orbitals or to put in phase the momenta of H/O atoms to correctly describe H2 dissociation.
Conclusions
This work presents the first complete analysis, from both static and dynamic viewpoints, of the photophysics and photochemistry of an endoperoxide. To this aim, CHDEPO has been chosen as a representative of this class of compounds. As in other endoperoxides, upon excitation CHDEPO can undergo O–O homolysis, leading to benzoquinone + H2, and cycloreversion, generating benzene and 1O2 as photoproducts.
The static and dynamic results are consistent in describing both pathways consisting of two steps. The first step is a barrierless deactivation to GS intermediates: MinSW (cycloreversion, Figure 3) or one of the four biradical minima, for instance MinBRYY, (O–O homolysis, Figure 2). The second step to generate the final photoproducts takes place in the GS, where the system needs to overcome an energy barrier that corresponds to the cleavage of the second C–O bond, TSO2, in cycloreversion (Figure 3) or to the concerted rupture of both CH bonds simultaneously, TSH2, in O–O homolysis (Figure 2). A number of important mechanistic conclusions with implications in several biological and technological applications can be drawn from our study:
-
(1)
The generation of 1O2 takes place through a stepwise mechanism. The breaking of the first C–O bond takes place barrierlessly on the way to the GS after going through several conical intersections. The second C–O is, however, cleaved once the system is in the GS after overcoming an energy barrier.
-
(2)
In agreement with the experimental observations,22c our dynamics simulations predict that 1O2 is generated in its lower electronic excited state (1Δg).
-
(3)
According to the present simulations, the triplets do not play a significant role in the 1O2 generation mechanism. No ISC was registered along any of the cycloreversion trajectories in contrast to O–O homolysis, where an important population transfer to the triplet manifold was observed.
Despite the lack of experimental information on CHDEPO, it is possible to establish some links between our simulations and the recent femtosecond UV pump probe experiments22c investigating the dual photochemistry of the larger endoperoxide APO. Interestingly, and similar to the experiments,22c our simulations predict the full transformation of the endoperoxide into its photoproducts; that is, no trajectories were found to revert to the original GS of CHDEPO. Excitation of APO at 270 or 282 nm, which populates the high-lying spectroscopic state S4 (ππ*), leads to a yield for the cycloreversion reaction oscillating between 25% and 29%, in line with our theoretical results (30%), starting from the π*OOπ*CC electronic state.
Also consistent with the experiment, the leading photodeactivation process is O–O homolysis with a final yield of 65%. However, and in contrast with the experiment,22c we do not detect any cycloreversion trajectory evolving along the triplet manifold in CHDEPO. The role of the triplets seems to be only important along the O–O homolysis deactivation pathway.
The rationalization of the mechanism for 1O2 generation and its competition with side pathways leading to photoproducts is expected to inspire the development of new photosensitizers to be used in the many different areas where the production of this oxidant has a leading role.
Acknowledgments
This work was supported by the Spanish Ministerio de Economía y Competitividad (project no. CTQ2012-35513-C02-01, no. CTQ2012-36184, Beca de Formación de Profesorado Universitario (L.M.-F.) and Juan de la Cierva contract (J.G,-V,)), the ERA-Chemistry project no. PIM2010EEC-0075, the EPLORA project no. CTQ2013-50150-EXP, and the Austrian Science Fund (FWF) within P25827. The COST Action CM1204 as well as generous allocation of computer time at the Centro de Supercomputación de Galicia (CESGA) and the Centro de Computación Científica de la Universidad Autónoma de Madrid are also acknowledged. Finally, the authors thank J. M. Segovia for the design of the graphical abstract.
Supporting Information Available
Further details regarding the static calculations and dynamic simulations, SHARC scheme, minimum energy paths, absorption spectra, and representative trajectories. This material is available free of charge via the Internet at http://pubs.acs.org/.
The authors declare no competing financial interest.
Supplementary Material
References
- DeRosa M. C.; Crutchley R. J. Coord. Chem. Rev. 2002, 233–234, 351. [Google Scholar]
- a Clennan E. L. Tetrahedron 2000, 56, 9151. [Google Scholar]; b Frimer A. A.Singlet O2; CRC: Boca Raton, 1985. [Google Scholar]
- Schweitzer C.; Schmidt R. Chem. Rev. 2003, 103, 1685. [DOI] [PubMed] [Google Scholar]
- a Gerdes R.; Bartels O.; Schneider G.; Wöhrle D.; Schulz-Ekloff G. Polym. Adv. Technol. 2001, 12, 152. [Google Scholar]; b Nowakowska M.; Kępczyński M. J. Photochem. Photobiol., A 1998, 116, 251. [Google Scholar]; c Iliev V.; Prahov L.; Bilyarska L.; Fischer H.; Schulz-Ekloff G.; Wöhrle D.; Petrov L. J. Mol. Catal. A: Chem. 2000, 151, 161. [Google Scholar]
- a Jori G.; Brown S. B. Photochem. Photobiol. Sci. 2004, 3, 403. [DOI] [PubMed] [Google Scholar]; b Wainwright M. J. Antimicrob. Chemother. 1998, 42, 13. [DOI] [PubMed] [Google Scholar]
- Bonnett R.Chemical Aspects of Photodynamic Therapy; Gordon and Breach Science Publishers: Amsterdam, 2000. [Google Scholar]
- Braginskii O. V.; Vasil’eva A. N.; Klopovskii K. S.; Kovalev A. S.; Lopaev D. V.; Mankelevich Y. A.; Popov N. A.; Rakhimov A. T.; Rakhimova T. V. Quantum Electron. 2005, 35, 21. [Google Scholar]
- a Corey E. J.; Taylor W. C. J. Am. Chem. Soc. 1964, 86, 3881. [Google Scholar]; b Jockusch S.; Turro N. J.; Thompson E. K.; Gouterman M.; Callis J. B.; Khalil G. E. Photochem. Photobiol. Sci. 2008, 7, 235. [DOI] [PubMed] [Google Scholar]
- Kearns D. R. Chem. Rev. 1971, 71, 395. [Google Scholar]
- Miyamoto S.; Ronsein G. E.; Prado F. M.; Uemi M.; Corrêa T. C.; Toma I. N.; Bertolucci A.; Oliveira M. C. B.; Motta F. D.; Medeiros M. H. G.; Mascio P. D. IUBMB Life 2007, 59, 322. [DOI] [PubMed] [Google Scholar]
- Held A. M.; Halko D. J.; Hurst J. K. J. Am. Chem. Soc. 1978, 100, 5732. [Google Scholar]
- Noronha-Dutra A. A.; Epperlein M. M.; Woolf N. FEBS Lett. 1993, 321, 59. [DOI] [PubMed] [Google Scholar]
- Mascio P. D.; Bechara E. J.; Medeiros M. H. G.; Briviba K.; Sies H. FEBS Lett. 1994, 355, 287. [DOI] [PubMed] [Google Scholar]
- Khan A. U.; Kasha M. Proc. Natl. Acad. Sci. U.S.A. 1994, 91, 12365. [DOI] [PMC free article] [PubMed] [Google Scholar]
- Miyamoto S.; Martinez G. R.; Medeiros M. H. G.; Mascio P. D. J. Am. Chem. Soc. 2003, 125, 6172. [DOI] [PubMed] [Google Scholar]
- a Hampton M. B.; Kettle A. J.; Winterbourn C. C. Blood 1998, 92, 3007. [PubMed] [Google Scholar]; b Klebanoff S. J.Oxygen metabolites from phagocytes. In Inflammation: Basic Principles and Clinical Correlates; Gallin J. I., Snyderman R., Eds.; Lippincott Williams & Wilkins: Philadelphia, PA, 1999; p 721. [Google Scholar]
- a Berliner J. A.; Heinecke J. W. Free Radic. Biol. Med. 1996, 20, 707. [DOI] [PubMed] [Google Scholar]; b Esterbauer H.; Gebicki J.; Puhl H.; Jürgens G. Free Radic. Biol. Med. 1992, 13, 341. [DOI] [PubMed] [Google Scholar]
- a Tromberg B. J.; Orenstein A.; Kimel S.; Barker S. J.; Hyatt J.; Nelson J. S.; Berns M. W. Photochem. Photobiol. 1990, 522375. [DOI] [PubMed] [Google Scholar]; b Foster T. H.; Murant R. S.; Bryant R. G.; Knox R. S.; Gibson S. L.; Hilf R. Radiat. Res. 1991, 126, 296. [DOI] [PubMed] [Google Scholar]
- a Freyer W.; Leupold D. J. Photochem. Photobiol., B 1995, 30, 77. [DOI] [PubMed] [Google Scholar]; b Freyer W.; Stiel H.; Teuchner K.; Leupold D. J. Photochem. Photobiol., A 1994, 80, 161. [DOI] [PubMed] [Google Scholar]
- a Berneburg M.; Grether-Beck S.; Kürten V.; Ruzicka T.; Briviba K.; Sies H.; Krutmann J. J. Biol. Chem. 1999, 274, 15345. [DOI] [PubMed] [Google Scholar]; b Günther G. E. L.; Zanocco A. L. J. Photochem. Photobiol., A 2002, 151, 1. [Google Scholar]; c Nagaoka Y.; Otsu K.; Okada F.; Sato K.; Ohba Y.; Kotani N.; Fuijii J. J. Biochem. Biophys. Res. Commun. 2005, 331, 215. [DOI] [PubMed] [Google Scholar]
- a Martinez-Fernandez L.; González L.; Corral I. Comp. Theor. Chem. 2011, 975, 13. [Google Scholar]; b Corral I.; González L. J. Comput. Chem. 2008, 29, 1982. [DOI] [PubMed] [Google Scholar]; c Mollenhauer D.; Corral I.; González L. J. Phys. Chem. Lett. 2010, 1, 1036. [Google Scholar]; d Corral I.; González L. Chem. Phys. Lett. 2007, 446, 262. [Google Scholar]; e Corral I.; González L. Chem. Phys. Lett. 2010, 499, 21. [Google Scholar]; f Kearns D. R.; Khan A. U. Photochem. Photobiol. 1969, 10, 193. [DOI] [PubMed] [Google Scholar]; g Kearns D. R. J. Am. Chem. Soc. 1969, 91, 6554. [Google Scholar]
- a Corral I.; González L.; Lauer A.; Freyer W.; Fidder H.; Heyne K. Chem. Phys. Lett. 2008, 452, 67. [Google Scholar]; b Fidder H.; Lauer A.; Freyer W.; Koeppe B.; Heyne K. J. Phys. Chem. A 2009, 113, 6289. [DOI] [PubMed] [Google Scholar]; c Lauer A.; Dobryakov A. L.; Kovalenko S. A.; Fidder H.; Heyne K. Phys. Chem. Chem. Phys. 2011, 13, 8723. [DOI] [PubMed] [Google Scholar]; d Klein A.; Kalb M.; Gudipati M. S. J. Phys. Chem. A 1999, 103, 3843. [Google Scholar]; e Eisenthal K. B.; Turro N. J.; Dupuy C. G.; Hrovat D. A.; Langan J.; Jenny T. A.; Sitzmann E. V. J. Phys. Chem. 1986, 90, 5168. [Google Scholar]; f Schmidt R.; Schaffner K.; Trost W.; Brauer H. D. J. Phys. Chem. 1984, 88, 956. [Google Scholar]; g Gudipati M. S.; Klein A. J. Phys. Chem. A 2000, 104, 166. [Google Scholar]; h Brauer H. D.; Schmidt R. J. Phys. Chem. A 2000, 104, 164. [Google Scholar]
- Roos B. O.In Ab Initio Methods in Quantum Chemistry II; Lawley K. P., Ed.; Wiley: Chichester, 1987. [Google Scholar]
- Pierloot K.; Dumez B.; Widmark P. O.; Roos B. O. Theor. Chim. Acta 1995, 90, 87. [Google Scholar]
- Hariharan P. C.; Pople J. A. Theor. Chim. Acta 1973, 28, 213. [Google Scholar]
- Roos B. O.; Lindh R.; Malmqvist P.-Å.; Veryazov V.; Widmark P. O. J. Phys. Chem. A 2004, 108, 2851. [Google Scholar]
- Aquilante F.; et al. J. Comput. Chem. 2010, 31, 224. [DOI] [PubMed] [Google Scholar]
- a Bajo J. J.; González-Vázquez J.; Sola I.; Santamaria J.; Richter M.; Marquetand P.; González L. J. Phys. Chem. A 2012, 116, 2800. [DOI] [PubMed] [Google Scholar]; b Richter M.; Marquetand P.; González-Vázquez J.; Sola I.; González L. J. Chem. Theory Comput. 2011, 7, 1253. [DOI] [PubMed] [Google Scholar]
- a Mai S.; Marquetand P.; Richter M.; González-Vázquez J.; González L. ChemPhysChem 2013, 14, 2920. [DOI] [PubMed] [Google Scholar]; b Mai S.; Marquetand P.; González L. J. Chem. Phys. 2014, 140, 204302. [DOI] [PubMed] [Google Scholar]; c Richter M.; Mai S.; Marquetand P.; González L. Phys. Chem. Chem. Phys. 2014, 16, 24423. [DOI] [PMC free article] [PubMed] [Google Scholar]
- a Verlet L. Phys. Rev. 1967, 159, 98. [Google Scholar]; b Verlet L. Phys. Rev. 1968, 165, 201. [Google Scholar]
- Granucci G.; Persico M. J. Chem. Phys. 2007, 126, 134114. [DOI] [PubMed] [Google Scholar]
- Zhu C.; Nangia S.; Jasper A. W.; Truhlar D. G. J. Chem. Phys. 2004, 121, 7658. [DOI] [PubMed] [Google Scholar]
- Nelson T.; Fernandez-Alberti S.; Roitberg A. E.; Tretiak S. J. Chem. Phys. 2013, 138, 224111. [DOI] [PubMed] [Google Scholar]
- a Warshel A. Nature 1976, 206, 679. [DOI] [PubMed] [Google Scholar]; b Barbatti M.; Lischka H. J. Phys. Chem. A 2007, 111, 2852. [DOI] [PubMed] [Google Scholar]
- Frutos L. M.; Andruiniów T.; Santoro F.; Ferré N.; Olivucci M. Proc. Natl. Acad. Sci. U.S.A. 2007, 104, 7764. [DOI] [PMC free article] [PubMed] [Google Scholar]
- a Coe J. D.; Martínez T. J. J. Am. Chem. Soc. 2005, 127, 4560. [DOI] [PubMed] [Google Scholar]; b Assmann M.; Worth G. A.; González L. J. Chem. Phys. 2012, 137, 22A524. [DOI] [PubMed] [Google Scholar]; c González-Vázquez J.; González L. ChemPhysChem 2010, 11, 3617. [DOI] [PubMed] [Google Scholar]
- Martínez-Fernández L.; Corral I.; Granucci G.; Persico M. Chem. Sci. 2014, 5, 1336. [Google Scholar]
Associated Data
This section collects any data citations, data availability statements, or supplementary materials included in this article.


