
Figure 3.
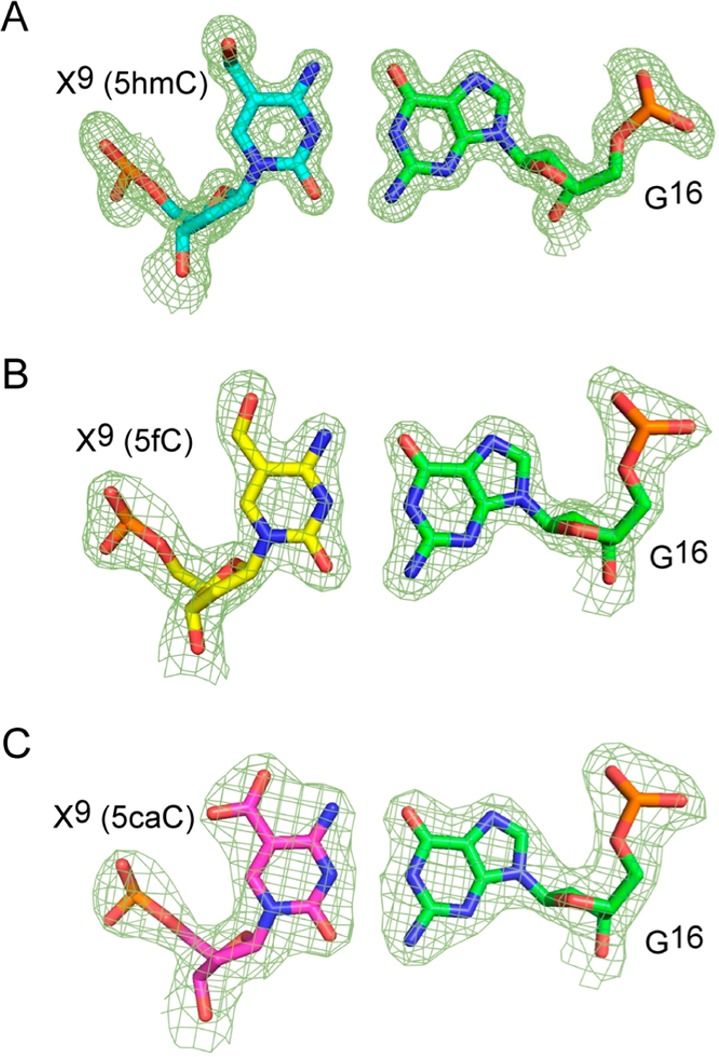
Fourier (2Fo – Fc) sum electron density contoured at the 1.0σ level (green meshwork) around the (A) 5hmC:G, (B) 5fC:G, and (C) 5caC:G base pairs showing Watson–Crick base pairing geometry.
Official websites use .gov
A
.gov website belongs to an official
government organization in the United States.
Secure .gov websites use HTTPS
A lock (
) or https:// means you've safely
connected to the .gov website. Share sensitive
information only on official, secure websites.
Fourier (2Fo – Fc) sum electron density contoured at the 1.0σ level (green meshwork) around the (A) 5hmC:G, (B) 5fC:G, and (C) 5caC:G base pairs showing Watson–Crick base pairing geometry.