

Abstract
Epithelial-mesenchymal transition (EMT) is a physiological program that is activated during cancer cell invasion and metastasis. We show here that EMT-related processes are linked to a broad and conserved program of transcriptional alterations that are influenced by cell contact and adhesion. Using cultured human breast cancer and mouse mammary epithelial cells, we find that reduced cell density, conditions under which cell contact is reduced, leads to reduced expression of genes associated with mammary epithelial cell differentiation and increased expression of genes associated with breast cancer. We further find that treatment of cells with matrix metalloproteinase-3 (MMP-3), an inducer of EMT, interrupts a defined subset of cell contact-regulated genes, including genes encoding a variety of RNA splicing proteins known to regulate the expression of Rac1b, an activated splice isoform of Rac1 known to be a key mediator of MMP-3-induced EMT in breast, lung, and pancreas. These results provide new insights into how MMPs act in cancer progression and how loss of cell–cell interactions is a key step in the earliest stages of cancer development.
Keywords: breast cancer, mammary epithelial cells, cell contact, epithelial-mesenchymal transition, matrix metalloproteinases, extracellular matrix
Introduction
Epithelial-mesenchymal transition (EMT) is a physiological process that is critical for embryonic development and that plays an important role in wound healing and tissue morphogenesis, but which becomes activated during pathological conditions, including fibrosis and cancer.1–3 EMT is characterized by decreased adhesion to neighboring epithelial cells and the basement membrane, a specialized network of extracellular matrix (ECM) proteins that underlie epithelial tissues; increased association with interstitial ECM molecules; as well as increased cellular motility. Activation of EMT is associated with altered expression of many genes, including downregulation of epithelial markers, including E-cadherin and epithelial cytokeratins; upregulation of mesenchymal marker genes, including N-cadherin and vimentin; and altered expression of integrins and other molecules that associate with the ECM.4,5 In normal development, EMT is a process that is tightly choreographed so as to maintain the integrity of the epithelial sheet, proceeding through steps involving specification of the cells that will undergo EMT, followed by cellular extrusion in coordination with tissue morphogenesis to fill the gap, and then conversion of the extruded cell to the mesenchymal phenotype. In cancer, these processes become uncoordinated and chaotic, and are highly dependent upon the specific characteristics of the tumor microenvironment.
Cell culture models have proven to be useful for dissecting the signaling pathways that regulate EMT,1,6 and sophisticated model systems have been developed to determine how these pathways are integrated in normal tissues and in tumor progression.7 MCF10A mammary epithelial cells have been used to investigate EMT pathways in premalignant cells, while MCF10A cells are immortal and they do not form tumors in immunocompromised mice and retain their ability to form growth-arrested, polarized mammary acini when grown in the basement membrane surrogate, Matrigel.8,9 However, MCF10A cells readily undergo EMT when exposed to transforming growth factor β (TGFβ),10–12 and have been found to exhibit many EMT-like changes when grown at low cell density: cells grown under sparse conditions on tissue culture plastic express higher levels of many mesenchymal markers, while cells grown under confluent conditions express higher levels of epithelial markers.13 Induction of EMT-associated transcriptional changes has been observed in other cell lines as well, including the original bladder carcinoma cell model used as an EMT paradigm in early EMT publications.14 However, the extent to which density-dependent alterations in MCF10A cells fully recapitulate the EMT program and how this process occurs remain unknown.
Many distinct signaling pathways affect the EMT program, and a theme that has emerged is that signals from soluble extracellular factors are integrated with contextual signaling processes for control of cellular phenotype.1,15,16 Among these extracellular molecules, matrix metalloproteinases (MMPs) have emerged as regulators of EMT through modulation of cell–cell and cell–ECM interactions.17–19 The activation of EMT by MMP-3 (stromelysin-1) has been the best characterized. MMP-3 is highly expressed in the mammary gland, where it functions to regulate branching morphogenesis and post-lactational involution.20,21 Transgenic expression of MMP-3 in mouse mammary glands stimulates development of fibrosis, followed by spontaneous tumor formation.22,23 Exposure of cultured mouse mammary epithelial cells to MMP-3 stimulates the EMT program through changes in cell morphology24–26 and cleavage of E-cadherin,27 increased expression of the Rac1 splice isoform Rac1b, and consequent induction of cellular reactive oxygen species (ROS).28,29 In animal models and in human cancer, MMP-3/Rac1b-induced signaling has been found to lead to EMT, fibrosis, and cancer development in other organs as well, including the breast, lung, and pancreas.30–34
Here, we use transcriptional profiling to investigate the processes by which cell contact regulates EMT and how these processes are affected by exposure to MMP–3. We performed new experiments in which we assessed the effect of differential density in human MCF10A breast epithelial cells and the effect of differential density or exposure to MMP-3 in SCp2 mouse mammary epithelial cells. We found many similar patterns of gene expression in response to differing cell densities in human MCF10A breast epithelial cells and mouse SCp2 mammary epithelial cells, and further found that MMP-3 activates overlapping as well as independent pathways. We obtained evidence that alternative splicing of Rac1b is regulated both by cell density and by MMP-3 as a component of a broad regulation of EMT-associated splicing factors. These findings provide new insights into how the diverse signals from the microenvironment become integrated to facilitate the development of the tumor phenotype.
Materials and Methods
Cell culture
SCp2 nontumorigenic mouse mammary epithelial cells, containing tetracycline-regulated, autoactivated MMP-3 construct, were cultured and used as described previously.28,29,35 The cells were grown in DMEM/F12 (Gibco) supplemented with 2% Tet system approved FBS (Clontech), 0.4 mg/mL G418 sulfate (CellGro), 50 μg/mL gentamicin (Gibco), and 5 μg/mL human recombinant insulin (Gibco). MCF10A cells were grown in DMEM/F12 (Gibco), supplemented with 5% horse serum (Gibco), 20 ng/mL EGF (PeproTech), 0.5 μg/mL hydrocortisone (Sigma), 100 ng/mL cholera toxin (Sigma), 10 μg/mL insulin (Sigma), and 100 μg/mL gentamicin (Gibco) and maintained as described previously.8
Transcriptional analysis by microarray
SCp2 cells were plated in six-well plates at the indicated densities and grown either in the presence or absence of MMP-3. After 72 hours, the cells were lysed in TRIzol (Invitrogen), and RNA was isolated according to the manufacturer’s instructions. The experiment was performed once at seeding densities of 25K, 50K, 100K, and 200K per well, and replicated for seeding densities of 50K, 100K, and 200K; results are presented as single replicates for 25K and with averaged replicates for 50K, 100K, and 200K. Transcriptional profiles were obtained using Affymetrix mouse 430_2 gene expression chips with data analyzed and processed as described previously.36 MCF10A cells were plated in six-well plates at indicated densities with single replicates and lysed in TRIzol after 48 hours. RNA was assessed with Affymetrix human U133_Plus_2 gene expression chips. Transcriptional profiles have been deposited in Gene Expression Omnibus. Gene expression data were processed and analyzed using GeneSpring 13.0. Differentially expressed genes in the MCF10A dataset (n = 3108) were identified as FC > 2.0 in 800K density vs 50K density. Differentially expressed genes (n = 7056) in the SCp2 dataset were identified as FC > 2 in any of 50K control vs 50K MMP-3, 250K control vs 250K MMP-3, or 50K control vs 250K control. K-means clustering was performed on the SCp2 differentially regulated gene set using eight groups, Pearson-centered similarity measure, and 1000 iterations. Meta-analysis was performed using the NextBio platform37 as described previously.38 Gene expression profiles have been deposited in the Gene Expression Omnibus. (GSE63354 is the superseries containing all expression data; GSE63331 is the SCp2-only subseries and GSE63353 is the MCF10A -only subseries.)
Real-time quantitative PCR
RNA was isolated using TRIzol reagent according to the manufacturer’s instructions. cDNA was synthesized with MultiScribe reverse transcriptase (Applied Biosystems). Gene expression levels were assayed by real-time quantitative PCR (RT-qPCR) using 7900HT Fast Real-Time PCR System (Applied Biosystems). TaqMan probes for specific genes (human vimentin Hs00185584_m1, human N-cadherin HS00169953_m1, human E-cadherin Hs00170423_m1, human GAPDH Hs99999905_m1) were purchased from Applied Biosystems. Custom primers and reporter probes were used for human and mouse Rac1b and for mouse GAPDH (human Rac1b: forward primer 5′-TATGACAGATTACGCCCCCTATC-3′, reverse primer 5′-CTTTGCCCCGGGAGGTTA-3′, and probe 5′-AAACGTACGGTAAGGAT-3′; mouse Rac1b: forward primer 5′-TGGACAAGAAGATTATGACAGATTGC-3′, reverse primer 5′-CCCTGGAGGGTCTATCTTTACCA-3′, and probe 5′-CCGCAGACAGTTGGAGA-3′; and mouse GAPDH: forward primer 5′-GTGTCCGTCGTGGATCTGA-3′, reverse primer 5′-GCTTCACCACCTTCTTGATGTCAT-3′, and probe 5′-CTTGGCAGGTTTCTCC-3′). All assays were performed in triplicate, and analysis was performed using RQ Manager software (Applied Biosystems) and the 2−∆∆Ct method to obtain relative quantitation (RQ) values, with GAPDH used as endogenous control.
Phase contrast microscopy and cell area quantification
Phase contrast images of cells were acquired prior to their lysis in TRIzol, using Olympus IX51 microscope, equipped with Olympus objectives (UPlanFLN 10x NA 0.3, LUCPlanFLN 20X NA 0.45) and an Olympus DP72 camera. Projected cell areas were determined using ImageJ software39 by manually outlining cells. At least 40 cells were measured per condition. Graphs represent average cell area with error bars showing standard error of the mean (SEM).
Results
Cell density controls extensive transcriptional programs in MCF10A cells
To determine how gradual differences in MCF10A cell density affected patterns of gene expression, cells were plated in 35-mm plates at 50K, 100K, 200K, 400K, 600K, and 800K cells per dish, and then cultured for 24 hours (Fig. 1A). Image analysis of cell morphology for these conditions (Fig. 1B) revealed that while the cells were more spread at the lowest densities, the differences between the higher densities were smaller. MCF10A cells are known to show differential expression of EMT marker genes depending on whether the cells are cultured under sparse or confluent conditions,13,40 and we also found differential expression of EMT markers, with progressively increasing mRNA levels of the epithelial marker E-cadherin (Fig. 1C) and progressively decreasing mRNA levels of the mesenchymal markers N-cadherin (Fig. 1D) and vimentin (Fig. 1E) at higher cell densities throughout the density range.
Figure 1.

Regulation of EMT characteristics by cell density in MCF10A cells. (A) Phase contrast micrographs of cells plated at indicated densities in 35-mm plates and imaged after 24 hours. Scale bar 200 μm. (B) Area of cells at indicated densities (n > 20 for each condition; values displayed as means ± SEM; ANOVA P < 0.001 for trend). (C–E) Quantitative PCR assessment of E-cadherin (C; ANOVA P = 0.042 for trend), N-cadherin (D; ANOVA P = 0.12 for trend), and vimentin (E; ANOVA P < 0.001 for trend) expression in the cell cultures.
Transcriptional profiling of the MCF10A cells identified a large number of genes that were substantially regulated by cell density: 1444 probes (mapped to 1131 genes) were upregulated more than two-fold in 800K density relative to 50K density (Fig. 2A and B) and 1658 probes (mapped to 1303 genes) were downregulated more than two-fold in 800K density relative to 50K density (Fig. 2C and D). Meta-analysis of the MCF10A gene set using the NextBio platform revealed significant overlap with numerous cancer-associated datasets (Table 1), including lung cancer, liver cancer, and breast cancer. The negative association of the MCF10A dataset (comparing 800K density vs 50K density) with most cancer datasets indicates that lower cell density is more associated with cancer as compared with the normal tissue. Examination of overlap with individual datasets (Table 2) revealed significant negative correlation between the MCF10A dataset and gene sets comparing breast cancer vs normal breast tissue,41–46 particularly when the breast cancers were of the basal molecular subtype. This finding suggests that the MCF10A cells, which are immortal and nontransformed but which are classified as basal-type breast cancer cells,13,47 activate basal-type cancer characteristics at lower cell densities. The MCF10A dataset also showed significant negative overlap with comparisons of breast cancer cell lines, including MCF10A cells expressing activated ErbB2 vs control vector,48 the transformed MDA-MB-231, MCF-7 and T47D breast cancer cell lines vs MCF10A cells,49 and the MDA-MB-231 cells vs M98040 normal breast cells.50 With regard to the highly significant overlap (P = 1.9E − 184) with the dataset comparing MDA-MB-231 cells vs MCF10A cells, it was striking that the majority of the 2385 overlapping gene features showed a negative correlation (Fig. 2E), indicating that more than 2/3 of the transcriptional alterations induced by low density cultivation of MCF10A cells overlapped significantly with MDA-MB-231 cells. Comparison of the dataset of density-dependent gene expression changes in MCF10A cells with clinical datasets examining differences between breast cancers of different intrinsic subtypes identified signifi-cant overlap with four datasets comparing basal subtype breast cancers with normal breast tissue (Supplementary Fig. 1A, P = 1.6E − 65, ref.42; Supplementary Fig. 1B, P = 15.0E − 63, ref. 51; Supplementary Fig. 1C, P = 1.2E − 28, ref.52; and Supplementary Fig. 1D, P = 1.6E − 48, ref.53). We also identified significant overlap with a dataset comparing basal subtype breast cancer vs normal subtype breast cancer (Supplementary Fig. 1E, P = 2.2E − 25, ref.52), and another dataset comparing breast cancer cell lines of the basal B subtype vs basal A subtype (Supplementary Fig. 1F, P = 3.7E − 54, ref.54). The direction of association indicates that MCF10A cells plated at low density manifest an increasing association with basal subtype breast cancer.
Figure 2.
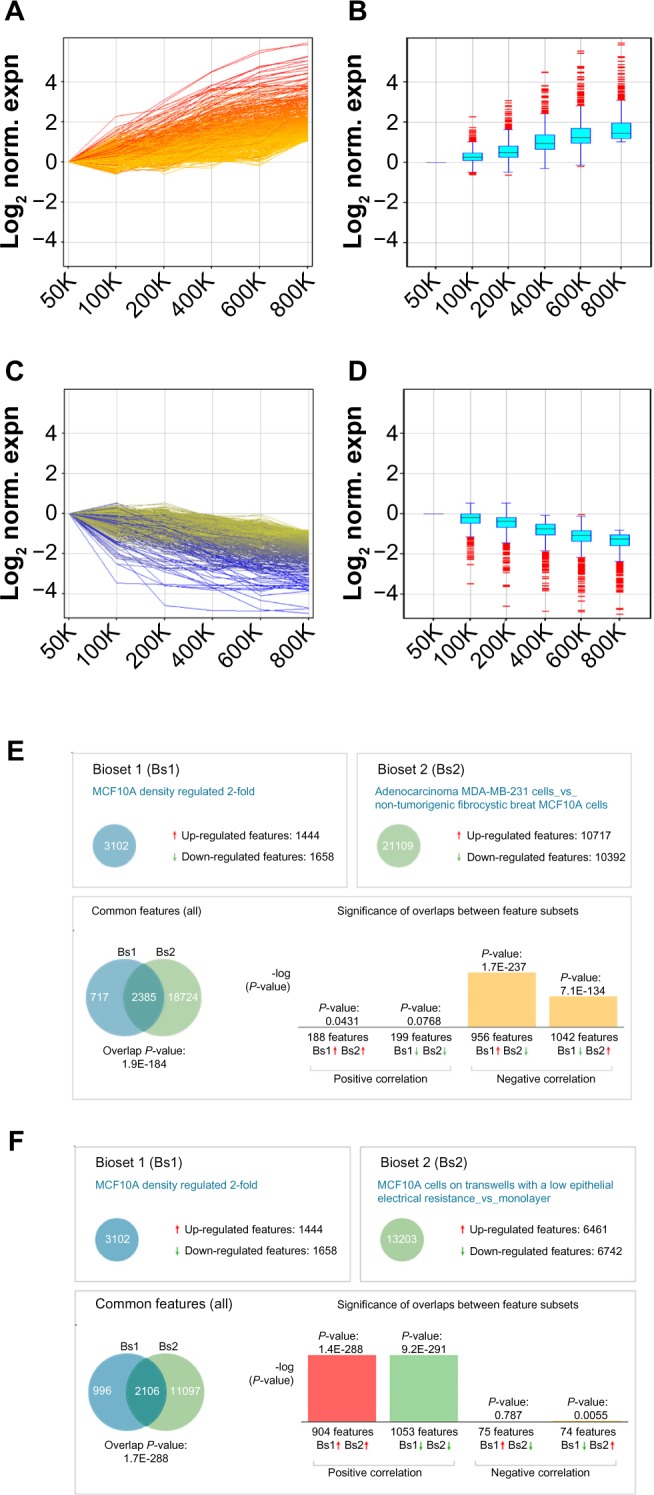
Analysis of genes differentially expressed by density in MCF10A cells. (A–D) Genes upregulated more than two-fold in cells cultured at 800K density vs 50K density (A and B; n = 1444 features mapped to 1131 genes) or downregulated more than two-fold in cells cultured at 800K density vs 50K density (C and D; n = 1658 features mapped to 1303 genes); all genes are normalized to 50K expression and displayed as line graphs (A and C; colored by expression at 800K) or box-and-whisker plots (B and D). (E and F) Overlap of dataset of genes differentially regulated two-fold in MCF10A cells cultured at 800K density vs 50K density with datasets of genes differentially regulated between MDA-MB-231 cells and MCF10A cells (showing negative correlation; E) and of genes differentially regulated between MCF10A cells cultured on differentiating conditions vs 2D monolayers (showing positive correlation; F).
Table 1.
Overlap of cancer-related gene sets with gene set comparing MCF10A cells cultured at 800K density vs 50K density.
| CANCER SUBTYPE | OVERLAP SCORE | # STUDIES | CORRELATION |
|---|---|---|---|
| Malignant tumor of hypopharynx | 86.44 | 1 | negative |
| Cancer of head and neck | 78.95 | 21 | negative |
| Kidney cancer | 78.40 | 31 | negative |
| Esophageal cancer | 77.82 | 16 | negative |
| Lung cancer | 77.75 | 69 | negative |
| Liver cancer | 77.10 | 64 | negative |
| Adrenal cancer | 76.83 | 7 | negative |
| Gastric cancer | 75.71 | 27 | negative |
| Breast cancer | 74.10 | 83 | negative |
| Brain cancer | 73.29 | 57 | negative |
| Neuroendocrine tumor | 73.12 | 19 | negative |
| Other cancer | 70.54 | 60 | negative |
| Malignant tumor of muscle | 70.33 | 21 | negative |
| Skin cancer | 70.09 | 27 | negative |
| Malignant tumor of intestine | 69.39 | 83 | negative |
| T-cell lymphoma | 68.55 | 9 | negative |
| Secondary neoplastic disease | 67.43 | 55 | negative |
| Bladder cancer | 66.37 | 22 | positive |
| Pancreatic cancer | 64.82 | 22 | negative |
| Uterine cancer | 64.58 | 13 | negative |
| Lymphoid leukemia | 63.16 | 32 | negative |
| Myeloid leukemia | 62.95 | 31 | positive |
| Ovarian cancer | 62.87 | 27 | positive |
| Multiple myeloma/plasmacytoma | 61.41 | 12 | positive |
| Prostate cancer | 60.76 | 38 | negative |
| Other lymphoma | 59.74 | 12 | negative |
| Primary malignant neoplasm of bone | 58.32 | 13 | negative |
| B-cell lymphoma | 56.44 | 16 | negative |
| Thyroid cancer | 54.84 | 11 | positive |
| Testicular cancer | 53.10 | 7 | positive |
| Other leukemia | 52.32 | 3 | negative |
| Cancer of thymus | 51.47 | 2 | negative |
| Malignant tumor of pituitary gland | 28.64 | 2 | negative |
| Retinoblastoma | 21.81 | 1 | positive |
Table 2.
Meta-analysis reveals overlap of gene set comparing MCF10A cells cultured at 800K density vs 50K density with studies of breast cancer, breast cancer cell lines, cellular differentiation, and EMT.
| OVERLAP WITH GENESET COMPARING BREAST CANCER WITH NORMAL TISSUE | |||
|---|---|---|---|
| STUDY NAME | P-VALUE | DIRECTION | REF |
| Basal-like tumors vs normal tissue | 2.60E-73 | negative | 41 |
| Basal molecular subtype vs normal tissue | 1.60E-75 | negative | 42 |
| Breast tumor ER-negative vs adjacent normal breast | 1.30E-41 | negative | 43 |
| Invasive ductal carcinoma vs normal breast ducts | 7.30E-34 | negative | 44 |
| Basal molecular subtype vs normal breast | 4.30E-28 | negative | 45 |
| Basal-like subtype vs normal breast tissue | 3.30E-23 | negative | 46 |
| OVERLAP WITH GENESETS COMPARING BREAST CANCER CELL LINES | |||
| STUDY NAME | P-VALUE | DIRECTION | REF |
| MCF10A overexpressing ErbB2 vs control vector | 7.50E-216 | negative | 48 |
| MDA-MB-231 cells vs MCF10A cells | 1.90E-184 | negative | 49 |
| MCF-7 cells vs MCF10A cells | 3.00E-93 | negative | 49 |
| T47D cells vs MCF10A cells | 2.80E-90 | negative | 49 |
| MDA-MB-231 cells vs M98040 normal breast cells | 1.50E-137 | negative | 50 |
| COMPARISON WITH GENESETS OF MCF-7 CELLS TREATED WITH ESTRADIOL OR ENDOCRINE INHIBITORS | |||
| STUDY NAME | P-VALUE | DIRECTION | REF |
| MCF-7 cells treated 48h fulvestrant vs control | 4.20E-140 | positive | 60 |
| MCF-7 cells treated 48h fulvestrant vs control | 3.70E-128 | positive | 59 |
| MCF-7 cells treated 24h estradiol vs control | 3.40E-130 | negative | 57 |
| MCF-7 cells treated 24h estradiol vs control | 1.70E-123 | negative | 56 |
| MCF-7 cells treated 24h estradiol vs control | 1.70E-120 | negative | 55 |
| MCF-7 cells treated 48h bisphenol vs control | 3.40E-115 | negative | 58 |
| OVERLAP WITH GENESETS EVALUATING DIFFERENTIATION OF CULTURED CELLS | |||
| STUDY NAME | P-VALUE | DIRECTION | REF |
| MCF10A differentiating on transwells vs 2D | 1.70E-288 | positive | 62 |
| Bronchial epithelial cells in 3D vs 2D | 1.70E-111 | positive | 63 |
| RWPE-1 prostate epithelial cells 3D vs 2D | 2.20E-145 | positive | 64 |
| Adipocytes differentiating in 3D vs preadipocytes | 4.80E-42 | positive | 66 |
| Lung cancer cell lines in 3D vs 2D | 1.80E-28 | positive | 65 |
| OVERLAP WITH STUDIES OF EMT | |||
| STUDY NAME | P-VALUE | DIRECTION | REF |
| MCF10A TGFb vs untreated | 2.40E-78 | negative | 67 |
| MCF10A ionizing radiation and TGFb vs untreated | 2.80E-62 | negative | 68 |
| Panc1 pancreatic cancer cells TGFb vs untreated | 1.50E-58 | negative | 69 |
| A549 lung adenocarcinoma cells TGFb vs untreated | 4.50E-55 | negative | 70 |
| HK2 human kidney epithelial cells TGFb vs untreated | 5.60E-33 | negative | 71 |
| Breast cancer cell lines-epithelial-like vs fibroblast-like | 1.20E-23 | positive | 72 |
| NMuMG mammary cells TGFb vs untreated | 2.70E-11 | negative | 73 |
The MCF10A dataset showed significant negative overlap with datasets comparing MCF-7 breast cancer cells treated with estradiol55–57 or the estrogenic compound bisphenol,58 and significant positive overlap with MCF-7 cells treated with the estrogen receptor (ER) downregulator fulvestrant,59,60 consistent with the identification of EMT-inducing characteristics of estrogen signaling in the ER-positive MCF-7 cell line.61 The MCF10A dataset also showed significant positive overlap with datasets comparing cell lines cultured under differentiating conditions, including MCF10A cells cultured on transwells vs tissue culture plastic62 (P = 1.7E − 288, with 2106 overlapping gene features; Fig. 2F), bronchial epithelial cells, RWPE-1 prostate epithelial cells, or lung cancer cell lines cultured in 3D Matrigel vs tissue culture plastic,63–65 and cultured adipocytes compared with preadipocytes.66 Similar strong overlap was found between the MCF10A dataset and gene sets from experiments examining transcriptional changes induced by EMT.67–73 These findings indicate that cell density affects extensive transcriptional programs associated with malignancy, differentiation, and EMT in MCF10A cells.
Cell density and MMP-3 control overlapping transcriptional programs in SCp2 cells
To dissect the differential effects of cell density and external stimuli on induction of EMT, we cultured SCp2 mouse mammary epithelial cells at differing densities with MMP-3 (Fig. 3). Because MMP-3-induced EMT requires cell spreading,25 we selected a range of cell densities that would allow for sufficient cell spreading at even the highest seeding density (Fig. 3). Evaluation of transcriptional profiles identified 7056 genes that were more than two-fold differentially expressed in response to MMP-3 (50K control vs 50K MMP-3 and 250K control vs 250K MMP-3) or in response to cell density (250K control vs 50K control). To begin to dissect the differential signaling pathways activated in response to cell density and MMP-3, transcriptional profiles of these differentially expressed genes were clustered using a K-means algorithm into eight groups (Fig. 4). We initially assessed K-means classification into 2, 4, 8, and 12 clusters. One of the endpoints we wished to pursue was the meta-analysis using NextBio, and we found that the classification into eight groups provided the most manageable number of genes for analysis using this utility. In the first two groups (Fig. 4A and B), genes showed regulation by both cell density and by MMP-3. These groups were enriched with genes associated with cell–cell and cell–ECM adhesion and interaction (Table 1, Supplementary Tables 1–3), including the gene encoding C/EBPβ, a key regulator of epithelial cell differentiation and proliferation in mammary branching morphogenesis74,75 and in the morphogenic response to epimorphin in mammary epithelial cells,76–80 as well as the gene encoding the connective tissue growth factor (CTGF), a key regulator of EMT and a mediator of the earliest stages of breast cancer development.81–83 In the second two groups (Fig. 4C and D), gene expression differences were primarily associated with cell density and less affected by the presence or absence of MMP-3. These groups were enriched with genes associated with cellular biogenesis and metabolic processes (Table 1, Supplementary Tables 1–3), including the gene encoding RAB40B, which trafficks MMPs to the invadopodia during breast cancer cell invasion, and the gene encoding SERPINB2/PAI2, which regulates cellular interactions with the ECM.84,85 The third set of gene expression groups included genes that were primarily regulated by MMP-3 (Fig. 4E and F). These groups were enriched with genes associated with cell division and organization (Table 1, Supplementary Tables 1–3), including genes known to be regulated by MMP-3.35 Comparison of the set of genes regulated by density in MCF10A cells showed significant overlap with subgroups A–F, with expected directionality of correlation: positive for clusters A–D and negative for clusters E and F (Supplementary Fig. 2). No significant overlap was found between the genes regulated by density in MCF10A cells and clusters G and H (data not shown).
Figure 3.

Effects of MMP-3 treatment on SCp2 mouse mammary epithelial cells cultured at different cell densities. Either 50K (top row), 100K (middle row), or 250K (bottom row) SCp2 cells were plated in 35-mm plates, and then treated as controls (left column) or with MMP-3 (middle column). Cell area measurements indicate significantly increased cell spreading with MMP-3 treatment at all three densities (right column). Scale bars, 250 μm in large views and 50 μm in insets.
Figure 4.

Clustering of genes differentially regulated by density and by MMP-3 treatment in SCp2 cells. (A–H) Differentially expressed genes (n = 7056) in the SCp2 dataset were identified as FC > 2 in any of 50K control vs 50K MMP-3, 250K control vs 250K MMP-3, or 50K control vs 250K control. K-means clustering was performed on the SCp2 differentially regulated gene set using eight groups, Pearson-centered similarity measure, and 1000 iterations. The eight-derived clusters could be generally identified as genes upregulated by density and downregulated by MMP-3 (n = 626; A), genes downregulated by density and upregulated by MMP-3 (n = 806; B), genes upregulated by density and little affected by MMP-3 (n = 517; C), genes downregulated by density and little affected by MMP-3 (n = 801; D), genes upregulated by MMP-3 and little affected by density (n = 923; E), genes downregulated by MMP-3 and little affected by density (n = 572; F), genes upregulated by density in the absence of MMP-3 and unregulated by density in the presence of MMP-3 (n = 1528; G), and genes downregulated by density in the absence of MMP-3 and unregulated by density in the presence of MMP-3 (n = 1283; H). For each cluster, the associated genes are shown as a line graph (left panel) and as a box-and-whisker plot (center panel), and expression data for a representative gene from each cluster are shown in the right panel (boxes indicate variation in replicated experiments for 50K, 100K, and 250K).
Regulation of Rac1b splicing by cell density and MMP-3
The final two gene groups identified by the K-means clustering contained genes that were regulated by density in the absence of MMP-3, but less regulated by density in the presence of MMP-3 (Fig. 4G and H), an effect that could be induced if the protein(s) acting as sensors of cellular density for regulation of these genes was cleaved or blocked by MMP-3. These groups were enriched with genes encoding splicing factors (Table 1, Supplementary Tables 1–3). Evaluation of genes with these characteristics and annotated as associated with RNA processing revealed 56 gene features (mapped to 37 genes) that were upregulated by cell density in the absence of MMP-3 (Fig. 5A–C) and 80 gene features (mapped to 56 genes) that were downregulated by cell density in the absence of MMP-3 (Fig. 5D–F). Strikingly, these genes included HNRNPA1, which encodes a splicing factor that inhibits EMT86,87 and that is known to regulate the induction of Rac1b in mouse mammary and lung epithelial cells exposed to MMP-3.32,88 Analysis of HNRNPA1 expression data in the SCp2 cell experiments revealed substantial density-dependent differences in untreated cells, but relatively similar levels in MMP-3-treated cells (Fig. 6A). Consistent with the role of hnRNPA1 as a repressor of exon 3b inclusion,88 expression of Rac1b in the same samples decreased in the untreated samples as a function of density, while the levels of MMP-3-induced Rac1b remained constant (Fig. 6B). Other splicing factors contained in the density-regulated/MMP-inhibited gene clusters have been implicated in other studies to influence Rac1b inclusion, including SRSF1 (ASF/SF2), which acts to increase inclusion of exon 3b89 and which was downregulated by density in the absence of MMP-3, but maintained higher expression levels in the presence of MMP-3 (Fig. 5E). Furthermore, while expression levels of HNRNPA1 were undetectable in the MCF10A cells (data not shown), we did find that density-dependent differences in the expression of ESRP1 and ESRP2 (Fig. 6C), which encode splicing factors that have been shown to regulate exon 3b inclusion in human oral squamous carcinoma cells,90 were also associated with density-dependent differences in the expression of Rac1b (Fig. 6D).
Figure 5.
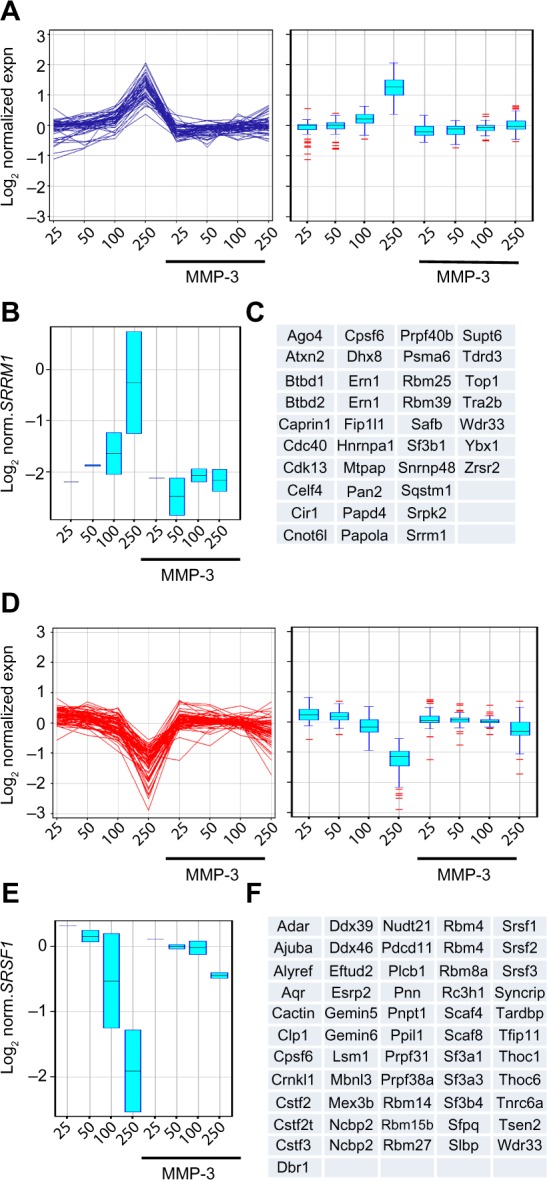
Enrichment of mRNA processing genes in clusters of genes regulated by only density in the absence of MMP-3. (A–C) Genes upregulated by density in the absence of MMP-3 and unregulated by density in the presence of MMP-3 annotated in Gene Ontology as associated with mRNA processing (n = 56 features mapped to 37 genes). (D–F) Genes downregulated by density in the absence of MMP-3 and unregulated by density in the presence of MMP-3 annotated in Gene Ontology as associated with mRNA processing (n = 80 features mapped to 56 genes). Gene sets are displayed as line graphs (left) and box-and-whisker plots (right; A and D). Expression data for a representative gene from each cluster are shown (B and E; boxes indicate variation in replicated experiments for 50K, 100K, and 250K). The list of each gene set is displayed (C and F).
Figure 6.

Density-dependent differences in expression of gene splicing factors and Rac1b in SCp2 and MCF10A cells. (A) Expression in SCp2 cells of the gene encoding hnRNPA1, known to inhibit expression of Rac1b, according to cell density and MMP-3 treatment (gene expression from normalized microarray data, scaled to 50K control, and displayed as means ± SEM; ANOVA P = 0.0575 for trend in control; P = ns for trend in MMP-3 treated). (B) Expression in SCp2 cells of Rac1b according to cell density and MMP-3 treatment (gene expression from QPCR, normalized to GAPDH and scaled to 50K control, and displayed as means ± SEM; ANOVA P = 0.0475 for trend in control; P = ns for trend in MMP-3 treated). (C) Expression in MCF10A cells of genes encoding ESRP1, known to inhibit expression of Rac1b and ESRP2, according to cell density (gene expression from normalized microarray data, scaled to 50K control). (D) Expression in MCF10A cells of Rac1b according to cell density treatment (gene expression from QPCR, normalized to GAPDH and scaled to 50K control, and displayed as means ± SEM; ANOVA P < 0.001 for trend).
Discussion
Here we showed that the regulation of the EMT program by cell contact is a highly conserved process, with many similar transcriptional alterations found in mouse and human cells cultured at differing cell densities (Supplemental Fig. 1). We also found that the density-dependent, EMT-associated changes were a component of a larger cancer-related gene program, as cultivation of MCF10A human breast epithelial cells at low density activated many of the transcriptional features of breast cancer, while cultivation at high density activated transcriptional features of differentiated cells (Fig. 2E and F, Tables 1 and 2). We found that cell density and MMP-3 affected distinct transcriptional alterations in SCp2 mouse mammary cells (Fig. 4C–F) and regulated others in tandem (Fig. 4A and B). We also made the unexpected findings that MMP-3 treatment affects the transcription of a cluster of genes that is regulated by cell density (Fig. 4G and H) and that this cluster is enriched in genes encoding RNA processing proteins (Fig. 5, Table 3, Supplemental Tables 1–3), including the RNA splicing factors that regulate expression of Rac1b, the key mediator of MMP-3-induced EMT, under the same conditions (Fig. 6). These results provide insights into the common processes by which cell contact affects cellular phenotype and sensitivity to induction of EMT and how these processes may be integrated in the development of breast cancer.
Table 3.
Themes of biogroups enriched in the clusters from the SCp2 experiment (extended lists of biogroups and P-values in Supplementary Tables 1–3).
| GENES REGULATED BY BOTH DENSITY AND MMP-3 |
|---|
| Canonical pathways: Cell-cell and cell-ECM adhesion/interaction |
| Regulatory motifs: NFAT, NFkB, miR-23 |
| Gene Ontologies: Cell locomotion, migration, and motility |
| GENES PRIMARILY REGULATED BY DENSITY |
| Canonical pathways: Cell cycle regulation/mitosis G1/S transition |
| regulatory motifs: MYC, E2F |
| Gene Ontologies: Cellular biogenesis and metabolic processes |
| GENES PRIMARILY REGULATED BY MMP-3 |
| Canonical pathways: Cell cycle regulation/mitosis M/G1 transition |
| Regulatory motifs: E2F, STAT1, IRF-1 |
| Gene Ontologies: Cell division and cellular component organization |
| GENES WITH REGULATION BY DENSITY THAT IS BLOCKED BY MMP-3 |
| Canonical pathways: Splicing factors; TNF, EGF, and WNT pathway |
| Regulatory motifs: miR-19, miR-27, miR-200, miR-429, SP1, LEF1 |
| Gene Ontologies: Regulation of RNA biosynthetic processes |
Alternative splicing allows individual genes to take on multiple, often opposing, functions.91,92 Differential regulation of splice isoform expression of many genes is a feature of cancer development and progression, as cancer cells preferentially express many different splice isoforms that can block anticancer apoptotic mechanisms, drive glycolytic metabolism, induce angiogenesis, and stimulate invasion through induction of EMT.91,93,94 While some cancer-associated mutations have been found to directly affect the expression of physiologically relevant splice isoforms, the majority of alternative splicing events in cancer are because of alterations in the splicing process itself.92 Splicing is controlled through the action of the spliceosome, a large ribonucleoprotein (RNP) complex that selects which pre-mRNA sequences will be retained or excluded. The classical regulators of alternative splicing include the serine/arginine-rich (SR) proteins, which generally promote exon inclusion, and the heterogeneous RNPs (hnRNPSs), which generally promote exon exclusion.91 Of the SR proteins, ESRP1/2 have been a particular target of study for their role in facilitating the EMT program95: differential activity of ESRP1/2 affects EMT through alternative splicing of FGFR1,96 hMena,97,98 p120-catenin,96 fibronectin,95 and Rac1b.89,90,99–101 Of the hnRNP proteins, hnRNPA1 has been focused on as a mediator of EMT processes87 and has been identified as specifically involved in the regulation of Rac1b by MMP-3.88 We found here that cell contact regulated ESRP1/2 and hnRNPA1 expression in MCF10A and SCp2 cells, and that this regulation was affected by the presence of MMP-3 (Fig. 6). We also identified a number of other genes encoding RNA processing proteins whose expression was regulated by cell density and by MMP-3 (Figs. 4G, H and 5). How differences in cell density affect these processes, and the role of MMP-3 in their abrogation, is unclear. Differences in cell density and exposure to MMP-3-containing conditioned media have been previously observed to regulate alternative splicing of the fibronectin mRNA in SCp2 cells,102 which supports the idea that the effects observed here may reflect a larger phenomenon. Additionally, cell density has been found to control nonsense-mediated decay of the splicing factor ASF/SF2 (SRSF1),103 although whether this process is regulating the observed differences in splicing factors contained in clusters G and H (Figs. 4G, H and 5) is unknown.
Rac1, like other members of the Ras superfamily, is a GTPase that cycles between a GDP-bound inactive form and a GTP-bound active form. Rac1b was originally identified in colorectal and breast tumors as an alternatively spliced transcript containing the 57-nucleotide exon 3b, resulting in a 19-amino acid in-frame insertion in the Rac1b protein sequence.104 Rac1b was found to have greatly reduced intrinsic GTPase activity and accelerated GDP–GTP exchange; the 19-amino acid insertion also led to altered association with Rac1 effector proteins.105–107 Rac1b was subsequently identified as a critical effector of MMP-3-induced EMT in SCp2 cells: MMP-3-induced Rac1b induces elevated levels of cellular ROS, which drive EMT and genomic instability.3,28,29,108 Further studies have revealed MMP-3-induced Rac1b and consequent EMT processes in lung and pancreas as well.30,32–34,109 In addition to the expected upregulation of Rac1b by MMP-3 in the SCp2 cells, we also found that Rac1b was upregulated at lower cell density in both the SCp2 and the MCF10A cells (Fig. 6B and D), conditions under which the MCF10A cells showed strong overlap with breast cancer cell lines and tumor biopsies (Table 2). These results support the possibility of inhibition of Rac1b as a therapeutic approach for breast cancer.110 EHT164 is an inhibitor of Rac1 family of GTPases that has selectivity toward Rac1b111,112 and that has been found to inhibit estrogen-dependent breast cancer cell proliferation in culture models,113 although the effects of this compound in clinical settings remain to be evaluated.
In summary, we have found that cell contact regulates a broad transcriptional program that is conserved between mouse and man and that is highly relevant to the transition from the differentiated state to malignancy. We also found that MMP-3 induces EMT by interfering with the density-dependent regulation, causing the cells to retain their cancer-like transcriptional state even at higher cell density. These results point toward loss of cell contact as a critical step in the activation of the EMT program in the development of breast cancer.
Supplementary Materials
Supplementary Table 1. Broad MSigDB - Canonical Pathways for SCp2 cell experiment.
Supplementary Table 2. Broad MSigDB - Regulatory Motifs for SCp2 cell experiment.
Supplementary Table 3. Gene Ontology (GO) for SCp2 cell experiment.
Supplementary Figure 1. Meta-analysis of datasets showing overlap of density-dependent gene expression changes in MCF10A cells with biosets comparing breast cancer of basal subtype vs other subtypes. In each panel, Bioset 1 is the list of genes upregulated or downregulated more than two-fold in cells cultured at 800K density vs 50K density (n = 3102 features mapped to 2434 genes). (A–D) Overlap with biosets comparing breast tumors of the basal subtype vs normal breast tissue (A42, B51, C52, and D53). (E) Overlap with bioset comparing breast tumors of basal subtype vs normal-like subtype.52 (F) Overlap with bioset comparing breast cancer cell lines derived from basal B subtype vs basal A subtype tumors.54
Supplementary Figure 2. Overlap of genes regulated by density in MCF10A and by MMP-3 in SCp2 cells. Significant overlap of genes upregulated in MCF10A cells at 800K vs 50K (left column) or genes downregulated in MCF10A cells at 800K vs 50K (right column) with genes regulated by both density and MMP-3 (top row; comparison shown for genes regulated in 50K control vs 50K MMP-3), with genes regulated primarily by density (middle row; comparison shown for genes regulated in 250K control vs 50K control), and with genes regulated primarily by MMP-3 (bottom row; comparison shown for genes regulated in 50K control vs 50K MMP-3).
Footnotes
Author Contributions
Conceived and designed the experiments: MAC, DCR. Analyzed the data: MAC, DCR. Wrote the first draft of the manuscript: MAC, DCR. Contributed to the writing of the manuscript: MAC, CMN, DCR. Agree with manuscript results and conclusions: MAC, CMN, DCR. Jointly developed the structure and arguments for the paper: MAC, CMN, DCR. Made critical revisions and approved the final version: MAC, CMN, DCR. All authors reviewed and approved of the final manuscript.
ACADEMIC EDITOR: J.T. Efird, Editor in Chief
FUNDING: This work was supported by the Susan B. Komen Foundation (KG110542) and the Mayo Clinic Breast Cancer SPORE (CA116201) as well as by NIH GM083997, HL110335, HL118532, HL120142, NSF CMMI-1435853, the David and Lucile Packard Foundation, the Alfred P. Sloan Foundation, and the Camille & Henry Dreyfus Foundation. CMN holds a Career Award at the Scientific Interface from the Burroughs Wellcome Fund. The authors confirm that the funders had no influence over the study design, content of the article, or selection of this journal.
COMPETING INTERESTS: Authors disclose no potential conflicts of interest.
Paper subject to independent expert blind peer review by minimum of two reviewers. All editorial decisions made by independent academic editor. Upon submission manuscript was subject to anti-plagiarism scanning. Prior to publication all authors have given signed confirmation of agreement to article publication and compliance with all applicable ethical and legal requirements, including the accuracy of author and contributor information, disclosure of competing interests and funding sources, compliance with ethical requirements relating to human and animal study participants, and compliance with any copyright requirements of third parties. This journal is a member of the Committee on Publication Ethics (COPE).
REFERENCES
- 1.Yang J, Weinberg RA. Epithelial-mesenchymal transition: at the crossroads of development and tumor metastasis. Dev Cell. 2008;14:818–29. doi: 10.1016/j.devcel.2008.05.009. [DOI] [PubMed] [Google Scholar]
- 2.Micalizzi DS, Farabaugh SM, Ford HL. Epithelial-mesenchymal transition in cancer: parallels between normal development and tumor progression. J Mammary Gland Biol Neoplasia. 2010;15:117–34. doi: 10.1007/s10911-010-9178-9. [DOI] [PMC free article] [PubMed] [Google Scholar]
- 3.Radisky DC, Kenny PA, Bissell MJ. Fibrosis and cancer: do myofibroblasts come also from epithelial cells via EMT? J Cell Biochem. 2007;101:830–9. doi: 10.1002/jcb.21186. [DOI] [PMC free article] [PubMed] [Google Scholar]
- 4.Kalluri R. EMT: when epithelial cells decide to become mesenchymal-like cells. J Clin Invest. 2009;119:1417–9. doi: 10.1172/JCI39675. [DOI] [PMC free article] [PubMed] [Google Scholar]
- 5.Yilmaz M, Christofori G. EMT, the cytoskeleton, and cancer cell invasion. Cancer Metastasis Rev. 2009;28:15–33. doi: 10.1007/s10555-008-9169-0. [DOI] [PubMed] [Google Scholar]
- 6.Derynck R, Muthusamy BP, Saeteurn KY. Signaling pathway cooperation in TGF-beta-induced epithelial-mesenchymal transition. Curr Opin Cell Biol. 2014;31C:56–66. doi: 10.1016/j.ceb.2014.09.001. [DOI] [PMC free article] [PubMed] [Google Scholar]
- 7.Infanger DW, Lynch ME, Fischbach C. Engineered culture models for studies of tumor-microenvironment interactions. Annu Rev Biomed Eng. 2013;15:29–53. doi: 10.1146/annurev-bioeng-071811-150028. [DOI] [PMC free article] [PubMed] [Google Scholar]
- 8.Debnath J, Muthuswamy SK, Brugge JS. Morphogenesis and oncogenesis of MCF-10 A mammary epithelial acini grown in three-dimensional basement membrane cultures. Methods. 2003;30:256–68. doi: 10.1016/s1046-2023(03)00032-x. [DOI] [PubMed] [Google Scholar]
- 9.Muthuswamy SK, Li D, Lelievre S, Bissell MJ, Brugge JS. ErbB2, but not ErbB1, reinitiates proliferation and induces luminal repopulation in epithelial acini. Nat Cell Biol. 2001;3:785–92. doi: 10.1038/ncb0901-785. [DOI] [PMC free article] [PubMed] [Google Scholar]
- 10.Gilles C, Polette M, Zahm JM, et al. Vimentin contributes to human mammary epithelial cell migration. J Cell Sci. 1999;112(pt 24):4615–25. doi: 10.1242/jcs.112.24.4615. [DOI] [PubMed] [Google Scholar]
- 11.Kim ES, Kim MS, Moon A. TGF-beta-induced upregulation of MMP-2 and MMP-9 depends on p38 MAPK, but not ERK signaling in MCF10 A human breast epithelial cells. Int J Oncol. 2004;25:1375–82. [PubMed] [Google Scholar]
- 12.Seton-Rogers SE, Lu Y, Hines LM, et al. Cooperation of the ErbB2 receptor and transforming growth factor beta in induction of migration and invasion in mammary epithelial cells. Proc Natl Acad Sci U S A. 2004;101:1257–62. doi: 10.1073/pnas.0308090100. [DOI] [PMC free article] [PubMed] [Google Scholar]
- 13.Sarrió D, Rodriguez-Pinilla SM, Hardisson D, Cano A, Moreno-Bueno G, Palacios J. Epithelial-mesenchymal transition in breast cancer relates to the basal-like phenotype. Cancer Res. 2008;68:989–97. doi: 10.1158/0008-5472.CAN-07-2017. [DOI] [PubMed] [Google Scholar]
- 14.Boyer B, Thiery JP. Cyclic AMP distinguishes between two functions of acidic FGF in a rat bladder carcinoma cell line. J Cell Biol. 1993;120:767–76. doi: 10.1083/jcb.120.3.767. [DOI] [PMC free article] [PubMed] [Google Scholar]
- 15.Cichon MA, Radisky DC. Extracellular matrix as a contextual determinant of transforming growth factor-b signaling in epithelial-mesenchymal transition and in cancer. Cell Adh Migr. 2014 Oct 16;:0. doi: 10.4161/19336918.2014.972788. [Epub ahead of print] [DOI] [PMC free article] [PubMed] [Google Scholar]
- 16.Massague J. TGFbeta signalling in context. Nat Rev Mol Cell Biol. 2012;13:616–30. doi: 10.1038/nrm3434. [DOI] [PMC free article] [PubMed] [Google Scholar]
- 17.Nistico P, Bissell MJ, Radisky DC. Epithelial-mesenchymal transition: general principles and pathological relevance with special emphasis on the role of matrix metalloproteinases. Cold Spring Harb Perspect Biol. 2012;4:a011908. doi: 10.1101/cshperspect.a011908. [DOI] [PMC free article] [PubMed] [Google Scholar]
- 18.Radisky ES, Radisky DC. Matrix Metalloproteinases as drivers and therapeutic targets in breast cancer. Front Biosci. 2014;14:472. doi: 10.2741/4364. [DOI] [PMC free article] [PubMed] [Google Scholar]
- 19.Chen QK, Lee K, Radisky DC, Nelson CM. Extracellular matrix proteins regulate epithelial-mesenchymal transition in mammary epithelial cells. Differentiation. 2013;86:126–32. doi: 10.1016/j.diff.2013.03.003. [DOI] [PMC free article] [PubMed] [Google Scholar]
- 20.Alexander CM, Selvarajan S, Mudgett J, Werb Z. Stromelysin-1 regulates adipogenesis during mammary gland involution. J Cell Biol. 2001;152:693–703. doi: 10.1083/jcb.152.4.693. [DOI] [PMC free article] [PubMed] [Google Scholar]
- 21.Sympson CJ, Talhouk RS, Alexander CM, et al. Targeted expression of stromelysin-1 in mammary gland provides evidence for a role of proteinases in branching morphogenesis and the requirement for an intact basement membrane for tissue-specific gene expression. J Cell Biol. 1994;125:681–93. doi: 10.1083/jcb.125.3.681. [DOI] [PMC free article] [PubMed] [Google Scholar]
- 22.Sternlicht MD, Lochter A, Sympson CJ, et al. The stromal proteinase MMP3/stromelysin-1 promotes mammary carcinogenesis. Cell. 1999;98:137–46. doi: 10.1016/s0092-8674(00)81009-0. [DOI] [PMC free article] [PubMed] [Google Scholar]
- 23.Sympson CJ, Bissell MJ, Werb Z. Mammary gland tumor formation in transgenic mice overexpressing stromelysin-1. Semin Cancer Biol. 1995;6:159–63. doi: 10.1006/scbi.1995.0022. [DOI] [PMC free article] [PubMed] [Google Scholar]
- 24.Boghaert E, Gleghorn JP, Lee K, Gjorevski N, Radisky DC, Nelson CM. Host epithelial geometry regulates breast cancer cell invasiveness. Proc Natl Acad Sci U S A. 2012;109:19632–7. doi: 10.1073/pnas.1118872109. [DOI] [PMC free article] [PubMed] [Google Scholar]
- 25.Nelson CM, Khauv D, Bissell MJ, Radisky DC. Change in cell shape is required for matrix metalloproteinase-induced epithelial-mesenchymal transition of mammary epithelial cells. J Cell Biochem. 2008;105:25–33. doi: 10.1002/jcb.21821. [DOI] [PMC free article] [PubMed] [Google Scholar]
- 26.Radisky DC, Nelson CM. Regulation of mechanical stress by mammary epithelial tissue structure controls breast cancer cell invasion. Oncotarget. 2013;4:498–9. doi: 10.18632/oncotarget.979. [DOI] [PMC free article] [PubMed] [Google Scholar]
- 27.Lochter A, Galosy S, Muschler J, Freedman N, Werb Z, Bissell MJ. Matrix metalloproteinase stromelysin-1 triggers a cascade of molecular alterations that leads to stable epithelial-to-mesenchymal conversion and a premalignant phenotype in mammary epithelial cells. J Cell Biol. 1997;139:1861–72. doi: 10.1083/jcb.139.7.1861. [DOI] [PMC free article] [PubMed] [Google Scholar]
- 28.Lee K, Chen QK, Lui C, Cichon MA, Radisky DC, Nelson CM. Matrix compliance regulates Rac1b localization, NADPH oxidase assembly, and epithelial-mesenchymal transition. Mol Biol Cell. 2012;23:4097–108. doi: 10.1091/mbc.E12-02-0166. [DOI] [PMC free article] [PubMed] [Google Scholar]
- 29.Radisky DC, Levy DD, Littlepage LE, et al. Rac1b and reactive oxygen species mediate MMP-3-induced EMT and genomic instability. Nature. 2005;436:123–7. doi: 10.1038/nature03688. [DOI] [PMC free article] [PubMed] [Google Scholar]
- 30.Mehner C, Miller E, Khauv D, et al. Tumor cell-derived MMP3 orchestrates Rac1b and tissue alterations that promote pancreatic adenocarcinoma. Mol Cancer Res. 2014;12:1430–9. doi: 10.1158/1541-7786.MCR-13-0557-T. [DOI] [PMC free article] [PubMed] [Google Scholar]
- 31.Mehner C, Radisky DC. Triggering the landslide: The tumor-promotional effects of myofibroblasts. Exp Cell Res. 2013;319:1657–62. doi: 10.1016/j.yexcr.2013.03.015. [DOI] [PMC free article] [PubMed] [Google Scholar]
- 32.Stallings-Mann ML, Waldmann J, Zhang Y, et al. Matrix metalloproteinase induction of Rac1b, a key effector of lung cancer progression. Sci Transl Med. 2012;4:142ra95. doi: 10.1126/scitranslmed.3004062. [DOI] [PMC free article] [PubMed] [Google Scholar]
- 33.Yamashita CM, Dolgonos L, Zemans RL, et al. Matrix metalloproteinase 3 is a mediator of pulmonary fibrosis. Am J Pathol. 2011;179:1733–45. doi: 10.1016/j.ajpath.2011.06.041. [DOI] [PMC free article] [PubMed] [Google Scholar]
- 34.Yamashita CM, Radisky DC, Aschner Y, Downey GP. The importance of matrix metalloproteinase-3 in respiratory disorders. Expert Rev Respir Med. 2014;8:411–21. doi: 10.1586/17476348.2014.909288. [DOI] [PubMed] [Google Scholar]
- 35.Cichon MA, Radisky DC. ROS-induced epithelial-mesenchymal transition in mammary epithelial cells is mediated by NF-kB-dependent activation of Snail. Oncotarget. 2014;5:2827–38. doi: 10.18632/oncotarget.1940. [DOI] [PMC free article] [PubMed] [Google Scholar]
- 36.Chen CS, Nelson CM, Khauv D, et al. Homology with vesicle fusion mediator syntaxin-1a predicts determinants of epimorphin/syntaxin-2 function in mammary epithelial morphogenesis. J Biol Chem. 2009;284:6877–84. doi: 10.1074/jbc.M805908200. [DOI] [PMC free article] [PubMed] [Google Scholar]
- 37.Kupershmidt I, Su QJ, Grewal A, et al. Ontology-based meta-analysis of global collections of high-throughput public data. PLoS One. 2010;5:0013066. doi: 10.1371/journal.pone.0013066. [DOI] [PMC free article] [PubMed] [Google Scholar]
- 38.Mehner C, Hockla A, Miller E, Ran S, Radisky DC, Radisky ES. Tumor cell-produced matrix metalloproteinase 9 (MMP-9) drives malignant progression and metastasis of basal-like triple negative breast cancer. Oncotarget. 2014;5:2736–49. doi: 10.18632/oncotarget.1932. [DOI] [PMC free article] [PubMed] [Google Scholar]
- 39.Schneider CA, Rasband WS, Eliceiri KW. NIH Image to ImageJ: 25 years of image analysis. Nat Methods. 2012;9:671–5. doi: 10.1038/nmeth.2089. [DOI] [PMC free article] [PubMed] [Google Scholar]
- 40.Wheelock MJ, Shintani Y, Maeda M, Fukumoto Y, Johnson KR. Cadherin switching. J Cell Sci. 2008;121:727–35. doi: 10.1242/jcs.000455. [DOI] [PubMed] [Google Scholar]
- 41.Richardson AL, Wang ZC, De Nicolo A, et al. X chromosomal abnormalities in basal-like human breast cancer. Cancer Cell. 2006;9:121–32. doi: 10.1016/j.ccr.2006.01.013. [DOI] [PubMed] [Google Scholar]
- 42.Sabatier R, Finetti P, Adelaide J, et al. Down-regulation of ECRG4, a candidate tumor suppressor gene, in human breast cancer. PLoS One. 2011;6:e27656. doi: 10.1371/journal.pone.0027656. [DOI] [PMC free article] [PubMed] [Google Scholar]
- 43.Pedraza V, Gomez-Capilla JA, Escaramis G, et al. Gene expression signatures in breast cancer distinguish phenotype characteristics, histologic subtypes, and tumor invasiveness. Cancer. 2010;116:486–96. doi: 10.1002/cncr.24805. [DOI] [PubMed] [Google Scholar]
- 44.Chen DT, Nasir A, Culhane A, et al. Proliferative genes dominate malignancy-risk gene signature in histologically-normal breast tissue. Breast Cancer Res Treat. 2010;119:335–46. doi: 10.1007/s10549-009-0344-y. [DOI] [PMC free article] [PubMed] [Google Scholar]
- 45.Martin M, Romero A, Cheang MC, et al. Genomic predictors of response to doxorubicin versus docetaxel in primary breast cancer. Breast Cancer Res Treat. 2011;128:127–36. doi: 10.1007/s10549-011-1461-y. [DOI] [PubMed] [Google Scholar]
- 46.Parker JS, Mullins M, Cheang MC, et al. Supervised risk predictor of breast cancer based on intrinsic subtypes. J Clin Oncol. 2009;27:1160–7. doi: 10.1200/JCO.2008.18.1370. [DOI] [PMC free article] [PubMed] [Google Scholar]
- 47.Neve RM, Chin K, Fridlyand J, et al. A collection of breast cancer cell lines for the study of functionally distinct cancer subtypes. Cancer Cell. 2006;10:515–27. doi: 10.1016/j.ccr.2006.10.008. [DOI] [PMC free article] [PubMed] [Google Scholar]
- 48.Wolfer A, Wittner BS, Irimia D, et al. MYC regulation of a “poor-prognosis” metastatic cancer cell state. Proc Natl Acad Sci U S A. 2010;107:3698–703. doi: 10.1073/pnas.0914203107. [DOI] [PMC free article] [PubMed] [Google Scholar]
- 49.Bayer I, Groth P, Schneckener S. Prediction errors in learning drug response from gene expression data – influence of labeling, sample size, and machine learning algorithm. PLoS One. 2013;8:e70294. doi: 10.1371/journal.pone.0070294. [DOI] [PMC free article] [PubMed] [Google Scholar]
- 50.Bennett CN, Tomlinson CC, Michalowski AM, et al. Cross-species genomic and functional analyses identify a combination therapy using a CHK1 inhibitor and a ribonucleotide reductase inhibitor to treat triple-negative breast cancer. Breast Cancer Res. 2012;14:R109. doi: 10.1186/bcr3230. [DOI] [PMC free article] [PubMed] [Google Scholar]
- 51.Sircoulomb F, Bekhouche I, Finetti P, et al. Genome profiling of ERBB2-amplified breast cancers. BMC Cancer. 2010;10:539. doi: 10.1186/1471-2407-10-539. [DOI] [PMC free article] [PubMed] [Google Scholar]
- 52.Glück S, Ross JS, Royce M, et al. TP53 genomics predict higher clinical and pathologic tumor response in operable early-stage breast cancer treated with docetaxel-capecitabine +/− trastuzumab. Breast Cancer Res Treat. 2012;132:781–91. doi: 10.1007/s10549-011-1412-7. [DOI] [PubMed] [Google Scholar]
- 53.Dedeurwaerder S, Desmedt C, Calonne E, et al. DNA methylation profiling reveals a predominant immune component in breast cancers. EMBO Mol Med. 2011;3:726–41. doi: 10.1002/emmm.201100801. [DOI] [PMC free article] [PubMed] [Google Scholar]
- 54.Pavon-Eternod M, Gomes S, Geslain R, Dai Q, Rosner MR, Pan T. tRNA over-expression in breast cancer and functional consequences. Nucleic Acids Res. 2009;37:7268–80. doi: 10.1093/nar/gkp787. [DOI] [PMC free article] [PubMed] [Google Scholar]
- 55.Nelson ER, Wardell SE, Jasper JS, et al. 27-Hydroxycholesterol links hypercholesterolemia and breast cancer pathophysiology. Science. 2013;342:1094–8. doi: 10.1126/science.1241908. [DOI] [PMC free article] [PubMed] [Google Scholar]
- 56.Bourdeau V, Deschênes J, Laperrière D, Aid M, White JH, Mader S. Mechanisms of primary and secondary estrogen target gene regulation in breast cancer cells. Nucleic Acids Res. 2008;36:76–93. doi: 10.1093/nar/gkm945. [DOI] [PMC free article] [PubMed] [Google Scholar]
- 57.Wardell SE, Kazmin D, McDonnell DP. Research resource: transcriptional profiling in a cellular model of breast cancer reveals functional and mechanistic differences between clinically relevant SERM and between SERM/estrogen complexes. Mol Endocrinol. 2012;26:1235–48. doi: 10.1210/me.2012-1031. [DOI] [PMC free article] [PubMed] [Google Scholar]
- 58.Shioda T, Rosenthal NF, Coser KR, et al. Expressomal approach for comprehensive analysis and visualization of ligand sensitivities of xenoestrogen responsive genes. Proc Natl Acad Sci U S A. 2013;110:16508–13. doi: 10.1073/pnas.1315929110. [DOI] [PMC free article] [PubMed] [Google Scholar]
- 59.Coser KR, Wittner BS, Rosenthal NF, et al. Antiestrogen-resistant subclones of MCF-7 human breast cancer cells are derived from a common monoclonal drug-resistant progenitor. Proc Natl Acad Sci U S A. 2009;106:14536–41. doi: 10.1073/pnas.0907560106. [DOI] [PMC free article] [PubMed] [Google Scholar]
- 60.Miller TW, Balko JM, Fox EM, et al. ERalpha-dependent E2F transcription can mediate resistance to estrogen deprivation in human breast cancer. Cancer Discov. 2011;1:338–51. doi: 10.1158/2159-8290.CD-11-0101. [DOI] [PMC free article] [PubMed] [Google Scholar]
- 61.Planas-Silva MD, Waltz PK. Estrogen promotes reversible epithelial-to-mesenchymal-like transition and collective motility in MCF-7 breast cancer cells. J Steroid Biochem Mol Biol. 2007;104:11–21. doi: 10.1016/j.jsbmb.2006.09.039. [DOI] [PubMed] [Google Scholar]
- 62.Marshall AM, Pai VP, Sartor MA, Horseman ND. In vitro multipotent differentiation and barrier function of a human mammary epithelium. Cell Tissue Res. 2009;335:383–95. doi: 10.1007/s00441-008-0719-0. [DOI] [PubMed] [Google Scholar]
- 63.Asaithamby A, Hu B, Delgado O, et al. Irreparable complex DNA double-strand breaks induce chromosome breakage in organotypic three-dimensional human lung epithelial cell culture. Nucleic Acids Res. 2011;39:5474–88. doi: 10.1093/nar/gkr149. [DOI] [PMC free article] [PubMed] [Google Scholar]
- 64.Li CR, Su JJ, Wang WY, et al. Molecular profiling of prostatic acinar morphogenesis identifies PDCD4 and KLF6 as tissue architecture-specific prognostic markers in prostate cancer. Am J Pathol. 2013;182:363–74. doi: 10.1016/j.ajpath.2012.10.024. [DOI] [PMC free article] [PubMed] [Google Scholar]
- 65.Cichon MA, Gainullin VG, Zhang Y, Radisky DC. Growth of lung cancer cells in three-dimensional microenvironments reveals key features of tumor malignancy. Integr Biol (Camb) 2012;4:440–8. doi: 10.1039/c1ib00090j. [DOI] [PMC free article] [PubMed] [Google Scholar]
- 66.Söhle J, Machuy N, Smailbegovic E, et al. Identification of new genes involved in human adipogenesis and fat storage. PLoS One. 2012;7:e31193. doi: 10.1371/journal.pone.0031193. [DOI] [PMC free article] [PubMed] [Google Scholar]
- 67.Deshiere A, Duchemin-Pelletier E, Spreux E, et al. Unbalanced expression of CK2 kinase subunits is sufficient to drive epithelial-to-mesenchymal transition by Snail1 induction. Oncogene. 2013;32:1373–83. doi: 10.1038/onc.2012.165. [DOI] [PubMed] [Google Scholar]
- 68.Andarawewa KL, Erickson AC, Chou WS, et al. Ionizing radiation predisposes nonmalignant human mammary epithelial cells to undergo transforming growth factor beta induced epithelial to mesenchymal transition. Cancer Res. 2007;67:8662–70. doi: 10.1158/0008-5472.CAN-07-1294. [DOI] [PubMed] [Google Scholar]
- 69.Maupin KA, Sinha A, Eugster E, et al. Glycogene expression alterations associated with pancreatic cancer epithelial-mesenchymal transition in complementary model systems. PLoS One. 2010;5:e13002. doi: 10.1371/journal.pone.0013002. [DOI] [PMC free article] [PubMed] [Google Scholar]
- 70.Sartor MA, Mahavisno V, Keshamouni VG, et al. ConceptGen: a gene set enrichment and gene set relation mapping tool. Bioinformatics. 2010;26:456–63. doi: 10.1093/bioinformatics/btp683. [DOI] [PMC free article] [PubMed] [Google Scholar]
- 71.Lindoso RS, Collino F, Bruno S, et al. Extracellular vesicles released from mesenchymal stromal cells modulate miRNA in renal tubular cells and inhibit ATP depletion injury. Stem Cells Dev. 2014;23:1809–19. doi: 10.1089/scd.2013.0618. [DOI] [PMC free article] [PubMed] [Google Scholar]
- 72.Choi YL, Bocanegra M, Kwon MJ, et al. LYN is a mediator of epithelial-mesenchymal transition and a target of dasatinib in breast cancer. Cancer Res. 2010;70:2296–306. doi: 10.1158/0008-5472.CAN-09-3141. [DOI] [PMC free article] [PubMed] [Google Scholar]
- 73.Chang C, Yang X, Pursell B, Mercurio AM. Id2 complexes with the SNAG domain of Snai1 inhibiting Snai1-mediated repression of integrin beta4. Mol Cell Biol. 2013;33:3795–804. doi: 10.1128/MCB.00434-13. [DOI] [PMC free article] [PubMed] [Google Scholar]
- 74.Robinson GW, Johnson PF, Hennighausen L, Sterneck E. The C/EBPbeta transcription factor regulates epithelial cell proliferation and differentiation in the mammary gland. Genes Dev. 1998;12:1907–16. doi: 10.1101/gad.12.12.1907. [DOI] [PMC free article] [PubMed] [Google Scholar]
- 75.Seagroves TN, Krnacik S, Raught B, et al. C/EBPbeta, but not C/EBPalpha, is essential for ductal morphogenesis, lobuloalveolar proliferation, and functional differentiation in the mouse mammary gland. Genes Dev. 1998;12:1917–28. doi: 10.1101/gad.12.12.1917. [DOI] [PMC free article] [PubMed] [Google Scholar]
- 76.Hirai Y, Radisky D, Boudreau R, et al. Epimorphin mediates mammary luminal morphogenesis through control of C/EBPbeta. J Cell Biol. 2001;153:785–94. doi: 10.1083/jcb.153.4.785. [DOI] [PMC free article] [PubMed] [Google Scholar]
- 77.Miura Y, Hagiwara N, Radisky DC, Hirai Y. CCAAT/enhancer binding protein beta (C/EBPbeta) isoform balance as a regulator of epithelial-mesenchymal transition in mouse mammary epithelial cells. Exp Cell Res. 2014;327:146–55. doi: 10.1016/j.yexcr.2014.05.019. [DOI] [PubMed] [Google Scholar]
- 78.Radisky DC, Stallings-Mann M, Hirai Y, Bissell MJ. Single proteins might have dual but related functions in intracellular and extracellular microenvironments. Nat Rev Mol Cell Biol. 2009;10:228–34. doi: 10.1038/nrm2633. [DOI] [PMC free article] [PubMed] [Google Scholar]
- 79.Bascom JL, Radisky DC, Koh E, et al. Epimorphin is a novel regulator of the progesterone receptor isoform-a. Cancer Res. 2013;73:5719–29. doi: 10.1158/0008-5472.CAN-13-0021. [DOI] [PMC free article] [PubMed] [Google Scholar]
- 80.Hirai Y, Nelson CM, Yamazaki K, et al. Non-classical export of epimorphin and its adhesion to alphav-integrin in regulation of epithelial morphogenesis. J Cell Sci. 2007;120:2032–43. doi: 10.1242/jcs.006247. [DOI] [PubMed] [Google Scholar]
- 81.Burns WC, Thomas MC. The molecular mediators of type 2 epithelial to mesenchymal transition (EMT) and their role in renal pathophysiology. Expert Rev Mol Med. 2010;12:e17. doi: 10.1017/S1462399410001481. [DOI] [PubMed] [Google Scholar]
- 82.Cichon MA, Degnim AC, Visscher DW, Radisky DC. Microenvironmental influences that drive progression from benign breast disease to invasive breast cancer. J Mammary Gland Biol Neoplasia. 2010;15:389–97. doi: 10.1007/s10911-010-9195-8. [DOI] [PMC free article] [PubMed] [Google Scholar]
- 83.Orlichenko LS, Radisky DC. Matrix metalloproteinases stimulate epithelial-mesenchymal transition during tumor development. Clin Exp Metastasis. 2008;25:593–600. doi: 10.1007/s10585-008-9143-9. [DOI] [PubMed] [Google Scholar]
- 84.Croucher DR, Saunders DN, Lobov S, Ranson M. Revisiting the biological roles of PAI2 (SERPINB2) in cancer. Nat Rev Cancer. 2008;8:535–45. doi: 10.1038/nrc2400. [DOI] [PubMed] [Google Scholar]
- 85.Jacob A, Jing J, Lee J, et al. Rab40b regulates trafficking of MMP2 and MMP9 during invadopodia formation and invasion of breast cancer cells. J Cell Sci. 2013;126:4647–58. doi: 10.1242/jcs.126573. [DOI] [PMC free article] [PubMed] [Google Scholar]
- 86.Jean-Philippe J, Paz S, Caputi M. hnRNP A1: the Swiss army knife of gene expression. Int J Mol Sci. 2013;14:18999–9024. doi: 10.3390/ijms140918999. [DOI] [PMC free article] [PubMed] [Google Scholar]
- 87.Bonomi S, di Matteo A, Buratti E, et al. HnRNP A1 controls a splicing regulatory circuit promoting mesenchymal-to-epithelial transition. Nucleic Acids Res. 2013;41:8665–79. doi: 10.1093/nar/gkt579. [DOI] [PMC free article] [PubMed] [Google Scholar]
- 88.Pelisch F, Khauv D, Risso G, et al. Involvement of hnRNP A1 in the matrix metalloprotease-3-dependent regulation of Rac1 pre-mRNA splicing. J Cell Biochem. 2012;113:2319–29. doi: 10.1002/jcb.24103. [DOI] [PMC free article] [PubMed] [Google Scholar]
- 89.Goncalves V, Matos P, Jordan P. Antagonistic SR proteins regulate alternative splicing of tumor-related Rac1b downstream of the PI3-kinase and Wnt pathways. Hum Mol Genet. 2009;18:3696–707. doi: 10.1093/hmg/ddp317. [DOI] [PubMed] [Google Scholar]
- 90.Ishii H, Saitoh M, Sakamoto K, et al. Epithelial splicing regulatory proteins 1 (ESRP1) and 2 (ESRP2) suppress cancer cell motility via different mechanisms. J Biol Chem. 2014;289:27386–99. doi: 10.1074/jbc.M114.589432. [DOI] [PMC free article] [PubMed] [Google Scholar]
- 91.David CJ, Manley JL. Alternative pre-mRNA splicing regulation in cancer: pathways and programs unhinged. Genes Dev. 2010;24:2343–64. doi: 10.1101/gad.1973010. [DOI] [PMC free article] [PubMed] [Google Scholar]
- 92.Srebrow A, Kornblihtt AR. The connection between splicing and cancer. J Cell Sci. 2006;119:2635–41. doi: 10.1242/jcs.03053. [DOI] [PubMed] [Google Scholar]
- 93.De Craene B, Berx G. Regulatory networks defining EMT during cancer initiation and progression. Nat Rev Cancer. 2013;13:97–110. doi: 10.1038/nrc3447. [DOI] [PubMed] [Google Scholar]
- 94.Shapiro IM, Cheng AW, Flytzanis NC, et al. An EMT-driven alternative splicing program occurs in human breast cancer and modulates cellular phenotype. PLoS Genet. 2011;7:e1002218. doi: 10.1371/journal.pgen.1002218. [DOI] [PMC free article] [PubMed] [Google Scholar]
- 95.Warzecha CC, Jiang P, Amirikian K, et al. An ESRP-regulated splicing programme is abrogated during the epithelial-mesenchymal transition. EMBO J. 2010;29:3286–300. doi: 10.1038/emboj.2010.195. [DOI] [PMC free article] [PubMed] [Google Scholar]
- 96.Warzecha CC, Sato TK, Nabet B, Hogenesch JB, Carstens RP. ESRP1 and ESRP2 are epithelial cell-type-specific regulators of FGFR2 splicing. Mol Cell. 2009;33:591–601. doi: 10.1016/j.molcel.2009.01.025. [DOI] [PMC free article] [PubMed] [Google Scholar]
- 97.Bria E, Di Modugno F, Sperduti I, et al. Prognostic impact of alternative splicing-derived hMENA isoforms in resected, node-negative, non-small-cell lung cancer. Oncotarget. 2014;5(22):11054–63. doi: 10.18632/oncotarget.2609. [DOI] [PMC free article] [PubMed] [Google Scholar]
- 98.Di Modugno F, Iapicca P, Boudreau A, et al. Splicing program of human MENA produces a previously undescribed isoform associated with invasive, mesenchymal-like breast tumors. Proc Natl Acad Sci U S A. 2012;109:19280–5. doi: 10.1073/pnas.1214394109. [DOI] [PMC free article] [PubMed] [Google Scholar]
- 99.Gonçalves V, Henriques A, Pereira J, et al. Phosphorylation of SRSF1 by SRPK1 regulates alternative splicing of tumor-related Rac1b in colorectal cells. RNA. 2014;20:474–82. doi: 10.1261/rna.041376.113. [DOI] [PMC free article] [PubMed] [Google Scholar]
- 100.Matos P, Kotelevets L, Goncalves V, et al. Ibuprofen inhibits colitis-induced overexpression of tumor-related Rac1b. Neoplasia. 2013;15:102–11. doi: 10.1593/neo.121890. [DOI] [PMC free article] [PubMed] [Google Scholar]
- 101.Matos P, Oliveira C, Velho S, et al. B-Raf(V600E) cooperates with alternative spliced Rac1b to sustain colorectal cancer cell survival. Gastroenterology. 2008;135:899–906. doi: 10.1053/j.gastro.2008.05.052. [DOI] [PubMed] [Google Scholar]
- 102.Blaustein M, Pelisch F, Coso OA, Bissell MJ, Kornblihtt AR, Srebrow A. Mammary epithelial-mesenchymal interaction regulates fibronectin alternative splicing via phosphatidylinositol 3-kinase. J Biol Chem. 2004;279:21029–37. doi: 10.1074/jbc.M314260200. [DOI] [PubMed] [Google Scholar]
- 103.Valacca C, Bonomi S, Buratti E, et al. Sam68 regulates EMT through alternative splicing-activated nonsense-mediated mRNA decay of the SF2/ASF proto-oncogene. J Cell Biol. 2010;191:87–99. doi: 10.1083/jcb.201001073. [DOI] [PMC free article] [PubMed] [Google Scholar]
- 104.Schnelzer A, Prechtel D, Knaus U, et al. Rac1 in human breast cancer: overexpression, mutation analysis, and characterization of a new isoform, Rac1b. Oncogene. 2000;19:3013–20. doi: 10.1038/sj.onc.1203621. [DOI] [PubMed] [Google Scholar]
- 105.Fiegen D, Haeusler LC, Blumenstein L, et al. Alternative splicing of Rac1 generates Rac1b, a self-activating GTPase. J Biol Chem. 2004;279:4743–9. doi: 10.1074/jbc.M310281200. [DOI] [PubMed] [Google Scholar]
- 106.Singh A, Karnoub AE, Palmby TR, Lengyel E, Sondek J, Der CJ. Rac1b, a tumor associated, constitutively active Rac1 splice variant, promotes cellular transformation. Oncogene. 2004;23:9369–80. doi: 10.1038/sj.onc.1208182. [DOI] [PubMed] [Google Scholar]
- 107.Orlichenko L, Geyer R, Yanagisawa M, et al. The 19-amino acid insertion in the tumor-associated splice isoform Rac1b confers specific binding to p120 catenin. J Biol Chem. 2010;285:19153–61. doi: 10.1074/jbc.M109.099382. [DOI] [PMC free article] [PubMed] [Google Scholar]
- 108.Radisky DC, Bissell MJ. Matrix metalloproteinase-induced genomic instability. Curr Opin Genet Dev. 2006;16:45–50. doi: 10.1016/j.gde.2005.12.011. [DOI] [PMC free article] [PubMed] [Google Scholar]
- 109.Radisky DC, Przybylo JA. Matrix metalloproteinase-induced fibrosis and malignancy in breast and lung. Proc Am Thorac Soc. 2008;5:316–22. doi: 10.1513/pats.200711-166DR. [DOI] [PubMed] [Google Scholar]
- 110.Bid HK, Roberts RD, Manchanda PK, Houghton PJ. RAC1: an emerging therapeutic option for targeting cancer angiogenesis and metastasis. Mol Cancer Ther. 2013;12:1925–34. doi: 10.1158/1535-7163.MCT-13-0164. [DOI] [PMC free article] [PubMed] [Google Scholar]
- 111.Onesto C, Shutes A, Picard V, Schweighoffer F, Der CJ. Characterization of EHT 1864, a novel small molecule inhibitor of Rac family small GTPases. Methods Enzymol. 2008;439:111–129. doi: 10.1016/S0076-6879(07)00409-0. [DOI] [PubMed] [Google Scholar]
- 112.Shutes A, Onesto C, Picard V, Leblond B, Schweighoffer F, Der CJ. Specificity and mechanism of action of EHT 1864, a novel small molecule inhibitor of Rac family small GTPases. J Biol Chem. 2007;282:35666–78. doi: 10.1074/jbc.M703571200. [DOI] [PubMed] [Google Scholar]
- 113.Rosenblatt AE, Garcia MI, Lyons L, et al. Inhibition of the Rho GTPase, Rac1, decreases estrogen receptor levels and is a novel therapeutic strategy in breast cancer. Endocr Relat Cancer. 2011;18:207–19. doi: 10.1677/ERC-10-0049. [DOI] [PMC free article] [PubMed] [Google Scholar]
Associated Data
This section collects any data citations, data availability statements, or supplementary materials included in this article.
Supplementary Materials
Supplementary Table 1. Broad MSigDB - Canonical Pathways for SCp2 cell experiment.
Supplementary Table 2. Broad MSigDB - Regulatory Motifs for SCp2 cell experiment.
Supplementary Table 3. Gene Ontology (GO) for SCp2 cell experiment.
Supplementary Figure 1. Meta-analysis of datasets showing overlap of density-dependent gene expression changes in MCF10A cells with biosets comparing breast cancer of basal subtype vs other subtypes. In each panel, Bioset 1 is the list of genes upregulated or downregulated more than two-fold in cells cultured at 800K density vs 50K density (n = 3102 features mapped to 2434 genes). (A–D) Overlap with biosets comparing breast tumors of the basal subtype vs normal breast tissue (A42, B51, C52, and D53). (E) Overlap with bioset comparing breast tumors of basal subtype vs normal-like subtype.52 (F) Overlap with bioset comparing breast cancer cell lines derived from basal B subtype vs basal A subtype tumors.54
Supplementary Figure 2. Overlap of genes regulated by density in MCF10A and by MMP-3 in SCp2 cells. Significant overlap of genes upregulated in MCF10A cells at 800K vs 50K (left column) or genes downregulated in MCF10A cells at 800K vs 50K (right column) with genes regulated by both density and MMP-3 (top row; comparison shown for genes regulated in 50K control vs 50K MMP-3), with genes regulated primarily by density (middle row; comparison shown for genes regulated in 250K control vs 50K control), and with genes regulated primarily by MMP-3 (bottom row; comparison shown for genes regulated in 50K control vs 50K MMP-3).