

Abstract
Objectives
To assess the capability of T2-weighted MRI (T2W-MRI) and the additional diagnostic value of Dynamic Contrast-Enhanced MRI (DCE-MRI) using multi-transmit 3T in the localization of bladder cancer.
Materials and Methods
This prospective study was approved by the local Institutional Review Board. Thirty–six patients were included in the study and provided informed consent. MRI scans were performed with T2W-MRI and DCE-MRI on a 3T multi-transmit system. Two observers (with 12 and 25 years of experience) independently interpreted T2W-MRI prior to DCE-MRI data (maps of pharmacokinetic parameters) to localize bladder tumors. The pathological examination of cystectomy bladder specimens was used as a reference gold standard. The McNemar test was performed to evaluate the differences in sensitivity, specificity, and accuracy. Kappa scores were calculated to assess interobserver agreement.
Results
The sensitivity, specificity, and accuracy of the localization with T2W-MRI alone were 81% (29/36), 63% (5/8) and 77% (34/44) for observer 1, and 72% (26/36), 63% (5/8), and 70% (31/44) for observer 2. With additional DCE-MRI available, these values were 92% (33/36), 75% (6/8), and 89% (39/44) for observer 1, and 92% (33/36), 63% (5/8), and 86% (38/44) for observer 2. DCE-MRI significantly (P < 0.01) improved the sensitivity and accuracy for observer 2. For the twenty-three patients treated with chemotherapy, DCE-MRI also significantly (P < 0.02) improved the sensitivity and accuracy of bladder cancer localization with T2W-MRI alone for observer 2. Kappa scores were 0.63 for T2W-MRI alone, and 0.78 for additional DCE-MRI. Out of seven sub-centimeter malignant tumors, four (57%) were identified on T2W images and six (86%) on DCE maps. Out of eleven malignant tumors within the bladder wall thickening, six (55%) were found on T2W images and ten (91%) on DCE maps.
Conclusions
Compared to conventional T2W-MRI alone, the addition of DCE-MRI improved interobserver agreement as well as the localization of small malignant tumors and those within bladder wall thickening.
Keywords: 3T MRI, DCE-MRI, bladder cancer localization, bladder wall thickening, sub-centimeter tumors
Introduction
Bladder cancer is the fourth most common cancer in men and the tenth most common cancer in women in the United States (1). It is estimated by the American Cancer Society that 72,570 (54,610 in men and 17,960 in women) newly diagnosed cases of bladder cancer and 15,210 (10,820 in men and 4,390 in women) related deaths will occur in the United States in 2013 (2). About 70-80% of the diagnosed cases are found with non-muscle-invasive bladder cancer (3). Cystoscopy is the standard for the diagnosis and local management of bladder cancer. However, it is invasive and limited in assessing the fat infiltration of bladder malignancies (4). Computed Tomography (CT) is the most commonly used imaging modality to initially assess bladder cancer. CT is limited by the risk of ionizing radiation, low accuracy and high interobserver variability in the staging of bladder cancer (5). Accurate diagnosis of bladder cancer, which is essential to patient management and treatment, is still an unmet clinical need not yet resolved by cystoscopy and CT. Without ionizing radiation and with the capabilities of tissue characterization and multi-planar functional imaging, Magnetic Resonance Imaging (MRI) has been shown to be useful in evaluating chemotherapeutic response in bladder cancer (6) and to be the most accurate technique for the tumor staging (7) to address this unmet clinical need.
Functional dynamic contrast-enhanced MRI (DCE-MRI) can assess the microcirculation and visualize the neoangiogenesis of malignant tissues via the dynamic signal enhancement of a contrast agent. DCEMRI has already demonstrated good interobserver agreement and high accuracy in the differentiation of muscle-invasive from non-muscle-invasive bladder cancer (8). High field 3T MRI has been shown to be superior to lower field strength MRI in the spatial resolution, signal-to-noise ratio, contrast-to-noise ratio, and the delineation of the depth of tumor invasion in different types of cancer (9-14). To date, there has only been one study that used 3T MRI (with conventional T1-weighted and T2-weighted Imaging) for the local staging of bladder cancer (15). No prior study to assess the capability of 3T MRI with functional imaging for the localization of bladder cancer has been reported. We conducted a multi-parametric MRI study to systematically evaluate the capabilities of conventional and functional MRI for the localization, staging, and assessment of therapeutic response of bladder cancer.
The impact of dielectric artifacts such as shaded areas on MR images increases with the field strength. It was reported that multi-transmit technology helps 3T MRI reduce dielectric effects at high field, improve the homogeneity of RF field, and decrease scan times (16).
The purpose of this study is to evaluate the ability of T2-weighted MRI (T2W-MRI) and the additional diagnostic value of functional DCE-MRI in the localization of bladder cancer using current technology of multi-transmit 3T imaging.
Materials and Methods
Patients
This study is part of our on-going study which is aimed at using 3T MRI in the localization, staging, and assessment of chemotherapeutic response of bladder cancer. The study was approved by the local Institutional Review Board. The pathological examination of cystectomy bladder specimens was used as a reference (gold) standard. Patient enrollment criteria are: (1) patient is 18 years or older; (2) diagnosed with bladder cancer; (3) scheduled for radical cystectomy; (4) able and willing to give valid written informed consent; (5) with no contraindications to MRI. From July 2009 to November 2011, fifty patients (forty-one males, nine females; age range: 38-86 years, median: 68 years) were enrolled in the study. All patients provided informed consent. Nine patients did not complete the study protocol due to their specific co-morbidity. Five patients had poorly distended bladder volume via the visual inspection by two radiologists who were blinded to both clinical and pathological findings. These fourteen patients were excluded from the study.
Of thirty-six included patients, thirteen (seven who had aggressive bladder tumors and required immediate cystectomy, and six who had non-muscle-invasive tumors and did not receive chemotherapy) were directed to cystectomy after baseline MRI (Figure 1). The other twenty-three patients were treated with two cycles (21 days per cycles) of chemotherapy prior to mid-cycle MRI. Three patients were subsequently sent to surgery due to tumor progression during chemotherapy. The remaining twenty patients completed the other two cycles of chemotherapy and had post-chemotherapy MRI, followed by cystectomy. All cystectomy bladder specimens were examined by pathology. The study flow chart is described in Figure 1.
Figure 1.
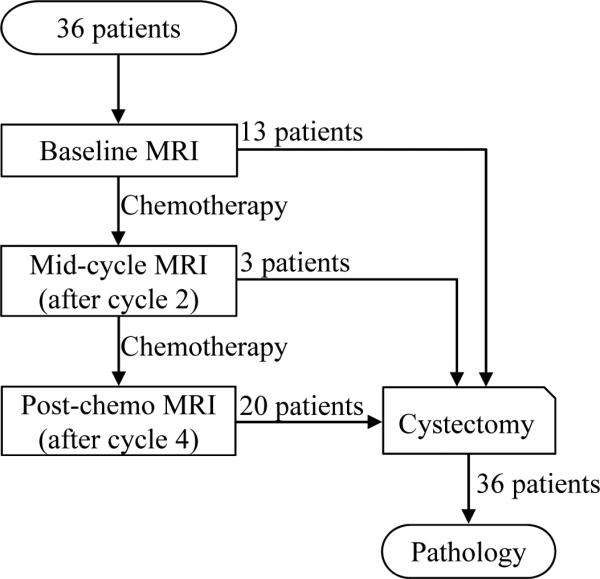
Study flow chart. Thirty-six patients were included in the study. All patients had cystectomy after their last MRI. All surgical bladder specimens were examined by pathology.
MR Imaging Protocol
All patients were scanned on a 3T MRI system (Achieva; Philips Healthcare, Cleveland, Ohio, USA) using 2-channel RF transmit and 32-channel phased-array surface coils.
Axial T2W-MRI was performed with a Turbo Spin Echo sequence (repetition time/echo time, 4264/80 ms; matrix, 292×323; spatial resolution (RL/AP/FH), 1.0×1.1×3.0 mm; slice gap, 0.3 mm; number of slices, 40; acquisition time, 5 minutes; field of view (RL/AP/FH), 290×341×130 mm; sensitivity encoding factor, 2) prior to the contrast administration.
DCE-MRI was performed using a 3D-spoiled Gradient Echo sequence (repetition time/echo time, 5/2 ms; flip angle, 20°; matrix, 212×213; spatial resolution (RL/AP/FH), 1.7×1.7×5.0 mm; number of slices, 19; field of view (RL/AP/FH), 360x360x95 mm; number of signal average (NSA), 1; temporal resolution, 8.3 sec; acquisition time, 8.5 minutes; number of dynamic scans, 60) in the axial orientation. A single dose (0.2 mmol per kilogram body weight) of Gd-based contrast agent (Magnevist, Bayer Healthcare) was intravenously injected at a constant flow rate of 0.5 mL/s after the fifth dynamic scan, followed by a flush of 25 mL saline at a flow rate of 2mL/s. Depending on the patient's weight, injection time ranged from 21 to 50 s, with a median of 30 s.
Image Processing
DCE-MRI data were processed in an IDL (Exelis VIS)-based software environment by applying a modified Brix's linear two-compartment pharmacokinetic model (17, 18) to quantify the perfusion and microcirculation in body tissues via the dynamic signal enhancement of the contrast agent. An arterial input function (AIF) was manually selected for each dataset by placing an arterial region of interest (ROI) on the right common femoral artery. Pharmacokinetic parameters amplitude (Amp) and the AIF-adjusted exchange rate of the contrast agent between the extravascular extracellular space (EES) and the plasma space (kep) were quantified with the method proposed by Yang et al (18). The generation of combined Amp and kep maps were fully automated. The pharmacokinetic maps of Amp and kep were coded with the same color table and on the same parameter scale (see Color Table on Figure 2) for all cases. The display of color maps followed the standard display method for Brix's model (19). A threshold value of 1.0 (a.u.) was chosen for Amp. The color pharmacokinetic maps were overlaid on original DCE (T1-weighted) MR images.
Figure 2.
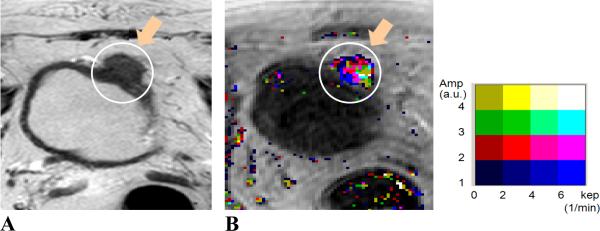
MR images of a 64 year-old male patient. Image A, axial T2W image; Image B, Amp+kep map. The patient was treated with chemotherapy. Tumor location (indicated by orange arrows and enclosed in white contours) was at the anterior and dome aspect of the bladder wall. Tumor stage: T3b; size: 38 mm. The malignant tumor was visualized on both T2W image and pharmacokinetic map. The malignancy was identified with continuous color pixels on the color DCE map.
MRI Data Interpretation
A Philips Extended Brilliance Workspace (EBW) workstation was used for data review. Two radiologists (with 12 and 25 years of experience) blinded to clinical as well as pathological findings independently reviewed MRI data. Each radiologist identified malignant bladder tumors on T2W MR images alone, and subsequently with additional pharmacokinetic maps (DCE-MRI maps) available. On color DCE-MRI maps, malignant lesions were identified with continuous color pixels on the bladder wall, indicating the neoangiogenic characteristics of tumor tissues via signal enhancement (Figure 2).
The location of bladder cancer was identified as right lateral, left lateral, anterior, posterior, dome, and trigone/apex of the bladder wall in both the radiological read of the pre-surgical MRI and the pathological examination of the cystectomy bladder specimen. An independent assessor was tasked to match the radiological read with the pathological examination of the same patient. A true positive finding of the radiological read was achieved when the bladder malignancy location was matched between the radiological read and the pathological examination. A true negative finding of the radiological read was confirmed when there was no malignant tumor found in the bladder by both radiology and pathology.
Statistical Analysis
Descriptive statistics (mean and standard deviation or median and range for continuous variables; frequency and proportion with 95% confidence interval for categorical variables) was used to summarize the data. The exact binominal method was used to calculate the 95% confidence interval of proportion. Kappa values were calculated to evaluate the interobserver agreement for the interpretation with T2W-MRI alone and with the addition of DCE-MRI. Agreement was considered to be moderate, good, and very good for kappa values of 0.41-0.60, 0.61-0.80, and greater than 0.80, respectively (5). For each observer, diagnostic sensitivity, specificity, and accuracy were calculated for the localization based on T2W-MRI alone and combined with additional DCE-MRI maps. The McNemar test was performed on a commercial statistical package (SAS 9.2; SAS Institute Inc., Cary, NC, USA) to evaluate the differences in these diagnostic values. P < 0.05 was considered statistically significant.
Results
Tumor characteristics
Pathological examination confirmed malignant bladder tumors in twenty-eight patients and no malignancy in the other eight patients at the time of cystectomy. Of the eight negative patients, two did not have chemotherapy (transurethral resection of bladder tumor (TURBT) before baseline MRI may have removed all tumors from the patients), and six completed all four cycles of chemotherapy. Of the twenty-eight positive patients, eleven did not have chemotherapy, and seventeen had chemotherapy. A total of thirty-six malignant tumors were found by pathology. Four positive patients had two or more malignant lesions. The T stage was reported only for the most invasive lesion in multi-lesion patients. All malignant tumors were found to be of high grade by pathology except three tumors whose grades were not reported. The longest measurable tumor diameter ranged from 1 mm to 100 mm with a median of 26 mm. Tumor characteristics were summarized in Table 1.
Table 1.
Tumor Characteristics
| Stage | Number of cases |
| Tis/Ta | 2 (7%) |
| T1 | 3 (11%) |
| T2 | 11 (39%) |
| T3 | 8 (29%) |
| T4 | 4 (14%) |
| Number of malignant tumors per case | Number of cases |
| 1 | 24 (86%) |
| 2 | 1 (3.5%) |
| 3 | 2 (7%) |
| 4 | 1 (3.5%) |
| Size | Number of malignant tumors |
| ≤ 1cm | 7 (19%) |
| > 1cm | 20 (56%) |
| NA* | 9 (25%) |
| Configuration | Number of malignant tumors |
| Solid | 19 (53%) |
| Papillary | 8 (22%) |
| Lobulated | 1 (3%) |
| NA* | 8 (22%) |
Not reported
Localization of malignant tumors in the whole patient cohort
On T2W MR Images, twenty-nine of thirty-six malignant lesions were identified by observer 1 and twenty-six by observer 2 (Figures 2 and 3). Both observers confirmed five of eight negative cases. In the three false positive cases, the benign bladder wall thickening was misdiagnosed as a malignant tumor. The sensitivity, specificity, and accuracy of bladder cancer localization using T2W-MRI alone were 81% (29/36), 63% (5/8) and 77% (34/44) for observer 1, and 72% (26/36), 63% (5/8), and 70% (31/44) for observer 2. The kappa score for the evaluation of interobserver agreement was 0.63 (95% CI: 0.38-0.88).
Figure 3.
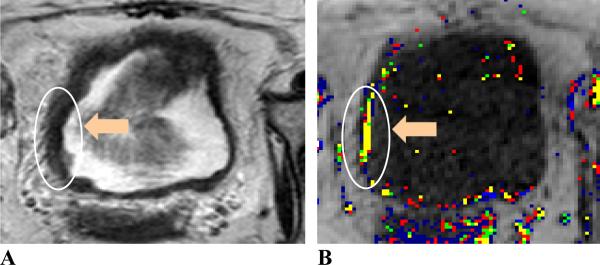
MR images of a 63 year-old female patient. Image A, axial T2W image; image B, Amp+kep map. The patient was treated with chemotherapy. Tumor location (indicated by orange arrows and enclosed in white contours) is at the right aspect of the bladder wall. Tumor stage: T2; size: 24 mm. The malignant tumor was differentiated from the bladder wall thickening with an irregular margin and different signal intensity on the T2W image. The continuous color pixels on the color Amp and kep map further confirmed the tumor location.
With the addition of color-coded DCE-MRI maps, thirty-three malignant tumors were identified by both observers (Figures 2, 3 and 4). Six negative cases were confirmed by observer 1 and five by observer 2. The sensitivity, specificity, and accuracy were 92% (33/36), 75% (6/8), and 89% (39/44) for observer 1, and 92% (33/36), 63% (5/8), and 86% (38/44) for observer 2. The kappa score increased to 0.78 (95% CI: 0.55-1.00) with additional DCE-MRI maps.
Figure 4.
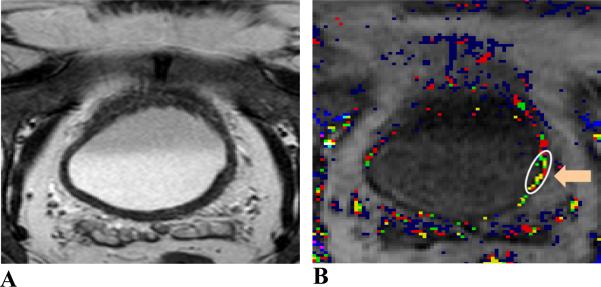
MR images of a 68 year-old male patient. Image A, axial T2W image; image B, Amp+kep map. The patient was treated with chemotherapy. Tumor location (indicated by an orange arrow and enclosed in a white contour) is located at the left and posterior aspect of the bladder wall. Tumor stage: T2; size: 9 mm. The malignant tumor with a smooth margin was not visualized on the T2W image. The malignancy was identified with continuous color pixels on the DCE-MRI map. This malignancy was both sub-centimeter and within the bladder wall thickening.
Compared to T2W-MRI alone, the addition of DCE-MRI maps significantly (P < 0.01) improved the sensitivity and accuracy of bladder cancer localization by observer 2. Additional DCE-MRI also increased the sensitivity and accuracy of the localization by observer 1, however, not significantly (P=0.1 for sensitivity and P=0.06 for accuracy).
Localization of malignant tumors in patients treated with chemotherapy
Twenty-three patients were treated with neoadjuvant chemotherapy. Seventeen were positive for malignancy with a total of twenty malignant tumors confirmed by pathology. Six were negative for malignancy. For the population of chemotherapy-treated patients, the sensitivity, specificity, and accuracy of bladder cancer localization with T2W-MRI alone were 70% (14/20), 50% (3/6) and 65% (17/26) for observer 1, and 55% (11/20), 50% (3/6), and 54% (14/26) for observer 2. Adding DCE-MRI data produced a sensitivity, specificity, and accuracy of 90% (18/20), 67% (4/6), and 85% (22/26) for observer 1, and 85% (17/20), 50% (3/6), and 77% (20/26) for observer 2. The addition of DCE-MRI maps significantly (P < 0.02) improved the sensitivity and accuracy for observer 2 as compared to T2WMRI alone. For observer 1, the differences were not found to be significant (P=0.1 for sensitivity, and P=0.06 for accuracy).
Localization of sub-centimeter tumors
Seven (19%) out of thirty-six malignant lesions were sub-centimeter (less than 1 cm in the longest measurable diameter). The two radiologists localized four (57%, 95% CI: 18%-90%) sub-centimeter tumors on T2W images alone. With additional pharmacokinetic DCE-MRI maps, there were six (86%, 95% CI: 42%-100%) sub-centimeter lesions identified by the two observers (Figure 4). Using additional DCE-MRI maps increased the number of identified sub-centimeter tumors by 50%.
Delineation of malignant tumors within the bladder wall thickening
Eleven (28%) of thirty-six malignant tumors were found within bladder wall thickening. These eleven tumors were found in seven patients (six treated with chemotherapy). On T2W images, six (55%, 95% CI: 23%-83%) malignant tumors with an irregular margin and different signal intensity were differentiated from the bladder wall thickening (Figure 3). The other five tumors had smooth margins and were isointense within the bladder wall, thus, not identified on T2W images. When DCE-MRI maps were added, a total of ten (91%, 95% CI: 59%-100%) malignant tumors, including four of the five T2W-missed tumors, were differentiated from the benign bladder wall thickening (Figures 3 and 4). Adding DCE-MRI data significantly improved the delineation of malignant tumors within the benign bladder wall thickening (P<0.05).
Of eleven malignant tumors within bladder wall thickening, three were sub-centimeter and not identified on T2W images. These three tumors were all identified with pharmacokinetic parameter maps available.
Discussion
Accurate diagnosis of bladder cancer remains a challenge in bladder cancer imaging (4, 5, 20-22). In bladder cancer localization, a previous study of multidetector CT with multiplanar reformatted imaging and virtual cystoscopy had a high sensitivity of 94% in comparison with conventional cystoscopy (4). However, this study revealed that conventional cystoscopy had discrepancies with histopathology (4). Catheter-assisted 18F-FDG-PET/CT imaging using standardized bladder flushing and filling presented with a sensitivity of 63% (23). 11C-acetate PET/CT had a sensitivity of 80% (8 out of 10 malignant tumors) (24). Ultrasound was limited in identifying bladder tumors on the bladder floor and fundus (20, 21), with a reported sensitivity of 66% using micro-bubble contrast enhancement vs. 61% without contrast (21). Our MRI study used histopathological findings as a reference standard and found a sensitivity of 81% (observer 1) and 72% (observer 2) with T2W-MRI alone and an improved sensitivity of 92% (both observers) with the additional use of DCE-MRI maps for the localization of bladder cancer.
High field 3T MRI has been shown to be better than 1.5T MRI in the spatial and temporal resolution (9), signal-to-noise ratio (11), contrast-to-noise ratio (12), and the differentiation of cancer from normal tissues (13). 3D T1-Weighted DCE-MRI at 3T has been shown to produce higher signal contrast between tumor and normal brain tissues than 1.5T (14), and aid in quantitative assessment of cerebral blood flow, cerebral blood volume, and permeability in MS lesions (25). Our study evaluated the capability of 3T MRI with DCE mapping in the localization of bladder cancer and demonstrated that 3T high-resolution T2W-MRI enabled the identification of sub-centimeter malignant tumors and the tumors within the bladder wall thickening. The addition of functional DCE-MRI maps provided further delineation of sub-centimeter tumors (86%) as well as the tumors within the bladder wall thickening (91%) to improve the sensitivity and accuracy of bladder cancer localization.
Contrast-enhanced MRI has been shown to have good interobserver agreement and high accuracy in the diagnosis of bladder cancer (8). Our study reported a similar result in the interobserver agreement of bladder cancer diagnosis using DCE-MRI. Adding DCE-MRI increased the Kappa score from 0.63 to 0.78, suggesting that a combined reading further improves the robustness of the radiological interpretation.
Pelvic imaging at 3T has traditionally been limited due to field inhomogeneity (16) which was overcome in this study by using an advanced 32-channel coil and utilizing multi-transmit acquisition to achieve consistently good diagnostic image quality. Our prior pilot work (unpublished) had already demonstrated that the application of multi-transmit acquisition obtained after less-than-one-minute B1 mapping enables a consistent substantial improvement of image quality. Thus, in this prospective study, we have used the multi-transmit acquisition approach which also has become our standard clinical procedure for 3T imaging.
The presence of bladder wall thickening including inflammatory and fibrous changes after chemotherapy has been reported to lower the accuracy of bladder cancer diagnosis with cystoscopy (26, 27), CT (22), ultrasonography (28) and 1.5T MRI (8, 29, 30). The patient cohort in our study included patients with TURBT only and patients with both TURBT and chemotherapy. Using T2W-MRI alone, the sensitivity, specificity, accuracy of bladder cancer localization for chemotherapy-treated patients were substantially smaller than those for the whole patient cohort (70%/50%/65% vs. 81%/63%/77% for observer 1, and 55%/50%/54% vs. 72%/63%/70% for observer 2). This has also demonstrated the negative impact of chemotherapy-induced bladder wall thickening on the localization of bladder cancer. The addition of DCE-MRI significantly improved the differentiation of malignant tumors from the bladder wall thickening to alleviate the negative impact of neoadjuvant chemotherapy on the localization of bladder cancer. Accompanied by good interobserver agreement, the localization of bladder cancer in the whole patient cohort had a sensitivity of 92% for both observers with the additional use of DCEMRI maps.
The most common pharmacokinetic models used to assess DCE-MRI are the linear two-compartment model proposed by Tofts (31) and the one by Brix (17). Due to its limitation (18), Brix's model has recently been less often applied to process DCE-MRI than Tofts's model. The modification to Brix's model proposed by Yang (18) solved the limitation in order to acquire pharmacokinetic parameters that have comparative tissue specificity to those derived with the Tofts's model. Compared to fast injection of the contrast agent, the slow injection used in our study allows a better delineation of wash-in phase which is characterized by the pharmacokinetic parameter kep. Using the modified Brix's model to process DCE-MRI data, our study has demonstrated the reliability of the model for the characterization and assessment of bladder cancer.
Our study had several limitations: First, the number of negative cases (N=8) was small. This small number may have been the factor that did not allow the demonstration of the significant improvement of specificity with additional DCE-MRI maps. A larger number of cases will be needed in subsequent studies to both solidify our findings and further demonstrate the diagnostic value of DCE-MRI. Second, the correlation between the radiological read and the pathological examination was in some cases challenging due to the lack of the 3D matching between pathological and radiological localization. This limitation can be resolved with an approach to 3D matching and specimen MR imaging. Third, not all patient's bladders were fully distended at the time of imaging. The research protocol which was composed of conventional imaging and different functional imaging techniques required a long scan time (1 hour). Therefore, a fully distended bladder, in some cases, caused the interruption of MRI exams. The future study will be performed with a more refined protocol to reduce the scan time, which allows maintaining a fully-distended bladder.
In conclusion, multi-transmit 3T DCE-MRI improves the interobserver agreement and the characterization of malignant bladder tumors, especially small tumors and those within bladder wall thickening. 3T MRI with DCE mapping appears to be a promising approach to substantially improve bladder cancer imaging beyond the current limitations of cystoscopy and CT.
Acknowledgments
Sources of support This study is supported by Wright Center of Innovation in Biomedical Imaging and The Ohio State University medical center imaging signature program.
References
- 1.Verma S, Rajesh A, Prasad SR, Gaitonde K, Lall CG, Mouraviev V, Aeron G, Bracken RB, Sandrasegaran K. Urinary bladder cancer: role of MR imaging. Radiographics. 2012;32(2):371–387. doi: 10.1148/rg.322115125. [DOI] [PubMed] [Google Scholar]
- 2.American Cancer Society . Cancer Facts & Figures 2013. American Cancer Society; Atlanta, Ga: 2013. [Google Scholar]
- 3.Chang JS, Lara PN, Jr., Pan CX. Progress in personalizing chemotherapy for bladder cancer. Adv Urol. 2012;2012:364919. doi: 10.1155/2012/364919. [DOI] [PMC free article] [PubMed] [Google Scholar]
- 4.Amin MF, Abd El Hamid AM. The diagnostic accuracy of multidetector computed tomography with multiplanar reformatted imaging and virtual cystoscopy in the early detection and evaluation of bladder carcinoma: comparison with conventional cystoscopy. Abdom Imaging. 2012 doi: 10.1007/s00261-012-9902-6. [DOI] [PubMed] [Google Scholar]
- 5.Tritschler S, Mosler C, Tilki D, Buchner A, Stief C, Graser A. Interobserver variability limits exact preoperative staging by computed tomography in bladder cancer. Urology. 2012;79(6):1317–1321. doi: 10.1016/j.urology.2012.01.040. [DOI] [PubMed] [Google Scholar]
- 6.Schrier BP, Peters M, Barentsz JO, Witjes JA. Evaluation of chemotherapy with magnetic resonance imaging in patients with regionally metastatic or unresectable bladder cancer. Eur Urol. 2006;49(4):698–703. doi: 10.1016/j.eururo.2006.01.022. [DOI] [PubMed] [Google Scholar]
- 7.Haider EA, Jhaveri KS, O'Malley ME, Haider MA, Jewett MA, Rendon RA. Magnetic resonance imaging of the urinary bladder: cancer staging and beyond. Can Assoc Radiol J. 2008;59(5):241–258. [PubMed] [Google Scholar]
- 8.Tekes A, Kamel I, Imam K, Szarf G, Schoenberg M, Nasir K, Thompson R, Bluemke D. Dynamic MRI of bladder cancer: evaluation of staging accuracy. AJR Am J Roentgenol. 2005;184(1):121–127. doi: 10.2214/ajr.184.1.01840121. [DOI] [PubMed] [Google Scholar]
- 9.Futterer JJ, Scheenen TW, Huisman HJ, Klomp DW, van Dorsten FA, Hulsbergen-van de Kaa CA, Witjes JA, Heerschap A, Barentsz JO. Initial experience of 3 tesla endorectal coil magnetic resonance imaging and 1H-spectroscopic imaging of the prostate. Invest Radiol. 2004;39(11):671–680. doi: 10.1097/00004424-200411000-00005. [DOI] [PubMed] [Google Scholar]
- 10.Kim CK, Kim SH, Chun HK, Lee WY, Yun SH, Song SY, Choi D, Lim HK, Kim MJ, Lee J, Lee SJ. Preoperative staging of rectal cancer: accuracy of 3-Tesla magnetic resonance imaging. Eur Radiol. 2006;16(5):972–980. doi: 10.1007/s00330-005-0084-2. [DOI] [PubMed] [Google Scholar]
- 11.Londy FJ, Lowe S, Stein PD, Weg JG, Eisner RL, Leeper KV, Woodard PK, Sostman HD, Jablonski KA, Fowler SE, Hales CA, Hull RD, Gottschalk A, Naidich DP, Chenevert TL. Comparison of 1.5 and 3.0 T for contrast-enhanced pulmonary magnetic resonance angiography. Clin Appl Thromb Hemost. 2012;18(2):134–139. doi: 10.1177/1076029611419840. [DOI] [PMC free article] [PubMed] [Google Scholar]
- 12.Notohamiprodjo M, Dietrich O, Horger W, Horng A, Helck AD, Herrmann KA, Reiser MF, Glaser C. Diffusion tensor imaging (DTI) of the kidney at 3 tesla-feasibility, protocol evaluation and comparison to 1.5 Tesla. Invest Radiol. 2010;45(5):245–254. doi: 10.1097/RLI.0b013e3181d83abc. [DOI] [PubMed] [Google Scholar]
- 13.Sertdemir M, Schoenberg SO, Sourbron S, Hausmann D, Heinzelbecker J, Michaely HJ, Dinter DJ, Weidner AM. Interscanner comparison of dynamic contrast-enhanced MRI in prostate cancer: 1.5 versus 3 T MRI. Invest Radiol. 2013;48(2):92–97. doi: 10.1097/RLI.0b013e31827bbcbe. [DOI] [PubMed] [Google Scholar]
- 14.Nobauer-Huhmann IM, Ba-Ssalamah A, Mlynarik V, Barth M, Schoggl A, Heimberger K, Matula C, Fog A, Kaider A, Trattnig S. Magnetic resonance imaging contrast enhancement of brain tumors at 3 tesla versus 1.5 tesla. Invest Radiol. 2002;37(3):114–119. doi: 10.1097/00004424-200203000-00003. [DOI] [PubMed] [Google Scholar]
- 15.Liedberg F, Bendahl PO, Davidsson T, Gudjonsson S, Holmer M, Mansson W, Wallengren NO. Preoperative staging of locally advanced bladder cancer before radical cystectomy using 3 tesla magnetic resonance imaging with a standardized protocol. Scand J Urol. 2013;47(2):108–112. doi: 10.3109/00365599.2012.721394. [DOI] [PubMed] [Google Scholar]
- 16.Willinek WA, Gieseke J, Kukuk GM, Nelles M, Konig R, Morakkabati-Spitz N, Traber F, Thomas D, Kuhl CK, Schild HH. Dual-source parallel radiofrequency excitation body MR imaging compared with standard MR imaging at 3.0 T: initial clinical experience. Radiology. 2010;256(3):966–975. doi: 10.1148/radiol.10092127. [DOI] [PubMed] [Google Scholar]
- 17.Brix G, Semmler W, Port R, Schad LR, Layer G, Lorenz WJ. Pharmacokinetic parameters in CNS Gd-DTPA enhanced MR imaging. J Comput Assist Tomogr. 1991;15(4):621–628. doi: 10.1097/00004728-199107000-00018. [DOI] [PubMed] [Google Scholar]
- 18.Yang X, Liang J, Heverhagen JT, Jia G, Schmalbrock P, Sammet S, Koch R, Knopp MV. Improving the pharmacokinetic parameter measurement in dynamic contrast-enhanced MRI by use of the arterial input function: theory and clinical application. Magn Reson Med. 2008;59(6):1448–1456. doi: 10.1002/mrm.21608. [DOI] [PubMed] [Google Scholar]
- 19.Hoffmann U, Brix G, Knopp MV, Hess T, Lorenz WJ. Pharmacokinetic mapping of the breast: a new method for dynamic MR mammography. Magn Reson Med. 1995;33(4):506–514. doi: 10.1002/mrm.1910330408. [DOI] [PubMed] [Google Scholar]
- 20.Nicolau C, Bunesch L, Sebastia C, Salvador R. Diagnosis of bladder cancer: contrast-enhanced ultrasound. Abdom Imaging. 2010;35(4):494–503. doi: 10.1007/s00261-009-9540-9. [DOI] [PubMed] [Google Scholar]
- 21.Nicolau C, Bunesch L, Peri L, Salvador R, Corral JM, Mallofre C, Sebastia C. Accuracy of contrast-enhanced ultrasound in the detection of bladder cancer. Br J Radiol. 2011;84(1008):1091–1099. doi: 10.1259/bjr/43400531. [DOI] [PMC free article] [PubMed] [Google Scholar]
- 22.Setty BN, Holalkere NS, Sahani DV, Uppot RN, Harisinghani M, Blake MA. State-of-the-art cross-sectional imaging in bladder cancer. Curr Probl Diagn Radiol. 2007;36(2):83–96. doi: 10.1067/j.cpradiol.2006.12.005. [DOI] [PubMed] [Google Scholar]
- 23.Mertens LS, Bruin NM, Vegt E, de Blok WM, Fioole-Bruining A, van Rhijn BW, Horenblas S, Vogel WV. Catheter-assisted 18F-FDG-PET/CT imaging of primary bladder cancer: a prospective study. Nucl Med Commun. 2012 doi: 10.1097/MNM.0b013e3283567473. [DOI] [PubMed] [Google Scholar]
- 24.Schoder H, Ong SC, Reuter VE, Cai S, Burnazi E, Dalbagni G, Larson SM, Bochner BH. Initial results with (11)C-acetate positron emission tomography/computed tomography (PET/CT) in the staging of urinary bladder cancer. Mol Imaging Biol. 2012;14(2):245–251. doi: 10.1007/s11307-011-0488-0. [DOI] [PubMed] [Google Scholar]
- 25.Ingrisch M, Sourbron S, Morhard D, Ertl-Wagner B, Kumpfel T, Hohlfeld R, Reiser M, Glaser C. Quantification of perfusion and permeability in multiple sclerosis: dynamic contrast-enhanced MRI in 3D at 3T. Invest Radiol. 2012;47(4):252–258. doi: 10.1097/RLI.0b013e31823bfc97. [DOI] [PubMed] [Google Scholar]
- 26.Goh AC, Lerner SP. Application of new technology in bladder cancer diagnosis and treatment. World J Urol. 2009;27(3):301–307. doi: 10.1007/s00345-009-0387-z. [DOI] [PubMed] [Google Scholar]
- 27.Lerner SP. Innovations in endoscopic imaging for bladder cancer. Eur Urol. 2009;56(6):920–922. doi: 10.1016/j.eururo.2009.07.043. [DOI] [PubMed] [Google Scholar]
- 28.Akimoto T, Matsumoto M, Mitsuhashi N, Mashimo T, Niibe H. Evaluation of effect of treatment for invasive bladder cancer by ultrasonography with intra-arterial infusion of carbon dioxide microbubbles. Invest Radiol. 1997;32(7):396–400. doi: 10.1097/00004424-199707000-00005. [DOI] [PubMed] [Google Scholar]
- 29.Nishimura K, Fujiyama C, Nakashima K, Satoh Y, Tokuda Y, Uozumi J. The effects of neoadjuvant chemotherapy and chemo-radiation therapy on MRI staging in invasive bladder cancer: comparative study based on the pathological examination of whole layer bladder wall. Int Urol Nephrol. 2009;41(4):869–875. doi: 10.1007/s11255-009-9566-5. [DOI] [PubMed] [Google Scholar]
- 30.El-Assmy A, Abou-El-Ghar ME, Mosbah A, El-Nahas AR, Refaie HF, Hekal IA, El-Diasty T, Ibrahiem eH. Bladder tumour staging: comparison of diffusion- and T2-weighted MR imaging. Eur Radiol. 2009;19(7):1575–1581. doi: 10.1007/s00330-009-1340-7. [DOI] [PubMed] [Google Scholar]
- 31.Tofts PS, Brix G, Buckley DL, Evelhoch JL, Henderson E, Knopp MV, Larsson HB, Lee TY, Mayr NA, Parker GJ, Port RE, Taylor J, Weisskoff RM. Estimating kinetic parameters from dynamic contrast-enhanced T(1)-weighted MRI of a diffusable tracer: standardized quantities and symbols. J Magn Reson Imaging. 1999;10(3):223–232. doi: 10.1002/(sici)1522-2586(199909)10:3<223::aid-jmri2>3.0.co;2-s. [DOI] [PubMed] [Google Scholar]