

Abstract
Monitoring allograft health is an important component of posttransplant therapy. Endomyocardial biopsy is the current gold standard for cardiac allograft monitoring but is an expensive and invasive procedure. Proof of principle of a universal, noninvasive diagnostic method based on high-throughput screening of circulating cell-free donor-derived DNA (cfdDNA) was recently demonstrated in a small retrospective cohort. We present the results of a prospective cohort study (65 patients, 565 samples) that tested the utility of cfdDNA in measuring acute rejection after heart transplantation. Circulating cell-free DNA was purified from plasma and sequenced (mean depth, 1.2 giga–base pairs) to quantify the fraction of cfdDNA. Through a comparison with endomyocardial biopsy results, we demonstrate that cfdDNA enables diagnosis of acute rejection after heart transplantation, with an area under the receiver operating characteristic curve of 0.83 and sensitivity and specificity that are comparable to the intrinsic performance of the biopsy itself. This noninvasive genome transplant dynamics approach is a powerful and informative method for routine monitoring of allograft health without incurring the risk, discomfort, and expense of an invasive biopsy.
Introduction
Accurate and timely diagnosis of allograft rejection is essential for long-term survival of solid organ transplant recipients. Current methods for the diagnosis of rejection, however, suffer from numerous drawbacks. The endomyocardial biopsy remains the gold standard for acute rejection surveillance after heart transplantation, but this invasive technique suffers from interobserver variability, high cost, potential complications, and significant patient discomfort (1, 2). Cell-free donor-derived DNA (cfdDNA) is detectable in both the urine and blood of transplant recipients (3, 4) and has been proposed as a candidate marker for noninvasive diagnosis of graft injury (4–6). For female recipients of a graft from a male donor, donor-specific DNA can be identified using molecular assays targeting the Y chromosome (4, 7, 8). Recently, we introduced a method called “genome transplant dynamics” (GTD) that quantifies donor-specific DNA, regardless of the sex of the transplant donor or recipient (9). This method takes advantage of single-nucleotide polymorphisms (SNPs) distributed across the genome to discriminate donor and recipient DNA molecules. In a retrospective study (7 patients, 43 samples), increased levels of donor-derived DNA were shown to correlate with acute cellular rejection (ACR) events as determined by endomyocardial biopsy (9).
Here, we present the results of a prospective cohort study that evaluated the performance of donor-derived cfdDNA to measure allograft rejection after heart transplantation. We analyzed 565 plasma samples collected longitudinally from 65 adult and pediatric transplant recipients. Comparison to endomyocardial biopsy results (356 samples) indicated that GTD can be used for the discrimination of rejecting and nonrejecting grafts and demonstrated the utility of the technique for the detection of ACR and AMR (antibody-mediated rejection) in adult and pediatric heart transplant recipients, as well as in patients requiring a second heart transplant. Our findings indicate that cfdDNA measurements have the potential to replace the endomyocardial biopsy and that these measurements can possibly be used for other aspects of patient management, such as predicting rejection events and managing immunosuppressant dosing.
Results
We performed a prospective cohort study to characterize the utility of cfdDNA in detecting acute rejection after heart transplantation (Fig. 1). A total of 21 pediatric and 44 adult patients were recruited while awaiting heart transplantation (table S1). The genomes of the transplant donors and recipients were characterized using SNP genotyping (Fig. 2A). Plasma samples (n = 565) were collected longitudinally from transplant recipients at scheduled visits starting on the second week after transplant. For a subset of patients (n = 9), plasma samples were also collected on the first day and first week after transplant to investigate the occurrence and dynamics of early graft injury and recovery.
Fig. 1. Enrollment of patients, collection of clinical samples, and analysis workflow.
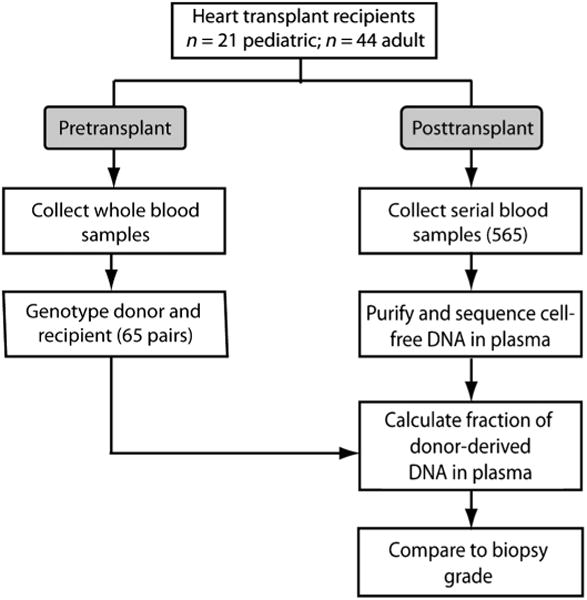
Sixty-five heart transplant recipients were enrolled in the study (table S1). Donor and recipient pretransplant whole-blood samples were collected and processed for genotyping. Plasma samples were collected longitudinally after transplant, and circulating cell-free DNA was purified and sequenced. The fraction of cfdDNA was estimated and compared against biopsy scores (n = 356).
Fig. 2. Principle of the assay and assignment and read statistics.
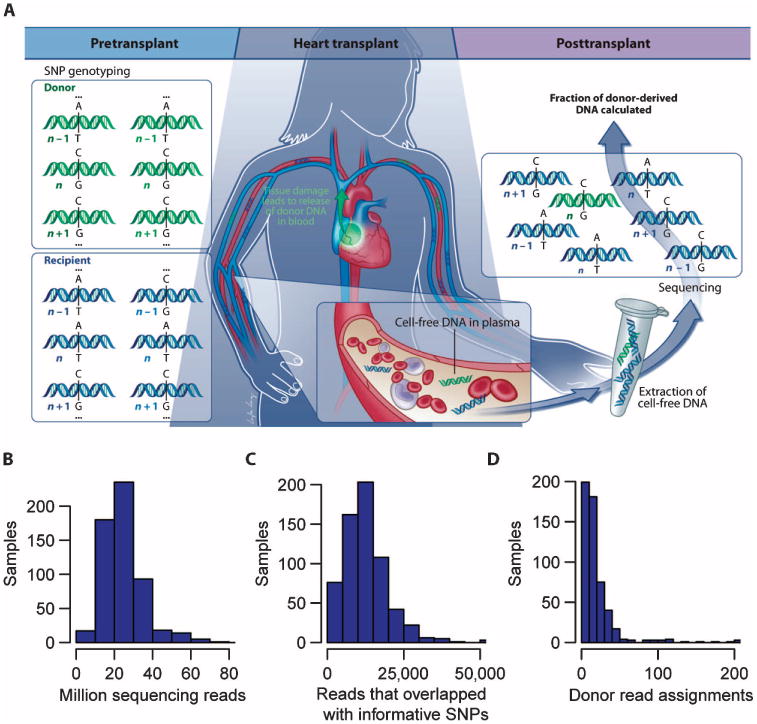
(A) Working principle of the assay. The donor and recipient were SNP-genotyped before the transplant procedure. Shotgun sequencing of circulating cell-free DNA is performed to count the number of donor- and recipient-derived DNA molecules. SNP positions with single-base alleles that were distinct between the donor and recipient and homozygous within each individual allowed discrimination of donor- and recipient-derived sequences (position “n” in the cartoon, but not positions “n − 1” and “n + 1”). (B) Histogram of sequencing depth (24.7 ± 11 million reads, mean ± SD). (C) Histogram of number of reads that overlap with informative SNP positions. (D) Histogram of the number of donor sequence assignments, ND. Data in (B) to (D) are from 565 patient samples.
Identification of donor-specific DNA
Figure 2A illustrates the working principle of the assay used to quantify the fraction of cfdDNA. Circulating cell-free DNA was purified from plasma samples collected after transplant and sequenced [mean depth = 1.2 giga–base pairs (Gbp), 24 million 50-bp reads per sample] (Fig. 2B). The SNP genotyping information obtained before transplant was used to discriminate donor- and recipient-derived sequences. SNPs were selected from single-base alleles that were distinct between donor and recipient and homozygous within each individual (marker n in Fig. 2A). On average, 53,423 informative SNP markers were available per genotype pair. Figure 2C shows a histogram of the number of reads that overlapped with informative SNPs across all samples (mean, 13,378 SNPs). The donor fraction was calculated as ND/N, where N is the total number of assignments made in sequencing, and ND is the number of donor-derived sequences. A histogram of the number of donor assignment, ND, is shown in Fig. 2D.
Rate of incorrect sequence assignments
Errors introduced in sequencing and genotyping can potentially give rise to incorrect donor or recipient assignments. It is possible to independently measure the frequency of incorrect assignments for a given sample by examining SNP positions for which both the donor and recipient are homozygous and carry the same allele (average of 384,069 SNP positions per sample; for example, n + 1 in Fig. 2A). The frequency of erroneous calls is then proportional to the frequency at which a base other than the donor and recipient allele is measured at these homozygous positions (see Materials and Methods). We analyzed the measured error rate as a function of the base call error probability reported by the sequencer (fig. S1). The measured error rate matched the predicted error rate for bases with high error rate. At a lower error rate (<5 × 10⁻⁴), the measured error rate was independent of the reported base call error rate, indicating that the measured error rate in this regime is dominated by either polymerase chain reaction (PCR) or genotyping errors.
Figure 3A shows a histogram of the measured error rates for the different samples in the cohort after removal of the low-quality sequencing calls. The median error rate was 0.04%, and 94% of samples had a measured error rate of <0.15% (n = 565). A subset of samples (2.5%) had error rates higher than 1%, which may be related to technical errors or sample-to-sample contamination. The error rate measurement allowed us to identify these samples and exclude these from the analysis (see Performance analysis section in Results).
Fig. 3. Rate of incorrect donor or recipient sequence assignments.
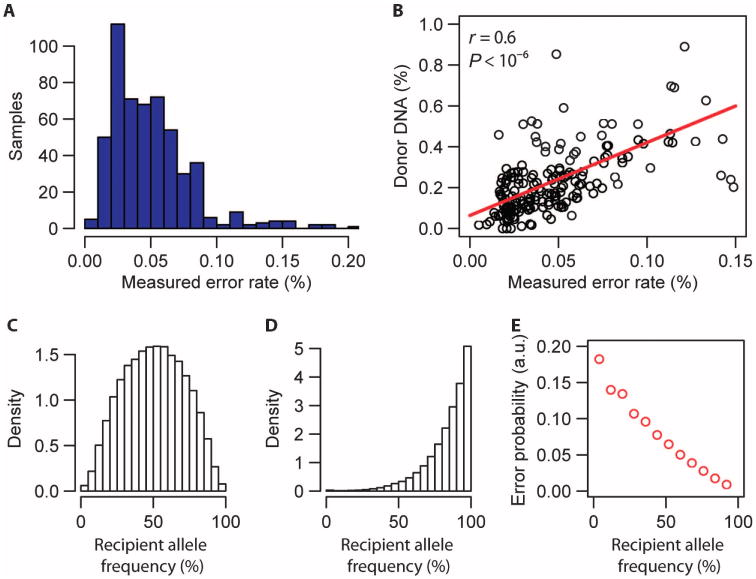
(A) Histogram of the measured per-sample error rate (error rates <0.2%, n = 540). (B) Linear correlation between the measured donor DNA fraction for patients at quiescence (biopsy score 0, n = 185) and measured error rate (Spearman correlation coefficient, r). The red line is a linear fit, slope (a) = 3.6 ± 0.36 (linear regression, t value slope = 9.4). (C) Histogram of the recipient allele frequency (frequency of occurrence in the human population) for SNP markers that were used to discriminate donor- and recipient-derived sequences and to measure the cfdDNA fraction (n = 7 patients, all markers). Here, SNPs were selected for which both the donor and recipient were homozygous and carried a different allele (for example, marker n in Fig. 2A). Allele frequency data were obtained from http://hgdownload.cse.ucsc.edu/goldenPath/hg19/database/. (D) Histogram of the recipient allele frequency for SNP markers that were used to extract the matched error rate (n = 7 patients, all markers). Here, SNPs were selected for which donor and recipient were homozygous and carried the same allele (for example, marker n + 1 in Fig. 2A). (E) Probability of a matched error as function of the recipient allele frequency (n = 42,188 measurements). a.u., arbitrary units.
The vast majority of sequences of cfdDNA in heart transplants are recipient-derived (>90%); therefore, the net effect of assignment errors (recipient sequences assigned to the donor, or donor sequences assigned to the recipient) is an overestimate of the donor fraction, and the overestimate of the donor fraction is expected to scale linearly with the rate of erroneous assignments. We, indeed, found a linear correlation between the measured error rate and the measured donor fraction (Fig. 3B, absence of biopsy-defined rejection; Spearman correlation coefficient, r = 0.6; P < 10−6). A linear fit revealed a slope greater than 1 (a = 3.6). The scaling with a > 1 is a consequence of (i) the dependence of the probability of an erroneous assignment on the frequency of occurrence of the allele in the population, as expected for genotyping assays, and (ii) differences in the distribution of allele frequencies for the set of SNPs used to evaluate the donor fraction and the matched error rate, respectively: SNPs that were used to estimate the donor fraction (for example, marker n in Fig. 2A) had a lower average recipient allele frequency (mean recipient allele frequency, 50.6%) than SNP markers that were used to estimate the error rate (mean recipient allele frequency, 83.5%; for example, marker n + 1 in Fig. 2A).
We have calculated the expected scaling factor from the measured distributions of allele frequencies for the different set of SNPs (Fig. 3, C and D) and the measured allele frequency dependence of the error rate (Fig. 3E) and found atheor = 3.7, in close agreement with the empirically determined factor used in the signal analysis, a = 3.6. We used these data to correct the measured fraction of cfdDNA by subtracting a factor c = aε, where ε is the measured error rate.
Time courses and rejection cases
Using this workflow, we established the variability and time dependence of the observed cfdDNA levels in the absence of biopsy-defined acute rejection. To explore the occurrence and dynamics of early graft injury and recovery, we collected blood samples on days 1 and 7 after transplant in a subset of adult heart transplant recipients (n = 9). The donor-derived DNA fraction was elevated on the first day after transplant (3.8 ± 2.3%, mean ± SD) and decayed within 1 week to a low baseline level (0.06 ± 0.11%), where it remained throughout year 1 (Fig. 4A). The data for all patients were fit assuming a single exponential decay process to estimate the decay rate [y = Ae(−t/τ0) + B, where τ0 ≈ 2.4 days, A = 5.7, and B = 0.075]. The rapid clearance of cfdDNA after the transplant procedure and the stable baseline observed for rejection-free samples made it possible to implement a time-independent threshold for the diagnosis of acute rejection for samples collected more than 2 weeks after the transplant.
Fig. 4. Time dependence of cfdDNA fraction in the absence of rejection, and three examples of acute rejection.
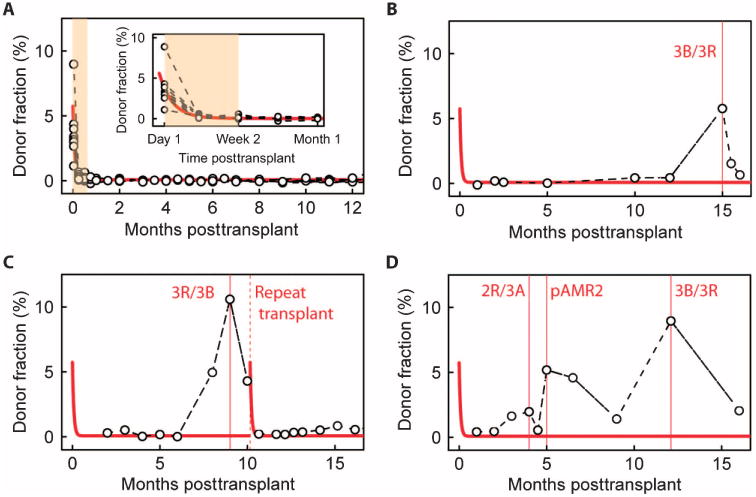
(A) Fraction of cfdDNA as function of time after transplant for nine rejection-free heart transplant recipients. Solid line is a fit to a single exponential decay model, y = Ae(−t/τ0) + B. Best-fit values (least squares): A = 5.7, B = 0.075, τ0 = 2.4 days. (B to D) Time course for transplant recipients who suffered from an acute rejection episode. Solid line is fit from (A). (B) An adult recipient with an ACR episode at month 15. (C) An adult recipient who suffered from an ACR episode (month 9) and subsequently required a new heart transplant (month 10). (D) A pediatric heart transplant recipient who suffered from consecutive ACR (months 4 and 12) and AMR (month 5) episodes.
We next analyzed cfdDNA time courses for three patients who suffered from moderate to severe ACR (biopsy grade ≥2R/3A) and/or AMR. The time course of cfdDNA levels observed for these three patients deviated from what was observed in nonrejecting individuals (indicated by the solid lines, fit to data in Fig. 4A). In the first case (Fig. 4B), an elevated donor fraction was recorded at month 15 (cfdDNA = 5.75%), coinciding with a biopsy-defined 3R/3B acute rejection episode. In a second case (Fig. 4C), the donor-derived DNA fraction was quantified as >10%, coinciding with a 3R/3B rejection event (month 9). This patient required repeat heart transplantation after month 10 owing to development of severe cardiac allograft vasculopathy. After the second transplant, the donor-derived DNA signal returned to a low level and the measured error rate did not significantly alter (mean error, 0.46 before and 0.5 after the new transplant; P = 0.5, Mann-Whitney U test). This case indicates that measurements of donor-derived cfDNA are not confounded by residual chimerism from a previous allograft. In a final example (Fig. 4D), elevated donor DNA fractions were observed in a patient with consecutive episodes of ACR (month 4, 2R/3A; month 12, 3R/3B; donor fractions, 2.0 and 9.0%, respectively) and AMR (month 4; donor fraction, 4.9%). This example illustrates the application of this technique for detection of both ACR and AMR events.
Performance analysis
We next analyzed the performance of the GTD approach for acute rejection diagnosis through a direct comparison with endomyocardial biopsy data. We excluded samples with high technical error from the analysis (measured error rate, >0.15%; 31 samples; Fig. 3A) and samples with low total number of donor and recipient assignments (number of assignments, <1000; 5 samples). Given the elevated levels of cfdDNA immediately after transplant, we further excluded samples collected during the first 14 days after transplant (shaded area in Fig. 4A). Samples drawn after an acute rejection event were also excluded to account for the slow return to baseline of cfdDNA levels after the occurrence of a rejection episode, for instance, months 15.5 and 16 (Fig. 4B), month 10 (Fig. 4C), and month 16 (Fig. 4D).
The enrolled patients had a total of 356 endomyocardial biopsies during the study period. Biopsies were graded according to the International Society for Heart and Lung Transplantation (ISHLT) standardized cardiac biopsy grading scheme (10). Levels of cfdDNA were significantly less for stable transplant recipients (biopsy grade 0) than for recipients diagnosed with mild ACR (grade ≥1R/1A and <2R/3A) and recipients diagnosed with moderate or severe ACR (grade ≥2R/3A or AMR) (Fig. 5A). The cfdDNA levels were significantly higher for heart transplant recipients during acute rejection and correlated with the severity of the rejection episode as determined by biopsy (comparing biopsy grades 0 and 1R/1A and biopsy grades 0 and ≥2R/3A or AMR).
Fig. 5. Performance of cfdDNA as a marker for heart transplant rejection.
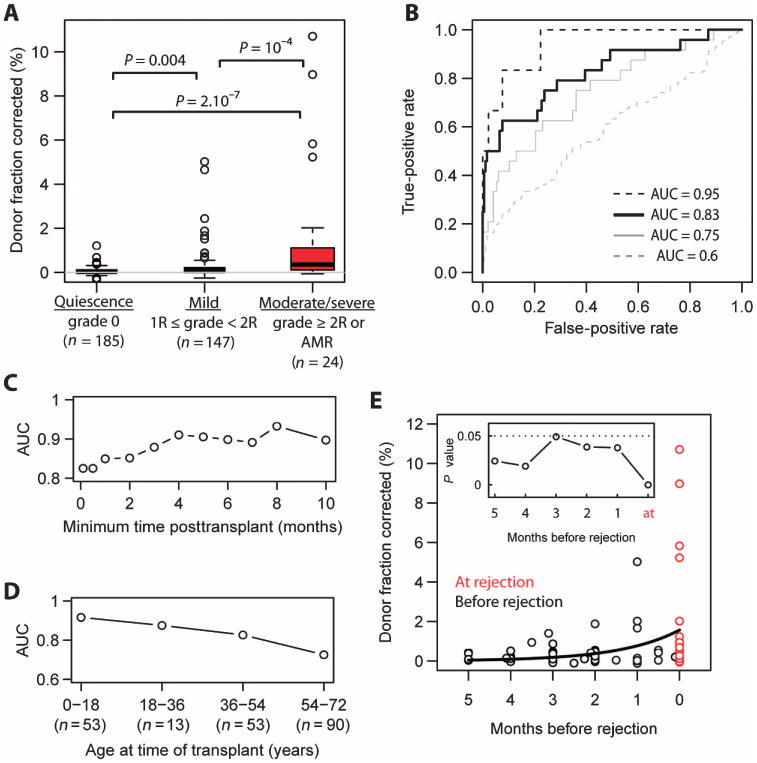
(A) Box plots of the fraction of cfdDNA for stable heart transplant recipients (biopsy grade 0), recipients diagnosed with mild rejection (1R/1A ≤ grade < 2R/3A), and recipients diagnosed with moderate-to-severe rejection (grade ≥2R/3A or AMR). P values were determined by Mann-Whitney U test. n is the number of samples for each group. The measured donor fraction was corrected by subtracting a factor aε, where a is the slope of the linear fit in Fig. 3B (a = 3.6) and ε is the measured error rate. (B) ROC analysis of the performance of cfdDNA in classifying moderate-to-severe rejecting (AUC 0.83, black solid line) and nonrejecting recipients (grade 0). Also shown are ROC curves that analyze the performance of the cfdDNA assay in distinguishing moderate-to-severe rejection versus mild rejection events (AUC = 0.75, gray solid line), mild rejections versus the absence of rejection (AUC = 0.6, gray dashed line), and severe rejection events (3B/3R, n = 6) versus the absence of rejection (AUC 0.95, black dashed line). (C) Test performance [AUC, 0 versus moderate-to-severe, black solid line in (B)] as a function of time after transplant, after which samples were taken into account. (D) AUC as a function of the age of the recipient at the time of transplant. (E) Potential for early diagnosis. The donor DNA level before the diagnosis of a moderate-to-severe rejection episode (grade ≥2R/3A or AMR, red data points). Black line, single-exponent fit: y = Ae(t/τ0), with best-fit values (least squares) of A = 1.6 and τ0 = 43 days. Inset: P values for all 1-month time periods tested (Mann-Whitney U test).
A receiver operating characteristic (ROC) analysis of the performance of cfdDNA as a marker of ACR (≥2R/3A or AMR) yielded an area under the curve (AUC) of 0.83 (sensitivity = 0.58 and specificity = 0.93 at a cfdDNA threshold level of 0.25%) (Fig. 5B). An ROC analysis of the performance of cfdDNA in distinguishing moderate-to-severe (n = 24) and mild rejection events (n = 147) yielded an AUC of 0.75 (Fig. 5B, solid gray line). An ROC analysis of the performance of cfdDNA in distinguishing mild rejection (biopsy grade ≥1R/1A and <2R/3A, n = 47) from the absence of rejection (biopsy grade 0, n = 185) yielded an AUC = 0.6 (Fig. 5B, dashed gray line). Last, an ROC analysis of the performance of cfdDNA in distinguishing severe rejection events (3B/3R, n = 6) from the absence of rejection yields an AUC of 0.95 (Fig. 5B, dashed black line).
Elevated levels of donor DNA were detected throughout the post-transplant course for a patient transplanted owing to giant cell myocarditis (fig. S2). The patient had a complicated course with a severe norovirus infection at month 7 and clinical suspicion for recurrent myocarditis versus sarcoidosis at 1.5 years after transplant. At year 2, both ACR and AMR were diagnosed on biopsy. In view of the complicated and unusual posttransplant course experienced by this patient, and the uncertainty that remained about the clinical course, we decided not to include data for this subject in the analysis of the detection quality of cfdDNA (Fig. 5). The AUC, sensitivity, and specificity with data including this patient were 0.818, 0.58, and 0.92, respectively, for a cfdDNA threshold of 0.25%.
Time after transplant and patient age as score-correlated variables
We analyzed the performance of cfdDNA relative to the endomyocardial biopsy as a function of both the time of collection after transplant and the age of the transplant recipient. The performance of the cfdDNA assay improved with time after transplant and was lower for early time periods (<4 months after transplant) (Fig. 5C). The performance was time-independent at ≥4 months after transplant (AUC= 0.91 for this time period). Furthermore, the concordance of the GTD results with endomyocardial biopsy grades was higher for younger patients (AUC = 0.91 for patients younger than 19 years), and the AUC (performance) progressively decreased with age (Fig. 5D).
Potential for early diagnosis of acute rejection
To investigate the potential for early diagnosis of transplant rejection, we analyzed the fraction of cfdDNA before a moderate or severe rejection episode (grade ≥2R/3A) (Fig. 5E). The cfdDNA fraction was significantly elevated for samples collected up to 5 months before the rejection event compared to samples collected at quiescence, biopsy grade “0” in Fig. 5A (P < 0.05 for 1-month time periods up to 5 months before the rejection episode, Mann-Whitney U test; inset in Fig. 5E). Data in Fig. 5E were fit to a single exponent: y = Ae(t/τ0), where best-fit values (least squares) were A = 1.6 and τ0 = 43 days.
Analysis of discordance against biopsy
To evaluate to what extent the detection quality reported here is limited by imperfections of the gold standard, we have analyzed the five most significant discordant results among data corresponding to biopsies graded as “quiescent,” “at mild rejection,” or at “moderate-to-severe rejection” (Table 1; data in Fig. 5A). Several observations deserve mentioning. First, among the five greatest outliers in the group of samples with biopsy grade 0, four samples correspond to patients diagnosed with mild rejection (1R/1A) within 6 weeks of the discordant reading. Second, among the five greatest outliers in the group of mild rejections, four samples corresponded to patients who were diagnosed within 2 months with a moderate or severe ACR or AMR event (Table 1). Last, among the samples for which a low cfdDNA level was recorded, although the biopsy grade indicated a moderate rejection (2R), three patients were asymptomatic and had normal allograft function.
Table 1. Discordance with biopsy: False positives and false negatives in Fig. 5A and corresponding clinical notes.
Among the five most significant outliers (elevated cfdDNA) in the group of samples with biopsy grade 0, four samples corresponded to patients diagnosed with mild rejection (grade 1R) within 6 weeks of the discordant reading. Among the five greatest outliers in the group of mild rejections (grade 1R), four samples corresponded to patients who were diagnosed within 2 months with a moderate or severe ACR (≥2R) or AMR event. Last, among the samples for which a low cfdDNA level was recorded, although the biopsy grade indicated a moderate rejection (2R), three patients were asymptomatic and had normal allograft function.
| Type | Patient | Months after transplant | Donor fraction corrected (%) | Endomyocardial biopsy grade | Clinical notes |
|---|---|---|---|---|---|
| False positive | A30 | 2.5 | 1.21 | 0 | Mild rejection at month 4 |
| False positive | A28 | 3 | 0.68 | 0 | Mild rejection at month 4 |
| False positive | P4 | 1 | 0.45 | 0 | |
| False positive | P13 | 1 | 0.4 | 0 | Mild rejection at month 2 |
| False positive | A16 | 0.75 | 0.4 | 0 | Mild rejection at month 1.25 |
| False positive | A28 | 8 | 5 | 1R/1B | Moderate rejection at month 9 |
| False positive | P13 | 6.5 | 4.7 | 1R/1A | AMR at month 5 |
| False positive | A25 | 16 | 2.4 | 1R/1A | |
| False positive | P20 | 10 | 2.8 | 1R/1A | Severe rejection at month 12 |
| False positive | P13 | 3 | 1.67 | 1R/1A | Moderate rejection at month 4 |
| False negative | A34 | 4 | −0.06 | 2R/3A | Normal allograft function |
| False negative | A6 | 8 | −0.02 | 2R/3A | Normal allograft function |
| False negative | A4 | 3 | 0.03 | 2R/3A | Chagas disease reactivation |
| False negative | A40 | 1 | 0.04 | 2R/3A | |
| False negative | A10 | 3 | 0.06 | 2R/3A | Normal allograft function |
Discussion
Organ transplants are also genome transplants (9)—a fact that enables the possibility of monitoring for allograft injury through measurements of cfdDNA circulating in the recipient's plasma (5,7,9,11). On the basis of the present data from a prospective cohort study, we conclude that the GTD approach is informative for detecting acute rejection after heart transplantation and that GTD has the potential to complement or replace existing biopsy-based surveillance approaches. Here, GTD had superior test performance characteristics when compared to the AlloMap test (12, 13), a commercial gene expression assay that is currently available for the noninvasive monitoring for rejection after heart transplantation [AUC cfdDNA = 0.83; AUC AlloMap = 0.72; data from (12)].
The performance of the GTD assay depends on several variables, including the time after transplant and the age of the patient. The dependence of the test detection quality may reflect age-related differences in the intensity of the immune response at rejection. The GTD assay is quantitative and therefore may allow for improved modulation and tracking efficacy of anti-rejection therapies. The data furthermore indicate the potential for early diagnosis of acute rejection, up to 5 months before detection by biopsy. Early diagnosis, before the appearance of graft damage on biopsy, may prevent severe rejection events and allograft dysfunction. Graft injury after AMR is detected, but the test is not able to distinguish graft damage from AMR versus ACR, which have different therapeutic consequences and outcomes. Hence, the GTD assay may require follow-up testing, such as biopsy or measurement of donor-specific anti–human leukocyte antigen antibodies, if rejection is determined.
The “gold standard” used for diagnosing rejection, the endomyocardial biopsy, is far from perfect. Substantial interobserver variability exists in the grading of heart biopsies (2, 14), and acute rejection may be missed when taking small biopsies of myocardial tissue, owing to the inhomogeneous nature of inflammatory infiltrates and graft damage. The concordance of biopsy interpretation among cardiac pathologists was examined in the context of the CARGO II study (14): the overall, all-grade agreement was found to be 71%, and the positive agreement for biopsies assigned a grade ≥2R was less than 30%. It is possible to infer a sensitivity and a selectivity for the biopsy from these observed rates of concordance. Considering all biopsies graded 0 and 1R as negative and biopsies graded ≥2R as positive, the estimated sensitivity of biopsy is 0.58 and the selectivity is 0.96 [data in Table 1 and (14)]. In comparing our cfdDNA data with biopsy, using a threshold of 0.25%, we find a sensitivity of 0.58 and a selectivity of 0.87 (also considering 0 and 1R biopsies together as negative and ≥2R as positive). The rate of agreement of the cfdDNA test to the biopsy is thus comparable to the rate of agreement of the evaluation of biopsies by different pathologists. Given the interobserver variability of biopsy between different pathologists, one could not expect a much better performance by any other test, even a “perfect” test. An examination of the outliers against the biopsy (Table 1) indicates that the detection quality reported here is indeed limited by imperfections of the gold standard: four of five of the top false positives reported were related to patients who suffered a mild or severe rejection within 6 weeks of the discordant reading. Similarly, three of five false negatives were associated with patients who were asymptomatic and had normal graft function.
Together, these findings suggest that elevations of cfdDNA can occur before the development of rejection on endomyocardial biopsy, and may therefore present an opportunity for early diagnosis and treatment. This finding also suggests that there may be other sources of cfdDNA in the absence of biopsy evidence of myocyte damage; one possible source is the activation and apoptosis of coronary endothelial cells—a finding that has been described at the onset of acute rejection (15). Finally, the fact that this measurement yields a quantitative result means that the test can be custom-tailored to particular questions— threshold values can be chosen to maximize sensitivity (at the expense of increasing false positives) or specificity (at the expense of sensitivity), as desired by the clinician's needs in managing patient care.
Here, we implemented shotgun DNA sequencing for the quantification of cfdDNA, taking advantage of SNP-based markers distributed across the genome to discriminate between donor- and recipient-derived molecules. This approach is applicable to sex-matched and mismatched donor-recipients pairs. Alternative modes of cfdDNA measurement, such as methods based on targeted sequencing or PCR of specific genomic markers (16, 17), may also be a fruitful application of this approach. Targeted assays have the promise of reduced cost and can, in principle, be combined with molecular bar-coding strategies that may reduce sequencing and PCR error rates (18). We note that the number of target sequences is an important consideration here, because this number defines the ultimate sensitivity limit for the assay. The shotgun sequencing approach implemented here offers intrinsically high sensitivity given the high number of informative sites (average of 53,423 informative SNPs), is independent of the underlying genetics of the transplant donor and recipient, and provides the ability to simultaneously screen for sequences derived from infectious agents, such as bacterial and viral pathogens (19). Simultaneous diagnosis of rejection and infection is important given the clinical challenge of discriminating between immunologic and nonimmunologic causes of allograft injury after transplantation.
With the numerous approaches at hand to monitor circulating cell-free DNA, we expect rapid adoption of this approach in the clinic for the measurement of organ transplant rejection (13). Routine use of the assay will require streamlining of all test components to ensure rapid (24 to 48 hours) turnaround time from blood sample collection to cfdDNA quantification. This would include automated, high-throughput DNA extraction, library preparation, and sequencing. The rapid development of automated sequencing technologies, with an associated fall in costs (20), provides added benefit for adoption of such an approach, and we are confident that shotgun sequencing–based assays will find application in many areas of clinical diagnostics. The basic principle of the assay reported is compatible with rejection diagnosis in the setting of all solid organ transplant types, as well as for the diagnosis of graft-versus-host disease after allogeneic bone marrow transplantation.
Materials and Methods
Study design
The overall goal of this study was to test the clinical utility of a cfdDNA in the diagnosis of rejection and allograft failure after heart transplantation (ClinicalTrials.gov: NCT01985412). Pediatric and adult patients listed for heart transplantation at Stanford University Hospital or Lucile Packard Children's Hospital were enrolled in the study. Multi-organ transplant recipients were excluded. Data on the fraction of cfdDNA were compared to endomyocardial biopsy results. The study was approved by the Stanford University Institutional Review Board (protocol 17666) and the Kaiser Permanente Northern California Institutional Review Board. All patients provided written informed consent. Predefined study components included the time of sample collection. Results and data collection continued until the end of the predetermined study period (September 2013). All investigators performing cfdDNA extraction, sequencing, and data analysis were blinded to the subjects' clinical status and biopsy results until cfdDNA results were finalized.
Clinical sample collection
Pretransplant whole-blood samples were collected from the donor and recipient for SNP genotyping. Plasma samples were collected longitudinally from the recipient after transplant. Blood samples were collected from heart transplant recipients at the following time points after transplant: weeks 2, 4, and 6, and months 2, 2.5, 3, 4, 5, 6, 8, 10, 12, 16, 20, and 24. A subset of heart transplant recipients also had blood samples collected on posttransplant days 1 and 7. In each case, blood samples were collected before heart biopsy, or catheterization procedures were performed.
Posttransplant therapeutic protocol
The cohort patients were treated with antiviral prophylaxis and immunosuppression in a standardized posttransplant therapy (Supplementary Methods). Maintenance immunosuppression was tacrolimus-based for the adult patients and cyclosporine-based for the pediatric patients. Information on drug treatments and dosing is described in the Supplementary Materials and summarized in table S1. See also (19).
Biopsy surveillance
All heart transplant recipients were monitored for acute rejection by surveillance endomyocardial biopsies performed at scheduled intervals after transplant: weekly during the first month, biweekly until the third month, monthly until the sixth month, and then at months 9, 12, 16, 20, and 24. Biopsies were graded according to the ISHLT 2004 revised grading scale (0, 1R, 2R, and 3R).
Plasma processing and DNA extraction
Plasma was extracted from whole-blood samples as described previously (21) and stored at −80°C. When required for analysis, plasma samples were thawed and circulating DNA was immediately extracted from 0.5 to 1 ml of plasma using the QIAamp Circulating Nucleic Acid Kit (Qiagen).
Sequencing library preparation and sequencing
Sequencing libraries were prepared from purified plasma DNA using the NEBNext DNA Library Prep Master Mix Set for Illumina with standard Illumina indexed adapters (IDT), or using a microfluidics-based automated library preparation platform (Mondrian ST, Ovation SP Ultralow Library Systems). Libraries were characterized using the Agilent 2100 Bioanalyzer (High Sensitivity DNA Kit), quantified by quantitative PCR, and sequenced (Illumina HiSeq 200 or HiSeq 2500, 1 × 50 bp or 2 × 100 bp).
Genotyping
Whole-blood samples were collected from the donor and recipient. DNA was purified from whole blood (DNeasy Blood & Tissue Kit, Qiagen) and amplified (REPLI-g Mini Kit, Qiagen). Genotyping was performed on Illumina whole-genome arrays (HumanOmni2.5-8 or HumanOmni1). We found discrepancies in the definitions of the forward and reverse strand for the hg19 genome build (used for alignment of the sequencing data) and the genotyping database for ∼1% of SNPs on the microarray. These discrepancies gave rise to systematic erroneous assignments, an issue that was resolved by removing these SNPs from the analysis.
Analysis workflow sequencing
Exact duplicates were removed from raw sequencing data sets using the C-based utility fastq.cpp. Low-quality reads were removed using the quality filter fastx package (fastq_quality_filter -Q33 -q21 -p50). The remaining reads were subsequently aligned using Burrows-Wheeler Aligner (BWA) (22) to the human reference genome build hg19 (bwa aln - q25). Reads that mapped to the same site in the genome were removed using samtools (samtools rmdup) (23). Alignments with low mapping quality were removed (awk ‘$5>35’). Sequencing information at SNP positions characterized in genotyping was collected using samtools mpileup.
SNP and base call filtering
To reduce the number of erroneous assignments, we retained only SNPs with high GenCall (>0.7) and Cluster Separation (=1) scores. The choice of the genotyping filtering parameters was found to have only a minor influence on the detection quality. On the basis of this observation, we excluded base calls with reported sequencing error rates higher than 2 × 10⁻³. The predicted base call error rate, p, was calculated from the IlluminaPhred score (Qs) as indicated in the fastq sequencing data format [p = 10(−Qs−33)/10].
Statistical analyses
The statistical analyses were performed by I.D.V. and S.R.Q. Analyses were performed in R 2.15.1. ROC analyses were performed using the ROCR package (24). Results are expressed as means ± SD of independent experiments. The groups were compared by the nonparametric Mann-Whitney U test, which has high efficiency for both normally and nonnormally distributed data sets. A value of P < 0.05 was considered statistically significant.
Supplementary Material
Methods
Fig. S1. Measured versus predicted error rate.
Fig. S2. cfdDNA time course for patient A36.
Table S1. Heart transplant recipient demographics.
Acknowledgments
We thank G. Mantalas and C. Wales for assistance with the sequencing assays and B. Passarelli for setting up and maintaining the computing infrastructure.
Funding: NIH grant RC4AI092673 and the Howard Hughes Medical Institute.
Footnotes
Supplementary Materials: www.sciencetranslationalmedicine.org/cgi/content/full/6/241/241ra77/DC1 Methods
Author contributions: I.D.V., H.A.V., T.M.S., C.S., G.C., H.L., D.B., D.W., S.R.Q., and K.K.K. contributed to the study design. C.S., G.C., and H.L. handled patient samples and collected clinical information. I.D.V., N.F.N., T.M.S., and J.O. prepared the samples for sequencing. I.D.V. performed the data analysis and analyzed statistics. I.D.V., H.A.V., K.K.K., and S.R.Q. interpreted the data and wrote the manuscript.
Competing interests: Stanford University has applied for a patent relating to the method described in this study. S.R.Q. is a founder of and consultant for ImmuMetrix, LLC, which has licensed a patent from Stanford regarding this technology and is developing this technology for the clinic. S.R.Q. and T.M.S. hold equity in ImmuMetrix Inc.
Data and materials availability: The sequence data generated in this study have been deposited in the Sequence Read Archive (SRP034946). Other patient data not included in this manuscript can be shared upon request, without purchase. The materials and data transfer agreement (MDTA) between Stanford and Kaiser Permanente is in the process of renegotiation to allow additional samples and patient follow-up beyond the initially contracted period. Language in the MDTA currently allows each party to publish freely by only giving an advance copy to the other party for review and comment limited to review for inadvertent disclosure of confidential information and patentable inventions. Kaiser Permanente is requesting inclusion of language pertaining to collaboration on the science. A materials transfer agreement is not required for transfer of materials.
References and Notes
- 1.Saraiva F, Matos V, Gonçalves L, Antunes M, Providência L. Complications of endomyocardial biopsy in heart transplant patients: A retrospective study of 2117 consecutive procedures. Transplant Proc. 2011;43:1908–1912. doi: 10.1016/j.transproceed.2011.03.010. [DOI] [PubMed] [Google Scholar]
- 2.Marboe CC, Billingham M, Eisen H, Deng MC, Baron H, Mehra M, Hunt S, Wohlgemuth J, Mahmood I, Prentice J, Berry G. Nodular endocardial infiltrates (Quilty lesions) cause significant variability in diagnosis of ISHLT grade 2 and 3A rejection in cardiac allograft recipients. J Heart Lung Transplant. 2005;24:S219–S226. doi: 10.1016/j.healun.2005.04.001. [DOI] [PubMed] [Google Scholar]
- 3.Zhang J, Tong KL, Li PK, Chan AY, Yeung CK, Pang CC, Wong TY, Lee KC, Lo YM. Presence of donor- and recipient-derived DNA in cell-free urine samples of renal transplantation recipients: Urinary DNA chimerism. Clin Chem. 1999;45:1741–1746. [PubMed] [Google Scholar]
- 4.Lo YM, Tein MS, Pang CC, Yeung CK, Tong KL, Hjelm NM. Presence of donor-specific DNA in plasma of kidney and liver-transplant recipients. Lancet. 1998;351:1329–1330. doi: 10.1016/s0140-6736(05)79055-3. [DOI] [PubMed] [Google Scholar]
- 5.Sigdel TK, Sarwal MM. Cell-free DNA as a measure of transplant injury. Clin Transpl. 2012:201–205. [PubMed] [Google Scholar]
- 6.Zhong XY, Hahn D, Troeger C, Klemm A, Stein G, Thomson P, Holzgreve W, Hahn S. Cell-free DNA in urine: A marker for kidney graft rejection, but not for prenatal diagnosis? Ann N Y Acad Sci. 2001;945:250–257. [PubMed] [Google Scholar]
- 7.Sigdel TK, Vitalone MJ, Tran TQ, Dai H, Hsieh SC, Salvatierra O, Sarwal MM. A rapid noninvasive assay for the detection of renal transplant injury. Transplantation. 2013;96:97–101. doi: 10.1097/TP.0b013e318295ee5a. [DOI] [PMC free article] [PubMed] [Google Scholar]
- 8.García Moreira V, Prieto García B, Baltar Martín JM, Ortega Suárez F, Alvarez FV. Cell-free DNA as a noninvasive acute rejection marker in renal transplantation. Clin Chem. 2009;55:1958–1966. doi: 10.1373/clinchem.2009.129072. [DOI] [PubMed] [Google Scholar]
- 9.Snyder TM, Khush KK, Valantine HA, Quake SR. Universal noninvasive detection of solid organ transplant rejection. Proc Natl Acad Sci U S A. 2011;108:6229–6234. doi: 10.1073/pnas.1013924108. [DOI] [PMC free article] [PubMed] [Google Scholar]
- 10.Stewart S, Winters GL, Fishbein MC, Tazelaar HD, Kobashigawa J, Abrams J, Andersen CB, Angelini A, Berry GJ, Burke MM, Demetris AJ, Hammond E, Itescu S, Marboe CC, McManus B, Reed EF, Reinsmoen NL, Rodriguez ER, Rose AG, Rose M, Suciu-Focia N, Zeevi A, Billingham ME. Revision of the 1990 working formulation for the standardization of nomenclature in the diagnosis of heart rejection. J Heart Lung Transplant. 2005;24:1710–1720. doi: 10.1016/j.healun.2005.03.019. [DOI] [PubMed] [Google Scholar]
- 11.Lo YM. Transplantation monitoring by plasma DNA sequencing. Clin Chem 57. 2011:941–942. doi: 10.1373/clinchem.2011.166686. [DOI] [PubMed] [Google Scholar]
- 12.Deng MC, Eisen HJ, Mehra MR, Billingham M, Marboe CC, Berry G, Kobashigawa J, Johnson FL, Starling RC, Murali S, Pauly DF, Baron H, Wohlgemuth JG, Woodward RN, Klingler TM, Walther D, Lal PG, Rosenberg S, Hunt S. CARGO Investigators, Noninvasive discrimination of rejection in cardiac allograft recipients using gene expression profiling. Am J Transplant. 2006;6:150–160. doi: 10.1111/j.1600-6143.2005.01175.x. [DOI] [PubMed] [Google Scholar]
- 13.Pham MX, Teuteberg JJ, Kfoury AG, Starling RC, Deng MC, Cappola TP, Kao A, Anderson AS, Cotts WG, Ewald GA, Baran DA, Bogaev RC, Elashoff B, Baron H, Yee J, Valantine HA. IMAGE Study Group, Gene-expression profiling for rejection surveillance after cardiac transplantation. N Engl J Med. 2010;362:1890–1900. doi: 10.1056/NEJMoa0912965. [DOI] [PubMed] [Google Scholar]
- 14.Crespo-Leiro MG, Zuckermann A, Bara C, Mohacsi P, Schulz U, Boyle A, Ross HJ, Parameshwar J, Zakliczyński M, Fiocchi R, Stypmann J, Hoefer D, Lehmkuhl H, Deng MC, Leprince P, Berry G, Marboe CC, Stewart S, Tazelaar HD, Baron HM, Coleman IC, Vanhaecke J. Concordance among pathologists in the second Cardiac Allograft Rejection Gene Expression Observational Study (CARGO II) Transplantation. 2012;94:1172–1177. doi: 10.1097/TP.0b013e31826e19e2. [DOI] [PubMed] [Google Scholar]
- 15.Morel O, Ohlmann P, Epailly E, Bakouboula B, Zobairi F, Jesel L, Meyer N, Chenard MP, Freyssinet JM, Bareiss P, Mazzucotelli JP, Toti F. Endothelial cell activation contributes to the release of procoagulant microparticles during acute cardiac allograft rejection. J Heart Lung Transplant. 2008;27:38–45. doi: 10.1016/j.healun.2007.09.031. [DOI] [PubMed] [Google Scholar]
- 16.Beck J, Bierau S, Balzer S, Andag R, Kanzow P, Schmitz J, Gaedcke J, Moerer O, Slotta JE, Walson P, Kollmar O, Oellerich M, Schütz E. Digital droplet PCR for rapid quantification of donor DNA in the circulation of transplant recipients as a potential universal biomarker of graft injury. Clin Chem. 2013;59:1732–1741. doi: 10.1373/clinchem.2013.210328. [DOI] [PubMed] [Google Scholar]
- 17.Hidestrand M, Tomita-Mitchell A, Hidestrand PM, Oliphant A, Goetsch M, Stamm K, Liang HL, Castleberry C, Benson DW, Stendahl G, Simpson PM, Berger S, Tweddell JS, Zangwill S, Mitchell ME. Highly sensitive noninvasive cardiac transplant rejection monitoring using targeted quantification of donor-specific cell-free deoxyribonucleic acid. J Am Coll Cardiol. 2014;63:1224–1226. doi: 10.1016/j.jacc.2013.09.029. [DOI] [PMC free article] [PubMed] [Google Scholar]
- 18.Kinde I, Wu J, Papadopoulos N, Kinzler KW, Vogelstein B. Detection and quantification of rare mutations with massively parallel sequencing. Proc Natl Acad Sci U S A. 2011;108:9530–9535. doi: 10.1073/pnas.1105422108. [DOI] [PMC free article] [PubMed] [Google Scholar]
- 19.De Vlaminck I, Khush KK, Strehl C, Kohli B, Luikart H, Neff NF, Okamoto J, Snyder TM, Cornfield DN, Nicolls MR, Weill D, Bernstein D, Valantine HA, Quake SR. Temporal response of the human virome to immunosuppression and antiviral therapy. Cell. 2013;155:1178–1187. doi: 10.1016/j.cell.2013.10.034. [DOI] [PMC free article] [PubMed] [Google Scholar]
- 20.http://www.genome.gov/sequencingcosts/
- 21.Fan HC, Blumenfeld YJ, Chitkara U, Hudgins L, Quake SR. Noninvasive diagnosis of fetal aneuploidy by shotgun sequencing DNA from maternal blood. Proc Natl Acad Sci U S A. 2008;105:16266–16271. doi: 10.1073/pnas.0808319105. [DOI] [PMC free article] [PubMed] [Google Scholar]
- 22.Li H, Durbin R. Fast and accurate short read alignment with Burrows–Wheeler transform. Bioinformatics. 2009;25:1754–1760. doi: 10.1093/bioinformatics/btp324. [DOI] [PMC free article] [PubMed] [Google Scholar]
- 23.Li H, Handsaker B, Wysoker A, Fennell T, Ruan J, Homer N, Marth G, Abecasis G, Durbin R. 1000 Genome Project Data Processing Subgroup, The Sequence Alignment/Map format and SAMtools. Bioinformatics. 2009;25:2078–2079. doi: 10.1093/bioinformatics/btp352. [DOI] [PMC free article] [PubMed] [Google Scholar]
- 24.Sing T, Sander O, Beerenwinkel N, Lengauer T. ROCR: Visualizing classifier performance in R. Bioinformatics. 2005;21:3940–3941. doi: 10.1093/bioinformatics/bti623. [DOI] [PubMed] [Google Scholar]
Associated Data
This section collects any data citations, data availability statements, or supplementary materials included in this article.
Supplementary Materials
Methods
Fig. S1. Measured versus predicted error rate.
Fig. S2. cfdDNA time course for patient A36.
Table S1. Heart transplant recipient demographics.