

Abstract
Insulin and insulin receptor (IR) kinase are found in abundance in discrete brain regions yet insulin signaling in the CNS is not understood. Because it is known that the highest brain insulin-binding affinities, insulin-receptor density, and IR kinase activity are localized to the olfactory bulb, we sought to explore the downstream substrates for IR kinase in this region of the brain to better elucidate the function of insulin signaling in the CNS. First, we demonstrate that IR is postnatally and developmentally expressed in specific lamina of the highly plastic olfactory bulb (OB). ELISA testing confirms that insulin is present in the developing and adult OB. Plasma insulin levels are elevated above that found in the OB, which perhaps suggests a differential insulin pool. Olfactory bulb insulin levels appear not to be static, however, but are elevated as much as 15-fold after a 72-h fasting period. Bath application of insulin to cultured OB neurons acutely induces outward current suppression as studied by the use of traditional whole-cell and single-channel patchclamp recording techniques. Modulation of OB neurons is restricted to current magnitude; IR kinase activation does not modulate current kinetics of inactivation or deactivation. Transient transfection of human embryonic kidney cells with cloned Kv1.3 ion channel, which carries a large proportion of the outward current in these neurons, revealed that current suppression was the result of multiple tyrosine phosphorylation of Kv1.3 channel. Y to F single-point mutations in the channel or deletion of the kinase domain in IR blocks insulininduced modulation and phosphorylation of Kv1.3. Neuromodulation of Kv1.3 current in OB neurons is activity dependent and is eliminated after 20 days of odor/sensory deprivation induced by unilateral naris occlusion at postnatal day 1. IR kinase but not Kv1.3 expression is downregulated in the OB ipsilateral to the occlusion, as demonstrated in cryosections of right (control) and left (sensory-deprived) OB immunolabeled with antibodies directed against these proteins, respectively. Collectively, these data support the hypothesis that the hormone insulin acts as a multiply functioning molecule in the brain: IR signaling in the CNS could act as a traditional growth factor during development, be altered during energy metabolism, and simultaneously function to modulate electrical activity via phosphorylation of voltage-gated ion channels.
INTRODUCTION
One-third of all mammalian proteins are thought to contain covalently bound phosphate (Hubbard and Cohen 1993). In the cell, phosphorylation is a reversible, dynamic process involving integrated networks and coordinated actions of protein kinases and protein phosphatases (reviewed in Hunter 1998; Sun and Tonks 1994). The insulin receptor belongs to a family of related receptor-linked protein tyrosine kinases that includes insulin growth factor (IGF) I and II, relaxins, the invertebrate bombyxins, and molluscan insulin-like peptides (De Meyts et al. 1995). The function of insulin signaling in the brain is unclear but has been widely sought. Insulin and IGF are synthesized by neurons in the olfactory bulb, hippocampus, and cerebellum (Werther et al. 1990); are temporally related to local neuronal proliferation (Bondy et al. 1992; Giacobini et al. 1995); and are released on depolarization (Boyd et al. 1985).
Putative functions for insulin in the CNS immediately evoke comparisons with the large body of research on Diabetes mellitus. This research has elucidated the insulin signaling system as a flexible network of interacting proteins (reviewed in White 1997) whereby a major downstream target for IR and IGF receptor kinases is insulin receptor substrate (IRS) (Adamo et al. 1989; Myers and White 1996; Skolnik et al. 1993). IRS has been shown to link the IR kinase with other proteins by acting as a multisite “docking protein” to bind signal-transducing molecules containing Src-homology-2 (SH2) and Src-homology-3 (SH3) domains (Myers and White 1993; Sun et al. 1991). In certain areas of the brain such as the olfactory bulb, however, IRS is weak or absent (Folli et al. 1994). It is not clear whether there is a different downstream transduction cascade for insulin signaling in the brain versus that of the periphery.
Another protein substrate that could serve the role of IRS in the olfactory bulb is a voltage-gated ion channel, Kv1.3, a mammalian homologue of the Shaker family that is highly localized to the olfactory bulb and cortex (Kues and Wunder 1992) and has been shown to carry a large proportion of the outward current in olfactory bulb neurons (Fadool and Levitan 1998). The Kv1.X family of ion channels contains several tyrosine residues that, when phosphorylated, could serve as recognition sites for SH2-containing proteins. These channels also contain proline-rich sequences for protein–protein interactions with SH3-containing protein kinases (Holmes et al. 1996); we therefore suggest another multiply phosphorylated protein substrate, an ion channel, could serve as the interacting downstream target for brain insulin signaling, similar to IRS.
Insulin signaling in the adult brain may also be involved in sculpting and maintaining synaptic circuitry. The synaptic connections in the olfactory system have long been explored because of the system’s well-known capacity for continual neurogenesis (Graziadei and Monti-Graziadei 1978). Olfactory receptor neurons that contain specific G-protein–coupled olfactory receptors to encode a given odorant molecule must be regenerated from a basal cell population and reestablish a proper topographical map within the olfactory bulb to ensure odor quality coding (Bozza and Kauer 1998; Ressler et al. 1994). Given that receptor-linked tyrosine kinases have been demonstrated to produce short-term modulatory changes in neuronal excitability (Bowlby et al. 1997; Fadool and Levitan 1998; Huang et al. 1993; Jonas et al. 1996; Tricarico et al. 1997; Wang and Salter 1994; Wilson and Kaczmarek 1993) and the finding that the highest brain insulin-binding affinities, IR density, and IR kinase activity are localized to the olfactory bulb (Baskin et al. 1983; Gupta et al. 1992; Hill et al. 1986), we found this area of the brain to be fortuitous as a model to study neuromodulation by insulin signaling. This study provides evidence that the downstream substrate of insulin signaling in the olfactory bulb is a voltage-gated ion channel, Kv1.3. We show that insulin stimulation of IR kinase causes multiple phosphorylation of Kv1.3 at discreet tyrosine residues to induce current suppression of the ion channel. The source of insulin in the olfactory bulb is unknown but the hormone is retained or elevated in the olfactory bulb after a period of fasting. IR kinase expression and neuromodulation of Kv1.3 is significantly reduced after unilateral naris occlusion, which ties insulin signaling to sensory/odor experience. These findings demonstrate that insulin signaling in the brain produces modulatory changes at the level of the ion channel and can be altered by external sensory experience and feeding.
METHODS
Solutions and reagents
Human embryonic kidney (HEK 293) cell patch pipette solution contained (in mM): 30 KCl, 120 NaCl, 10 N-2-hydroxyethylpiperazine-N′-2-ethanesulfonic acid (HEPES), and 2 CaCl2 (pH 7.4). Olfactory bulb neuron (OBN) patch pipette solution contained (in mM): 145 KCl, 10 HEPES, 10 ethylene glycol-bis(β-aminoethyl ether)-N,N,N′N,′-tetraacetic acid (EGTA), 2 MgCl2, 0.20 sodium adenosine 59-triphosphate (NaATP) (pH 7.3). HEK 293 cell bath recording solution contained (in mM): 150 KCl, 10 HEPES, 1 EGTA, and 0.5 MgCl2 (pH 7.4). OBN bath recording solution contained (in mM): 150 NaCl, 5 KCl, 2.6 CaCl2, 2 MgCl2, 10 HEPES, and 100 nM tetrodotoxin (TTX) (pH 7.3). Protease and phosphatase inhibitor (PPI) solution contained (in mM): 25 tris(hydroxymethyl)aminomethane (Tris), 250 NaCl, 5 ethylenediaminetetraacetic acid (EDTA), 1 Na3VO4, 1 phenylmethylsulfonyl fluoride, and 1% Triton X-100, 1 μg/ml each leupeptin and pepstatin, and 2 μg/ml aprotinin (pH 7.5). Homogenization buffer (HB) contained (in mM): 320 sucrose, 10 Tris, 50 KCl, 1 EDTA (pH 7.8). All salts were purchased from Sigma Chemical Co. or Fisher Scientific. Tissue culture and transfection reagents were purchased from Gibco/BRL. TTX was purchased from Calbiochem. Human recombinant insulin was purchased from Roche (Boehringer Mannheim).
cDNA constructs and antibodies
Kv1.3 channels were expressed transiently in human embryonic kidney (HEK 293) cells using the Invitrogen vector pcDNA3. Kv1.3 was ligated into pcDNA3 at the unique Hind III site of the multiple cloning region, placing the channel-coding region downstream from a CMV promoter. The insulin receptor (IR) cDNA was generously provided by Richard Roth (Stanford University, Stanford, CA) in the pECE vector. The entire IR-coding region was removed using the unique restriction sites Sal I and Xba I, and ligated into pcDNA3 between the Xho I and Xba I sites in the multiple cloning region. A kinase-deficient insulin receptor (IRtrunc) was constructed by truncating 417 bases of the 3′ IR-coding region. This mutant has an unstable β subunit, has no kinase activity in vitro or in vivo and does not mediate insulin-stimulated uptake of 2-deoxyglucose (Ellis et al. 1986). The IRtrunc was constructed by the use of a unique Mst I site (bp 3944) in the IR cDNA. IR pECE was double-digested with Sal I and Mst I, and the ~4.4-kb fragment was gel-purified. pcDNA3 was linearized with Xho I and Xba I. Both the fragment and vector were filled in with Klenow (Sambrook et al. 1989) and blunt-end ligated. Junctions were sequenced by the use of a cycle-sequencing reaction (PRISM) and an automated sequencer (Applied Biosystems Inc., Princeton, NJ) to verify the mutation and detect PCR errors.
A rabbit polyclonal antiserum, raised against a MalE fusion protein (New England BioLabs) containing an extracellular sequence specific to Kv1.3 (Cai and Douglass 1993), was generously provided by Dr. James Douglass (Vollum Institute, Portland, OR). This antibody was used for immunocytochemical analysis of the olfactory bulb, HEK 293 cells transfected with Kv1.3 channel cDNA, and for immunoprecipitation and Western blot detection of Kv1.3. Tyrosine-phosphorylated proteins were immunoprecipitated and detected on Western blots with the mouse monoclonal antibody 4G10 (Upstate Biotechnology, Inc.) that recognizes phosphotyrosine. Monoclonal antiserum against β-tubulin III was purchased from Sigma and used as a neural marker. Polyclonal antibody directed against the β subunit of the human insulin receptor was purchased from Upstate Biotechnology.
Naris occlusions
Neonatal unilateral anosmia was established by naris occlusions by the use of a modification of the techniques described by Meisami (1976) and Philpot et al. (1997) as approved by Auburn University Animal Care Facility and AVMA-approved methods. Postnatal day (P)1 Sprague-Dawley rats were removed from the mother and anesthetized with hypothermia for 7 min. The left naris was cauterized by insertion of a heated 2-mm metal probe, twice for 3 s. A similar protocol applying the probe to the shank of the nose served as the matched sham treatment. Occluded and sham litter mates were warmed to 37°C after the protocol and returned to the mother. Litters were culled to 12 animals to ensure equal nursing of sham versus occluded animals during the several-day period of tissue healing. Gloves and minimal contact ensured zero rejection rate by the mother.
Primary cell culture
Olfactory bulbs were harvested from 24-h-old Sprague-Dawley rats and neuronal primary cultures were prepared using the procedure of Huettner and Baughman (1986) as modified by Egan et al. (1992a). Animals were killed by decapitation according to AVMA-approved methods. Olfactory bulbs were removed quickly from the cranium and placed into 10 ml serum-free Dulbecco’s modified Eagle medium (DMEM; Gibco/BRL) equilibrated previously at 37°C in a 5% CO2 incubator. Olfactory bulbs from four to five animals were incubated whole in a physiological saline solution containing cysteine-activated papain (200 U, Worthington Biochemicals) for 1 h at 37°C in the 5% CO2 incubator. The bulbs were then washed in DMEM containing 5% fetal bovine serum (FBS; Gibco/BRL) and 5 mg/ml trypsin inhibitor (Boehringer Mannheim) for 10 min to stop the enzymatic activity of the papain. Cells were dissociated by trituration by the use of a graded-size series of fire-polished siliconized Pasteur pipettes; the resulting neuron and glia suspension was plated onto poly-D-lysine hydrobromide (MW 49,300 –53,000; Sigma) coated 12-mm glass coverslips, and incubated in DMEM supplemented with 2% penicillin/streptomycin and 5% FBS (Gibco/BRL). Cytosine arabinoside (10 μM; Sigma) was added to the medium for 36 h between days 3 and 5 to stop the overgrowth of dividing cells and to promote better survival of the neurons. Growth medium was changed twice a week, allowing viable neurons for at least 2 mo. Neurons were used for patch recording or immunocytochemistry 2 to 32 days after plating. Although the effect of insulin stimulation was performed as a paired measure within a single neuron and was observed independent of days in vitro (DIV), voltage-activated currents increased in magnitude as the neurons developed over DIV. To control for this variable, entire data sets were collected within 24- to 36-h intervals for proper statistical comparisons.
Maintenance of HEK 293 cell cultures and transfection
HEK 293 cells were maintained in minimal essential medium (MEM), 2% penicillin/streptomycin, and 10% FBS (Gibco/BRL). Before transfection, cells were grown to confluency (7 days), dissociated with trypsin-EDTA (Sigma) and mechanical trituration, diluted in MEM to a concentration of 600 cells/μl, and replated on Corning dishes (Catalog number 25000; Fisher Scientific). cDNA was introduced into the HEK 293 cells with a lipofectamine reagent (Gibco/BRL) 3 to 4 days after cell passage. At the time of transfection, the cells were approximately 20–30% confluent. Lipofectamine and cDNA were allowed to complex for 15 min. The DNA/lipofectamine complex was diluted in 1 ml of serum-reduced OptiMEM (Gibco/BRL), and cells were transfected for 4.5 to 5 h with 1 μg of Kv1.3 cDNA, or with 0.75 μg each of Kv1.3 and IR cDNA, per 35-mm dish. Plasmid DNA with no coding insert served as the control.
Transfection efficiency was monitored by cotransfecting with pHook (Invitrogen) as a means of rapidly selecting transfected cells. pHook encodes a transmembrane domain from the platelet derived growth factor receptor (PDGF-R), which is then anchored on the extracellular side of the plasma membrane. Before patch recording, a brief incubation with an appropriate antibody linked to a 5-μm polystyrene bead allowed recognition of transfected cells. More than 85% of bead-labeled cells expressed Kv1.3 current. Double, sequential labeling with antibodies directed against the Kv1.3 channel and insulin receptor, respectively, was used to confirm the uptake and colocalization of more than one cDNA construct per cell. On the basis of confocal microscopic visualization, we observed that if an HEK 293 cell incorporated the cDNA construct for the ion channel, it also incorporated the cDNA for the kinase with a >95% efficiency. Typically, single-channel events could be detected as early as 9 h post-transfection and macroscopic currents were observed in the range of 24 to 60 h.
Site-directed mutagenesis
The parent Kv1.3 clone was propagated in Escherichia coli DH-1. Plasmid DNA preparation was according to standard methods by the use of a Qiagen Plasmid Kit (Qiagen Inc.) followed by phenolchloroform extraction and ethanol precipitation (Sambrook et al. 1989). All Kv1.3 channel mutants were constructed with the use of two sequential polymerase chain reactions (PCRs) in an Eri-Comp thermocycler (Twin Block System, San Diego, CA), with the use of Taq polymerase (Promega). The circularized plasmid containing the channel gene served as the DNA template. For each tyrosine mutation, three oligonucleotides, each 15–24 bases in length, were synthesized. Two of the oligonucleotides were complementary to sequences on opposite sides of the tyrosine residue to be mutated, and the third was a mutant primer with a single base change to convert the tyrosine to phenylalanine. In the case of YYY111–113, the three adjacent tyrosines were treated as a unit and mutated together to phenylalanines. The first PCR used the mutagenic primer and the upstream primer. The second PCR used the amplified, gel-purified product of the first reaction and the downstream oligonucleotide as primers. In this way a stretch of mutant DNA flanked by two unique restriction sites was obtained; the product was double-digested and ligated into the parent channel backbone with the use of T4 DNA ligase (Promega). All resulting mutant constructs were sequenced as described previously.
Electrophysiology of HEK 293 cells
Macroscopic currents in cell-attached membrane patches were recorded 24–60 h after transfection with the use of an Axopatch-200B amplifier (Axon Instruments). Cells were visualized at ×40 magnification with the use of an inverted microscope equipped with Hoffman modulation contrast optics (Axiovert 135, Carl Zeiss). Electrodes were fabricated from Jencons glass (Catalog number M15/10, Jencons Limited, Bedfordshire, UK), fire-polished to approximately 1 μm, and coated near the tip with beeswax to reduce the electrode capacitance. Pipette resistances were between 9 and 14 MΩ. All voltage signals were generated and data were acquired with the use of a microstar DAP 800/2 board (Microstar Lab, Bellevue, WA). The amplifier output was filtered at 2 kHz, digitized at 2–5 kHz, and stored for later analysis.
The Kv1.3 channel expression was so robust that it was not possible to record whole-cell currents without saturating the amplifier. The diameter of the patch electrode, and hence number of ion channels sampled, was held uniform by checking the bubble number of the pipette immediately after electrode fabrication and polishing (Mittman et al. 1987). Patches were held routinely at a holding potential of −90 mV, and the voltage was stepped to depolarizing potentials for a pulse duration of 1,000 ms. Stimuli were delivered at 60-s or longer intervals to prevent cumulative inactivation of the Kv1.3 channel (Marom et al. 1993). Peak current amplitudes, channel inactivation kinetics, deactivation kinetics, voltage at one-half maximum activation, and channel conductance were measured before and 20–25 min after insulin application to permit a paired statistical comparison.
Electrophysiology of OBNs
OBNs were voltage-clamped in the whole-cell or cell-attached recording configuration. Patches were held at −90 mV and stepped to +40 mV for a pulse duration of 1 or 5 s, at a stimulating interval of 1 min. The effect of insulin on OBN whole-cell currents was tested as a paired measurement of peak current amplitude, channel inactivation kinetics, and deactivation kinetics, before and after a 20-min bath application of insulin. The effect of insulin on OBN unitary currents was tested by tip-filling the electrode with control patch solution and backfilling the electrode with insulin to activate the kinase. The initial currents were taken as the control condition and the modulatory effect of the kinase could be observed within a 5-min period. This is in agreement with the average time course for tip diffusion on the basis of previous experimentation (Fadool and Ache 1992; Fadool et al. 1995; Fadool and Levitan 1998).
All electrophysiological data were analyzed using software written in the Levitan Laboratory (Dr. Irwin Levitan, University of Pennsylvania, Philadelphia, PA), in combination with the analysis packages Origin (MicroCal Software) and Quattro Pro (Borland International). Data traces were subtracted linearly for leakage conductance. Functional expression of Kv1.3 current was defined as the presence of a nonohmic current at depolarizing voltages. The inactivation of the macroscopic current was fit to the sum of two exponentials by minimizing the sums of squares. The two inactivation time constants were combined by multiplying each by its weight and summing as described previously (Kupper et al. 1995). The deactivation of the macroscopic current was fit similarly, but to a single exponential. The V1/2, the voltage at which half of the channels were activated, was calculated by fitting normalized peak tail currents at different holding potentials to a Boltzmann function. The slope of this function, or the value for the steepness of the voltage dependence, is reported as k. Differences between control and treatment groups within single cells were analyzed by paired t-test. Statistical significance in all tests was defined at the 0.95 confidence level.
Immunoprecipitation, membrane preparation, and ELISA assay
HEK 293 cells were transfected as described earlier, but at 80–90% confluency and with a total of 7.0 μg cDNA per 60-mm dish. Equal amounts of channel and IR cDNA were mixed. Cells were harvested 2 days posttransfection by lysis in ice-cold PPI solution. The lysates were clarified by centrifugation at 14,000 g for 10 min at 4°C and incubation for 1 h with 3 mg/ml Protein A-sepharose (Amersham-Pharmacia), followed by another centrifugation step to remove the Protein A-sepharose. Tyrosine-phosphorylated proteins were immunoprecipitated from the clarified lysate by overnight incubation at 4°C with 3 μg/ml 4G10 antibody, followed by a 2-h incubation with Protein A-sepharose and centrifugation as before. The immunoprecipitates were washed four times with ice-cold PPI solution (modified to contain 0.1% Triton X-100). Lysates and washed immunoprecipitates were diluted in sodium dodecyl sulfate (SDS) gel-loading buffer (Sambrook et al. 1989) containing 1 mM Na3VO4, and proteins were separated on 10% acrylamide SDS gels and transferred to nitrocellulose for Western blot analysis. Blots were blocked with 4% nonfat milk and incubated overnight at 4°C in primary antibody against Kv1.3, then with horseradish peroxidase–conjugated donkey antirabbit secondary antibody (Amersham-Pharmacia) for 90 min at room temperature. ECL (Amersham-Pharmacia) exposure on Fuji RX film (Fisher) was used to visualize labeled protein. Films were scanned with a Hewlett-Packard Photosmart Scanner (model 106-816, Hewlett-Packard) and analyzed with Quantiscan software (Biosoft, Cambridge, UK).
For immunoprecipitation of tyrosine-phosphorylated proteins from native olfactory bulb neurons, the olfactory bulbs (OBs) from left naris-occluded animals were exposed, but not removed, from the cranium. In this in situ state, brains with intact OBs were stimulated with either optiMEM or 50 μg/ml insulin in optiMEM for 20 min in a 37°C incubator. Right versus left OBs were then removed and homogenized 50 strokes by Kontes tissue grinder (size 20) in ice-cold PPI solution. The lysate clarification, immunoprecipitation, and SDS-PAGE analysis were as described previously for HEK 293 cells.
OB membranes were prepared by harvesting tissue from animals at various postnatal stages and homogenizing the OBs 50 strokes by Kontes tissue grinder (size 20) in HB solution on ice. The mixture was centrifuged twice at ~2,400 g (3,800 rpm) for 30 min at 4°C in an Eppendorf model 5416 to remove cellular debris. The combined supernatant was centrifuged in a Beckman ultracentrifuge (model L8-M, Beckman) at 110,000 g (40,000 rpm) for 2.5 h at 4°C. The resulting pellet was resuspended in HB solution and tip-sonicated on ice three times for 20 s with a Tekmar Sonicator (setting 50). Protein concentration was determined by Bradford assay and samples were stored at −80°C until use.
Plasma and olfactory bulb insulin levels were determined using a solid-phase two-site enzyme immunoassay (APLCO, Wilham, NH) with slight modification of the manufacturer’s defined protocol. Briefly, trunk or left atria blood was collected into heparinized tubes and the plasma fraction was collected by centrifugation at 4°C for 10 min at 14,000 g. OB were homogenized as before but the provided zero-standard solution was used instead of HB solution. Insulin in the plasma or OB samples was reacted for 2 h at 300 rpm at room temperature with peroxidase-conjugated anti-insulin antibodies and anti-insulin antibodies bound to microplate walls. After thorough washing, the bound conjugate was detected by reaction with 3,39,5,59- tetramethybenzidine (TMB) and reincubated for an additional 30 min at 300 rpm at room temperature. The reaction was quenched with perchloric acid and the colorimetric endpoint was read at 450 nM in a spectrophotometer (model Ultraspec 2000, Pharmacia Biotech).
Immunocytochemistry
For cryosections, whole OBs were fixed in 4% paraformaldehyde for 3 h followed by overnight infiltration with 10% sucrose, then 4 h with 30% sucrose. OBs were cut to 9- to 12-μm thickness on a Microm Laborgeräte GmgH microtome-cryostat (Carl Zeiss). Sections were transferred to 1% gelatin-coated glass slides (Sigma) and stored at −20°C until use. Before immunolabeling, slides were briefly fixed in 1% paraformaldehyde for 5 min to promote adhesion of the section to the gelatin slide. Cultured OBNs and transfected HEK 293 cells were rinsed once in PBS and then lightly fixed in St. Marie Fixative (95% EtOH/5% acetic acid) for 10 min at −20°C. The fixative for cultured cells or cryosections was removed by rinsing with two changes of PBS for 10 min each, two changes of PBS with 0.1% Triton X (PBST), and nonspecific binding was blocked by incubation for 30 min in PBST containing 1–2% Albumin Fraction V (fatty acid free; Sigma) (Block). Cryosections or cultured cells were incubated with primary antiserum diluted in Block for 90 min at room temperature, washed with three changes of PBST, and then were reincubated for 90 min at room temperature with a fluorescein-conjugated goat anti-rabbit secondary antibody (Boehringer-Mannheim) in Block. Sections or cultured cells were washed with two changes of PBST for 10 min, two changes of PBS for 10 min, rinsed in millipore water, and mounted in 60/40 glycerol/PBS with 0.02% p-phenylene-diamine added to prevent photobleaching. Photomicroscopy was performed at ×40 with the use of a CH-2 Olympus microscope equipped with epifluorescence. Laser confocal microscopy was performed on a Bio-Rad MRC1000 fitted with a Zeiss Axioskop using a ×40 Plan neofluor objective. Changes in fluorescence intensity were compared with the use of a quantitative densitometric analysis of pixel density computed by Quantiscan software (Biosoft).
Counting of immunopositive cells was performed by examining five fields of view in each of two to four experiments. The examiner was blind to the experimental condition. The mean ± SE was calculated for the number of immunolabeled cells across approximately 40 neurons in the field of view. Cells were confirmed as neurons by double-labeling with β-tubulin III as a neural marker.
RESULTS
Insulin-induced current suppression is kinase activity dependent
Kv1.3 plus IR kinase cotransfected HEK 293 cells were voltage-clamped in the cell-attached configuration and stepped to various depolarizing potentials from rest (−90 mV) under control and insulin-stimulated conditions. Stimulation with 0.1 μg/ml insulin caused a significant decrease in peak current magnitude of the Kv1.3 ion channel (Fig. 1, paired t-test; control = 1,124 ± 146 pA; plus insulin 832 ± 148 pA, n = 7). Modulation of the channel was acute, occurring in the window of 20 min. Only the peak current magnitude was significantly modulated by activation of the kinase; channel inactivation kinetics, deactivation kinetics, conductance, and voltage dependence were not affected (Fig. 1B, Table 1). Interestingly we found that the modulation of Kv1.3 was dependent on the concentration of insulin activating the IR kinase: 0.1–1.0 μg/ml insulin evoked current suppression, whereas 50–100 μg/ml insulin induced only a slowing of the deactivation kinetics and no change in other Kv1.3 current properties (paired t-test, see Table 1). Because higher concentrations of insulin can potentially cross-react with the IGF-I or -II receptor expressed endogenously in the HEK 293 cells or in native OB neurons (Rotwein et al. 1988; Smith et al. 1988; Werther et al. 1990), we elected to perform all subsequent experiments at the lower concentration range. Reported brain insulin contained within the OB and its half-maximum binding affinity is within this physiological range (Baskin et al. 1983; Gupta et al. 1992).
Fig. 1.
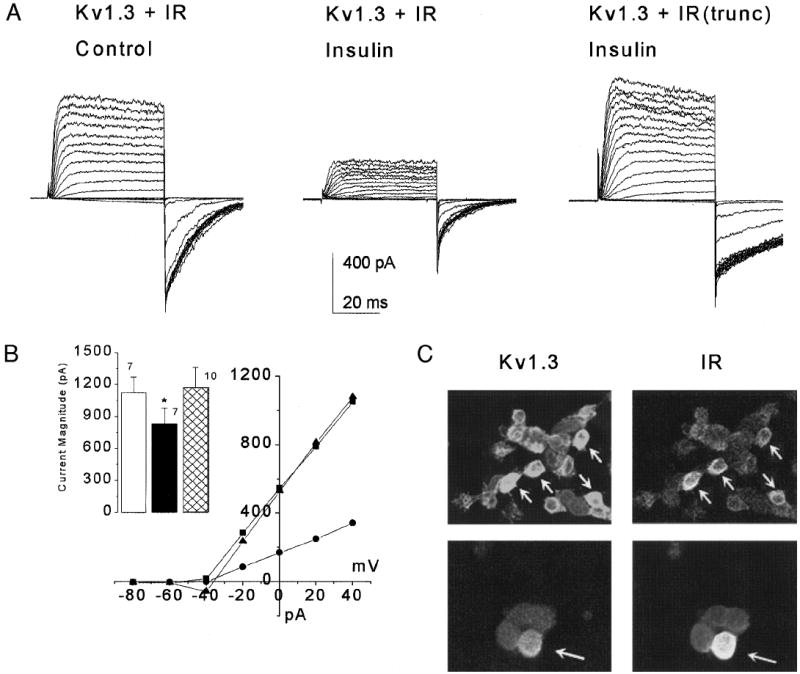
Activation of IR kinase induces suppression of Kv1.3. A: human embryonic kidney (HEK 293) cell cotransfected with Kv1.3 and insulin receptor kinase (IR) was voltage-clamped in the cell-attached configuration at –90 mV and stepped in 10-mV increments to 0 mV. Left, recorded using control bath solution. Middle, same cell after 20 min of bath-applied insulin (0.1 μg/ml). Right, cell-attached patch from a HEK 293 cell cotransfected with Kv1.3 and IR containing a truncated β subunit (IRtrunc; see methods) after an identical application of insulin under the same voltage protocol. For statistical comparisons, see Table 1. B: current–voltage plot of HEK 293 cells transfected as in A. Patches were voltage-clamped at –80 mV and stepped in 20-mV increments to +40 mV. ■ = Kv1.3 + IR control, ● = Kv1.3 + IR Insulin, ▲ = Kv1.3 + IR(trunc) Insulin. Inset: plot of the mean peak current magnitude of these patches as measured at the 140-mV depolarization step. Open bar, Kv1.3 + IR Control; solid bar, Kv1.3 + IR Insulin; crosshatched bar, Kv1.3 + IR(trunc) Insulin; *, significantly different paired t-test. C: HEK 293 cells cotransfected with Kv1.3 plus IR and sequentially double-labeled with Kv1.3 (1:200) and IRβ (1:100) as viewed at ×40 by confocal microscopy. No fluorescent signal is observed in the absence of primary antiserum. Arrows denote cells immunocytochemically labeled for both proteins, indicating the uptake of both cDNA constructs into single cells.
Table 1.
Properties and modulation by insulin of Kv1.3 ion channel coexpressed with wild-type or truncated insulin receptor kinase
| Channel Construct and Treatment | Peak Current (pA) | Inactivation τ (ms) | Deactivation τ (ms) | Activation (V1/2) (mV) | Voltage Dependence (k) |
|---|---|---|---|---|---|
| Kv1.3 + IR kinase | |||||
| Control (n = 7) | 1124 ± 146 | 724 ± 83 | 41 ± 7 | −45.1 ± 1.4 | 3.1 ± 0.25 |
| Insulin (0.1 μg/ml) | 832 ± 148* | 608 ± 126 | 46 ± 6 | −46.5 ± 0.4 | 3.3 ± 0.21 |
| Kv1.3 + IR kinase | |||||
| Control (n = 7) | 931 ± 226 | 758 ± 70 | 16 ± 2 | −43.1 ± 1.3 | 3.2 ± 0.19 |
| Insulin (50 μg/ml) | 1033 ± 245 | 640 ± 74 | 25 ± 5* | −44.9 ± 1.5 | 3.2 ± 0.15 |
| Kv1.3 + IR(trunc) | |||||
| Control (n = 10) | 1304 ± 246 | 776 ± 39 | 18 ± 3 | −44.5 ± 1.6 | 3.3 ± 0.18 |
| Insulin (0.1 μg/ml) | 1170 ± 192 | 604 ± 58* | 17 ± 3 | −44.2 ± 1.6 | 3.6 ± 0.22 |
Currents were evoked by 1-s depolarizing pulses to +40 mV from rest (−80 mV), whereas HEK 293 cells were voltage-clamped in the cell-attached configuration. Values are means ± SE. Time constant (τ) values were estimated from exponential fits to the inactivating or deactivating portions of the current. The V1/2, the voltage at which half the channels were activated, was calculated by fitting normalized peak tail currents at different holding potentials to a Boltzmann function. The slope of this function or the value for steepness of the voltage dependence is reported as k.
Insulin-treated is significantly different from control by paired t-test.
The Kv1.3 ion channel and the IR kinase could not be coimmunoprecipitated, whether with the use of our heterologous expression system (HEK 293 cells) or immunoprecipitating the native proteins from the OB (data not shown), thereby indicating that the two proteins did not directly or strongly interact. We thus tested whether neuromodulation of Kv1.3 by insulin activation of IR kinase involved phosphorylation as opposed to a direct coupling. A kinase-deficient insulin receptor (IRtrunc) was constructed by truncating 417 bases of the IR-coding region. This change to the IR kinase is known to cause instability of the β subunit and deletion of its subsequent kinase activity via blocking autophosphorylation (Ellis et al. 1986). HEK 293 cells cotransfected with Kv1.3 + IRtrunc displayed a peak current magnitude that was not significantly different after insulin stimulation (paired t-test; control = 1,304 ± 246 pA; plus insulin = 1,171 ± 192 pA, n = 10).
To ensure that the expressed channel and kinase were colocalized to the same HEK 293 cell, we examined the efficiency of cotransfecting the respective cDNA constructs with the use of confocal microscopy combined with double-labeling for the channel and the kinase (Fig. 1C). These studies consistently confirmed that if a cell took up the cDNA for one construct, it took up both cDNAs (or more) nonselectively. Although we could not quantify the absolute equivalence of the expression of each protein within a single cell, immunofluorescent signal was observed for both the channel and the kinase in over 98% of observed cells (n = 20 fields of view), assurance that expression of the two proteins was colocalized. General transfection efficiency using lipofectamine reagent was high (60–80%) as confirmed by β-galactosidase staining of Lac Z + Kv1.3 cotransfected HEK 293 cells. Efficiency was highly dependent on cell density (percentage confluence), cDNA concentration and purity, and attachment substrate, conditions that were optimized as stated in the methods section.
Multiple sites for tyrosine phosphorylation revealed by mutagenesis
Because kinase activity was necessary for insulin-induced current suppression of Kv1.3 ion channel by IR (Fig. 1) and activation of the IR has been shown to phosphorylate the ion channel (Bowlby et al. 1997), we explored whether removal of the tyrosine phosphorylation motif in the ion channel could reverse both the tyrosine phosphorylation of Kv1.3 and its physiological modulation by insulin. Single-point Y to F mutations were made at six sites in the Kv1.3 channel sequence (Fig. 2A) that contained strong consensus sequences (flanking acidic residues and downstream hydrophobic residues) for tyrosine-specific phosphorylation based on combinatorial peptide libraries (Sun and Tonks 1994). The triple-Y site at 111–113 was treated as a unit and mutated as a single cassette.
Fig. 2.
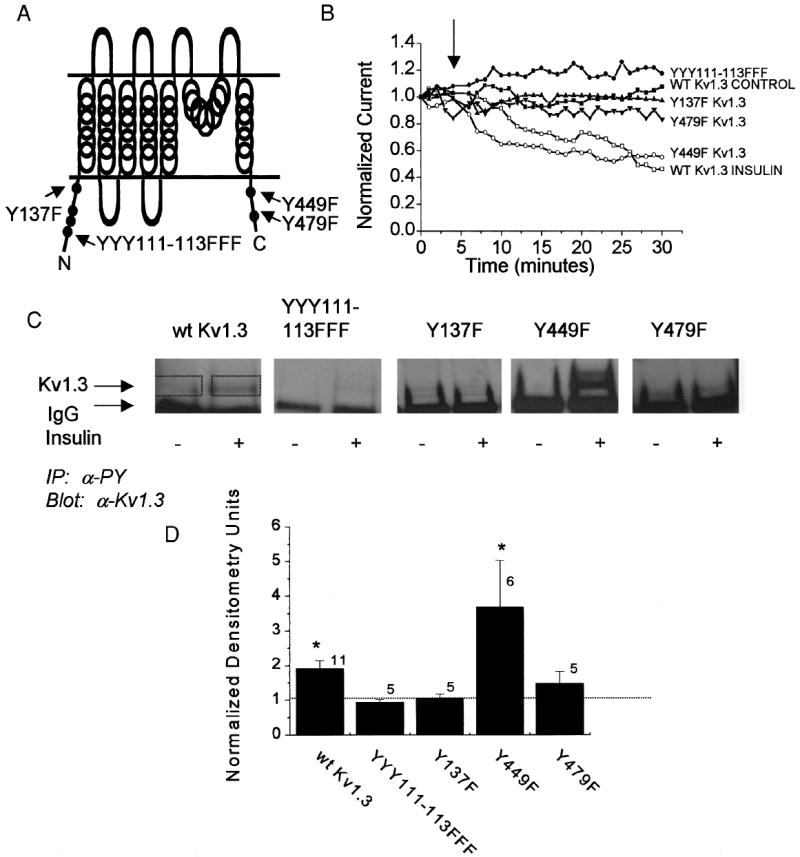
Kv1.3 is phosphorylated by IR kinase at multiple tyrosine residues to induce current suppression of the ion channel. A: cartoon of the Kv1.3 ion channel secondary structure indicating the amino and carboxyl cytoplasmic sites where single tyrosine to phenylalanine point mutations (Y to F) were introduced. B: plot of the normalized current magnitude of a HEK 293 cell cotransfected with wild-type Kv1.3 ion channel plus IR kinase. The cell-attached patch was held at –90 mV and stepped to a single depolarizing potential of +40 mV in 1-min interpulse durations without (WT Kv1.3 CONTROL) or with (WT Kv1.3 INSULIN) application of 0.1 μg/ml insulin at the arrow. All Kv1.3 ion channel mutants were cotransfected with IR kinase and stimulated with insulin at the arrow. Closed symbols, no significant difference; open symbols, significant difference (paired t-test, time 5 vs. time 30). Shown are representative plots out of 6–10 recordings per channel construct (see results). C: HEK 293 cells cotransfected with IR kinase and Kv1.3 constructs as indicated without (−) and with (+) insulin stimulation for 20 min. Cells were then harvested and immunoprecipitated (IP) with anti-4G10 (αPY) that recognizes tyrosine phosphorylated proteins. Nitrocellulose blots were probed with antiserum for Kv1.3 (1:200). Arrows, band corresponding to the Kv1.3 ion channel protein and the IgG fraction, respectively. D: histogram representation of the change in phosphorylation of Kv1.3 under insulin stimulated/unstimulated conditions. Densitometry units were calculated within single Western blots to standardize any variance in ECL exposure time (see boxes used to determine pixel density). A ratio of 1.0 (no difference) is denoted by the dashed line. *Significantly different, Student’s t-test (Arc-sin transformation of percentage data).
Wild-type Kv1.3 or one of the four Kv1.3 mutant channels was cotransfected with IR kinase and tested for insulin-induced modulation of current magnitude (Fig. 2B). Cotransfected HEK 293 cells were held at rest (−90 mV) and stepped to a single depolarizing potential at an interpulse interval of 1 min to prevent cumulative inactivation of Kv1.3 current. Most patch recordings could be held for 0.5 h under this repetitive stimulation protocol. After allowing the cell to stabilize for 5 min, insulin was applied to the bath of the recording chamber. The value for peak current magnitude under control conditions was taken just before insulin application and the paired insulin treatment value was taken at the end of the 0.5-h period. Y449F Kv1.3 + IR kinase–transfected HEK 293 cells exhibited a significant decrease in mean current magnitude of 195 ± 72 pA (paired t-test, n = 8), which correlates to a percentage decrease of 22%. This was not unlike the WT Kv1.3 + IR kinase–transfected cells that responded with a 26% decrease in mean current magnitude (n = 12) in response to insulin stimulation (Fig. 2B). All other Kv1.3 mutant channels (YYY111–113FFF Kv1.3, Y137F Kv1.3, and Y479F Kv1.3) coexpressed with IR kinase exhibited no significant change in mean current magnitude in response to insulin stimulation (paired t-test of mean current values) that correlated to a 7% decrease for Y137F Kv1.3 (n = 9), a 4% decrease for Y479F Kv1.3 (n = 9), and a 6% decrease for YYY111–113 Kv1.3 (n = 6); compared with WT Kv1.3 no insulin stimulation responded with a 6% decrease (n = 9) over the 0.5-h recording period.
Identical cotransfections as in the preceding patch-clamp experiments were established for the WT or Kv1.3 ion channel mutants and IR kinase to test for tyrosine-specific phosphorylation by immunoprecipitation of tyrosine-phosphorylated proteins. Immunoprecipitates were separated by SDS-PAGE, followed by Western analysis that probed for Kv1.3 ion channel (Fig. 2C). WT Kv1.3 or Y449F Kv1.3 plus IR kinase–cotransfected HEK 293 cells demonstrated increased tyrosine phosphorylation of the Kv1.3 ion channel after 20-min stimulation with the hormone insulin. Quantitative densitometry indicated that WT Kv1.3 and Y449F Kv1.3 showed a 1.9 ± 0.2-fold (n = 11) and a 3.9 ± 1.3-fold (n = 6) increase, respectively, in the presence of insulin stimulation over that of basal phosphorylation (Fig. 2D). Three of the channel mutants, YYY111–113FFF, Y137F, and Y479F, however, showed no increase in phosphorylation in the presence of insulin (Fig. 2D) [fold increase for YYY111–113FFF Kv1.3 = 1.0 ± 0.1 (n = 5), for Y137F Kv1.3 = 1.1 ± 0.1 (n = 5), and Y479F Kv1.3 = 1.5 ± 0.3 (n = 5)]. These data indicate that three tyrosine residues (tyr111–113, tyr137, and tyr479) are targets for insulin-induced current suppression of Kv1.3 ion channel by tyrosine phosphorylation; with the removal of these tyrosine targets, insulin-induced increase in phosphorylation is not observed. Combined analysis of data in Figs. 1 and 2 strongly suggests that tyrosine phosphorylation at multiple sites is coupled to current suppression of the Kv1.3 ion channel.
Whole-cell and unitary currents are suppressed by insulin stimulation of native olfactory bulb neurons
We next pursued whether insulin neuromodulation of native currents occurred in the olfactory bulb. Our previous work has shown that a large component of the outward voltage-activated current in voltage-clamped whole-cell recordings of olfactory bulb neurons is carried by a Kv1.3-like current that is based on several properties including the blockability of the current by a selective scorpion toxin, margatoxin (Fadool and Levitan 1998). Bath-applied insulin significantly suppressed outward current in native olfactory bulb neurons (Fig. 3, paired t-test; control = 1,541 ± 141 pA; plus insulin = 1,170 ± 106 pA, n = 7). Similarly to what was found in Kv1.3 + IR-cotransfected HEK 293 cells, modulation of the neurons affected the peak current magnitude and not the kinetics of inactivation or deactivation (Table 2). There is similarity between the insulinlike growth factor I (IGF I) and insulin receptors; each receptor binds to its specific ligand but may also cross-react with the other receptor at lower affinity. Because of this fact, we questioned whether insulin-like growth factor, that binds with only 10- to 100-fold less affinity, could cross-react with IR kinase in these neurons. To test this possibility we applied 50 ng/ml IGF I to OBNs and found there was no acute modulation of Kv1.3 current properties (Fig. 3, paired t-test; control = 783 ± 82 pA; plus IGFI = 684 ± 66 pA, n = 8).
Fig. 3.
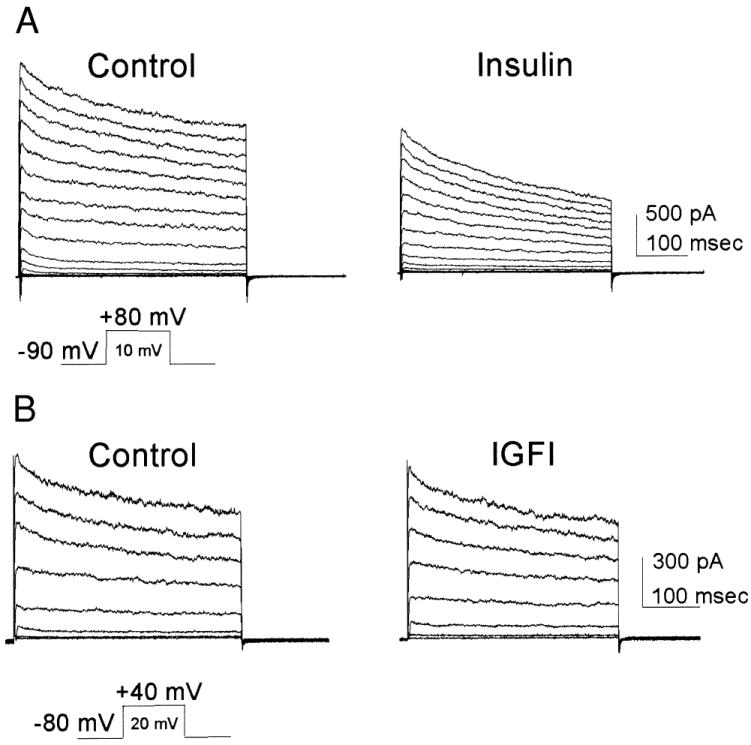
Whole-cell currents containing native Kv1.3 in olfactory bulb neurons are suppressed by insulin. A: whole-cell recording from an olfactory bulb neuron (OBN) voltage-clamped at −90 mV and stepped in 10-mV increments to +80 mV. Left, recorded using control bath solution (Control). Right, same cell after 20 min of bath-applied insulin (0.1 μg/ml; Insulin). B: whole-cell recording from an OBN voltage-clamped at −80 mV and stepped in 20-mV increments to +40 mV. Left, recorded using control bath solution (Control). Right, same cell after 20 min of bath-applied insulin growth factor (50 ng/ml; IGFI). A and B: for statistical comparisons and sample sizes, see Table 2.
Table 2.
Properties and modulation by insulin or IGF I of olfactory bulb neuron outward current
| Treatment | Peak Current (pA) | Inactivation τ (ms) | Deactivation τ (ms) |
|---|---|---|---|
| Control (n = 7) | 1541 ± 141 | 241 ± 34 | 10 ± 3 |
| + Insulin | 1170 ± 106* | 377 ± 73 | 22 ± 7 |
| Control (n = 8) | 783 ± 82 | 358 ± 107 | 78 ± 26 |
| + IGF I | 684 ± 66 | 315 ± 86 | 83 ± 24 |
| Sham-treated (n = 5) | 475 ± 133 | 254 ± 77 | 12 ± 3 |
| + Insulin | 176 ± 53* | 378 ± 24* | 8 ± 1 |
| Naris-occluded (n = 7) | 462 ± 148 | 189 ± 52 | 16 ± 4 |
| + Insulin | 486 ± 168 | 156 ± 53 | 16 ± 1 |
Currents were evoked by 1-s depolarizing pulses to +40 mV from rest (–80 or –90 mV), whereas olfactory bulb neurons were voltage-clamped in the whole-cell configuration. Values are means ± SE. Time-constant (τ) values were estimated from exponential fits to the inactivating or deactivating portions of the outward current.
Insulin-treated is significantly different from control by paired t-test.
With the use of patch-recording solutions that minimize the activation of calcium- or sodium-activated potassium currents (see methods), Kv1.3 unitary currents can be recorded in the cell-attached configuration and readily identified by the characteristic C-type inactivation observed under a long depolarized step of 5 s. The patch electrode was first tip-filled with control patch solution (Fig. 4A, Control) and then back-filled with 0.1 μg/ml insulin (Fig. 4A, Insulin). This allowed a baseline recording under control conditions before gravity perfusion of the hormone (see methods). Because of the low probability of recording one channel in the patch as opposed to several, combined with the property of cumulative inactivation for these channels, this approach did not yield a large number of single-channel transitions for extensive nonstationary kinetic analysis. Nonetheless, with the use of this recording paradigm, patches maintained with a back-filled insulin electrode displayed channel activity that moved into a closed or inactivated state within four to five voltage-stimulating sweeps and failed to reopen (n = 3). Patches that were back-filled with control patch solution (n = 4) maintained channel activity for the duration of the recording (up to 1 h).
Fig. 4.
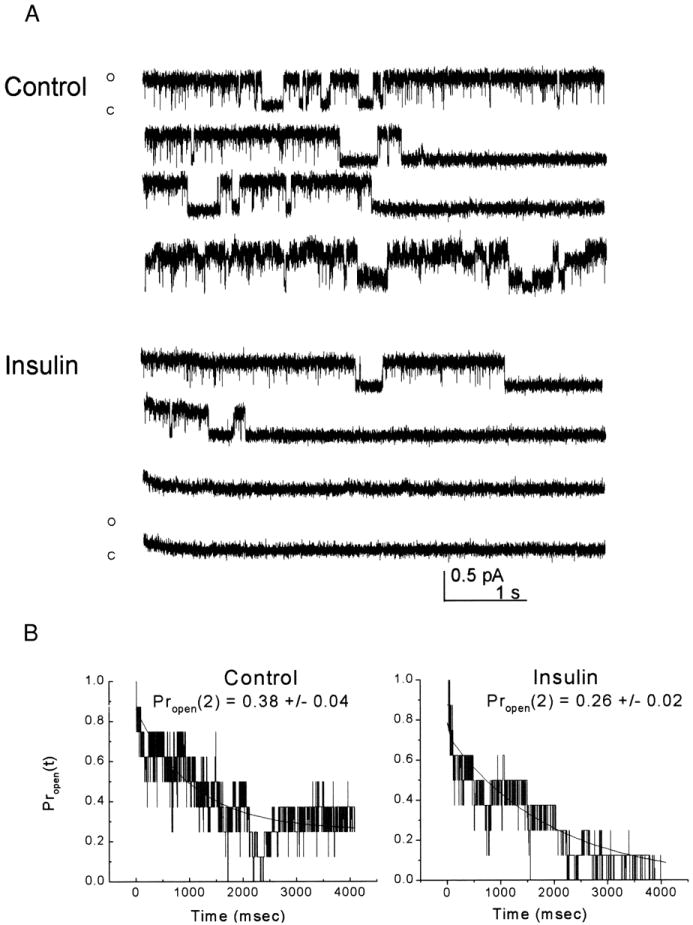
Unitary OBN current is suppressed by insulin. A (control): cell-attached OBN under control-patch recording conditions in which both the tip and barrel of the electrode were filled with control solution. The patch was held at −90 mV and stepped to +40 mV for a duration of 5 s. The interval between voltage-stimulation was set at 1 min to allow Kv1.3 to fully recover from C-type inactivation and prevent cumulative inactivation. Shown is every other record for the first 8 min. Trace is representative of four such recordings (Insulin). Cell-attached OBN where the patch electrode was tip filled with control patch solution and then the barrel of the electrode was back-filled with 0.1 μg/ml insulin. Same voltage and stimulation protocol as above. Trace is representative of three such recordings. B: schematic representation of the time-dependent open probability [Propen (t)] calculated in 500-μs increments for the patches recorded in A. Each representation is an average of the 8 idealized records captured for the first 8 min under conditions in which the electrode was back-filled with control patch solution (Control) or insulin (Insulin) as above. Line graphs were fitted with a second-order exponential decay and Propen was determined for time 2 s [Propen (2)] under control and insulin conditions. Mean ± SE as noted in the figure and described in detail in the text.
Because Kv1.3 exhibits nonstationary behavior, ensemble averaging was performed on the single-channel data by averaging idealized records under control and insulin-exposed conditions. A time-dependent open probability (Propen) was calculated as: Propen (at t = i seconds) = (number of records with channel open at t = i)/(total number of records in the ensemble) (Aldrich and Yellen 1983). Because Propen changes with time, the probability that the channel was open was computed by finding all the detectable opening and closing transitions and constructing a schematic representation that had a value of 0 when the channel was closed, and 1 when it was open. By performing this calculation every 500 μs for eight uniform voltage steps of 5-s duration, a representation of the channel open probability as a function of time and treatment was created (Fig. 4B). The ensemble mean number of channels open at time t = 2 s was calculated as:
where M is the number of records in the ensemble and ηi(t) is the number of channels open at time 2 s in the ith record. Then Propen (t) = 〈n(t)〉/N, where N is the number of channels in the patch. The Propen (t) for t = 2 s was significantly greater for control patches compared with that for insulin-treated patches [control Propen (2) = 0.38 ± 0.04 (n = 4); insulin Propen (2) = 0.26 ± 0.02 (n = 3); Student’s t-test] (Fig. 4B).
Plasma and brain insulin measurements under feeding and fasting conditions
To probe the capacity of native Kv1.3 neuromodulation by insulin, we chose to measure insulin levels in both the plasma and the olfactory bulb of feeding adult rats (Fig. 5). Adult rats allowed to freely feed for 72 h had a plasma insulin level of 2.6 ± 1.0 ng/ml (n = 6), whereas rats that fasted for the same time interval had a significantly reduced plasma insulin level of 0.06 ± 0.04 ng/ml (n = 3; Student’s t-test). This represents a mean 43-fold increase in plasma insulin levels on feeding. Interestingly, the opposite response occurred in the olfactory bulb in response to feeding/fasting. Insulin levels thereby decreased in the olfactory bulb on feeding and significantly increased 15-fold on a 72-h fast [control = 0.25 ± 0.1 ng/g wet tissue homogenate (n = 5) and fasted = 3.7 ± 1.3 ng/g wet tissue homogenate (n = 4), Student’s t-test]. Insulin levels were not as high in P20 animals as compared with adults; however, the same response to fasting was measured. P20 rats demonstrated a fourfold increase in OB insulin (control = 0.18 ng/g wet tissue homogenate and fasted = 0.74 ng/g wet tissue homogenate, n = 6–8 each, significantly different Student’s t-test).
Fig. 5.
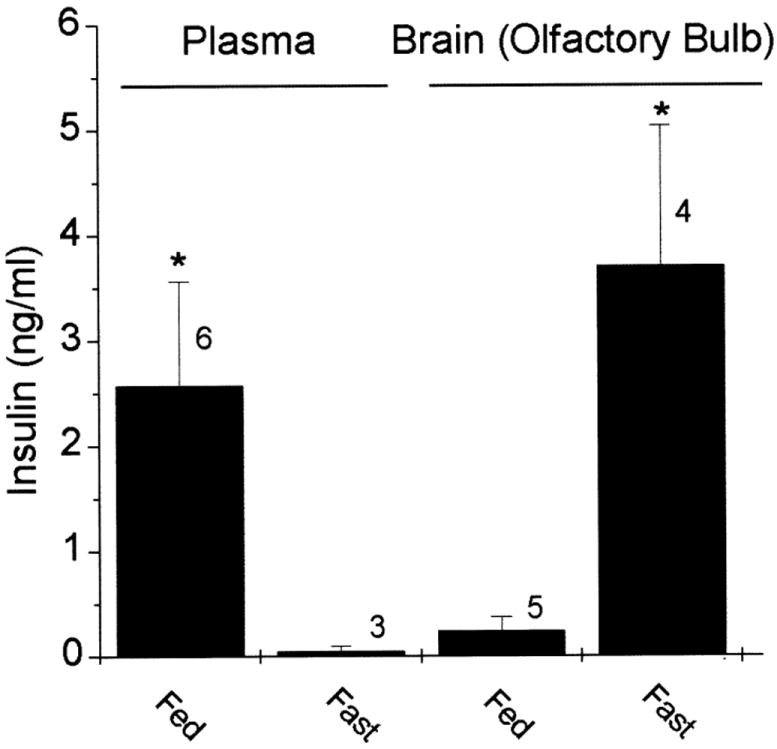
Insulin levels in plasma and olfactory bulb during feeding and fasting of adult rats. Histogram representation of the level of insulin in the plasma versus the olfactory bulb under freely feeding (Fed) or 72-h fasted (Fast) adult rats. Insulin levels were determined by ELISA; plasma insulin is in units of nanograms per milliliter plasma, whereas brain insulin is in units of nanograms per gram wet tissue homogenate. *Significantly different Student’s t-test (t′ statistic).
Localization and developmental expression of Kv1.3 and IR kinase in the olfactory bulb
Once we confirmed the presence of significant levels of insulin in the olfactory bulb, we explored the localization and developmental expression of the receptors for the ligand. Purified membranes from adult rat olfactory bulbs were separated by SDS-PAGE followed by Western analysis. The nitrocellulose was probed with antiserum against the β subunit of the human IR kinase. A band of approximately 120 kDa was observed in three brain regions (olfactory bulb, cerebral hemisphere, and cerebellum) that was absent in nonneural tissue (Fig. 6A). IR kinase was developmentally expressed in olfactory bulb membrane harvested from animals at various postnatal stages (P1 to P16) and the kinase persisted in the adult animal, which was defined at P60 (Fig. 6B).
Fig. 6.
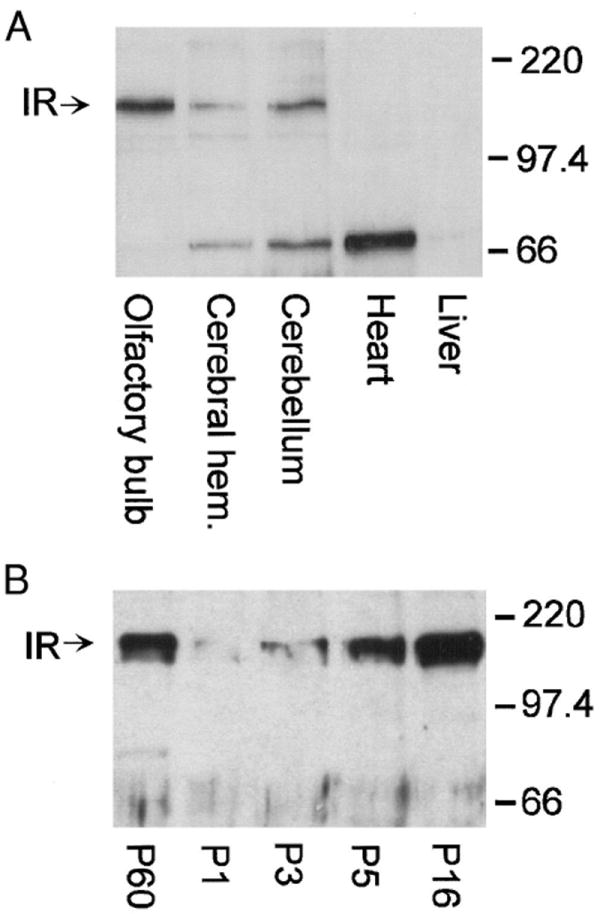
Localization and developmental expression of brain IR kinase. A: purified membrane preparations of various tissues harvested from adult rat as indicated and blotted with anti-IRβ (1:1,000). B: purified membrane preparation of olfactory bulb harvested from various postnatal stages as indicated and blotted with anti-IRβ (1:1,000). A and B, arrows: band corresponding to IR kinase (IR). Western blots are representative of 3 such blots, respectively.
The developmental expression of Kv1.3 and IR kinase was followed in cryosections of rat olfactory bulb harvested at various postnatal stages over a 1-mo time period (P1 to P29) (Fig. 7). If the Kv1.3 ion channel is modulated in native olfactory bulb, it would be beneficial to demonstrate that the two proteins were localized to the same cell types and during the same developmental time point. Unfortunately, the best commercially available IR kinase antibody that we tested in cryosections was a rabbit polyclonal antiserum, so we were unable to design traditional double-immunolabeling experiments with the Kv1.3 channel (also a rabbit polyclonal). Moreover, we were not successful in sequential double-labeling experiments for the channel and the kinase, which always demonstrated less intense immunolabeling with the antibody applied first in the series, most likely the result of washing and reincubation with the second primary antiserum (data not shown). Instead we double-labeled cryosections with the mouse monoclonal neural marker β tubulin III and compared kinase and channel labeling in sequentially cut sections (Fig. 7B). As also demonstrated by Western blot analysis (Fig. 6B), IR kinase was not strongly expressed in the first few days of postnatal development but Kv1.3 was ubiquitously expressed nonselectively throughout the bulb. During the first 10 days to 1 mo (P10 –P29), both proteins became strongly expressed in the outer nerve layer (ONL). After 3 wk (P20 –P29) distinct labeling of the dendrites of the mitral cells leading from the glomerular layer (GML) and strong expression in the external plexiform layer (EPL) was additionally visible. Both Kv1.3 and IR kinase labeled the inner granule cell layer (GCL, see Fig. 7A) but the expression of these proteins in this layer was independent of postnatal development (data not shown). In primary cell culture, olfactory bulb neurons increased labeling for Kv1.3 and IR kinase respectively, with days in vitro (DIV), as imaged by confocal microscopy through day 10 (Fig. 8A). Neurons with bipolar and tripolar morphology, indicative of granule and mitral cell types, respectively, both contained Kv1.3 and IR kinase as evidenced by immunolabeling and similar electrophysiological modulation by insulin. A total of 136 cells across 40 micrographs were examined for IR or Kv1.3 fluorescent signal intensity on DIV 2, 5, and 7. A total of three measurements were taken per neuron and each measurement was background-subtracted before calculation of a mean signal intensity for that cell. Three to five neurons were sampled per micrograph (Fig. 8B). The line graphs in Fig. 8B imply a time-dependent increase in protein expression over DIV for both of these proteins.
Fig. 7.
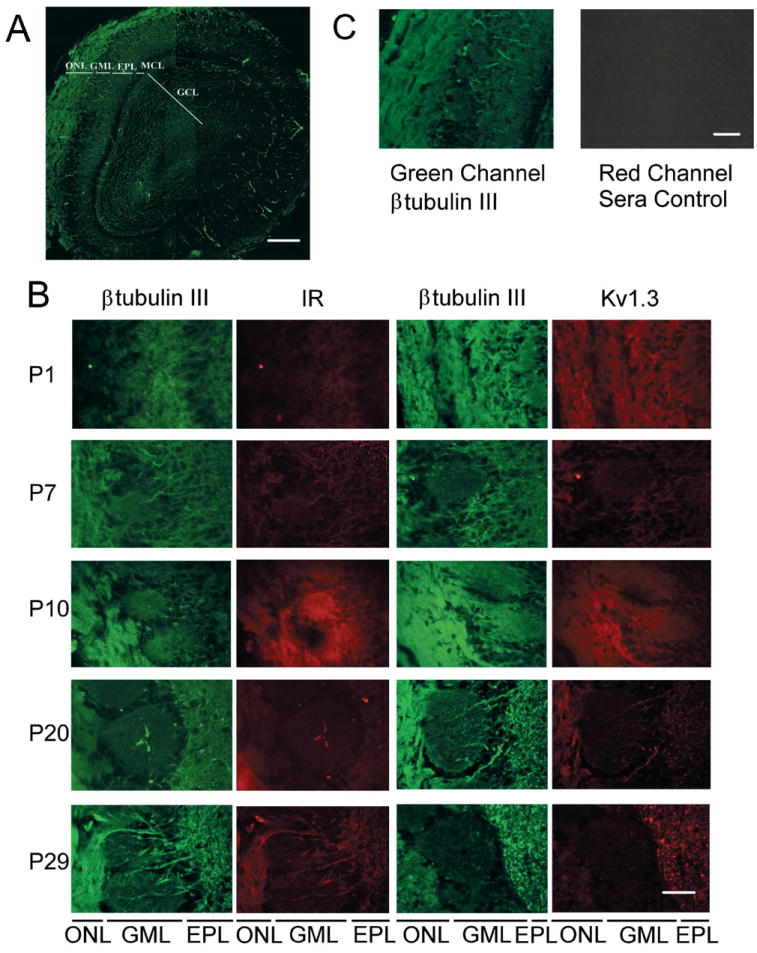
Localization of IR kinase and Kv1.3 in the neural lamina of the olfactory bulb. A: 12 photomicrographs of a single 10-micron cryosection from a P10 animal were taken at low-power magnification (bar = 500 μm) and then computer-overlayed to provide a full image of the neural lamina of the olfactory bulb as indicated. The section was immunolabeled with anti-β tubulin III (1:300). ONL, outer nerve layer; GML, glomerular layer; EPL, external plexiform layer; MCL, mitral cell layer; GCL, granular cell layer. B: various postnatal stages as indicated were double-labeled with β tubulin III (1:300) and IR (1:100) (left) or β tubulin (1:300) and Kv1.3 (1:200) (right). Abbreviations as in A. Bar = 50 μm. C: single cryosection from a P10 animal was immunolabeled with β tubulin III (1:300) and nonimmune rabbit serum (1:200). Section was observed with fluorescein-conjugated anti-mouse secondary antibody in the green channel (left) and rhodamine-conjugated anti-rabbit secondary antibody in the red channel (right). Note separation of signals under each filter set denoted by lack of signal under conditions in which Kv1.3 or IR antiserum was omitted. Bar = 100 μm.
Fig. 8.
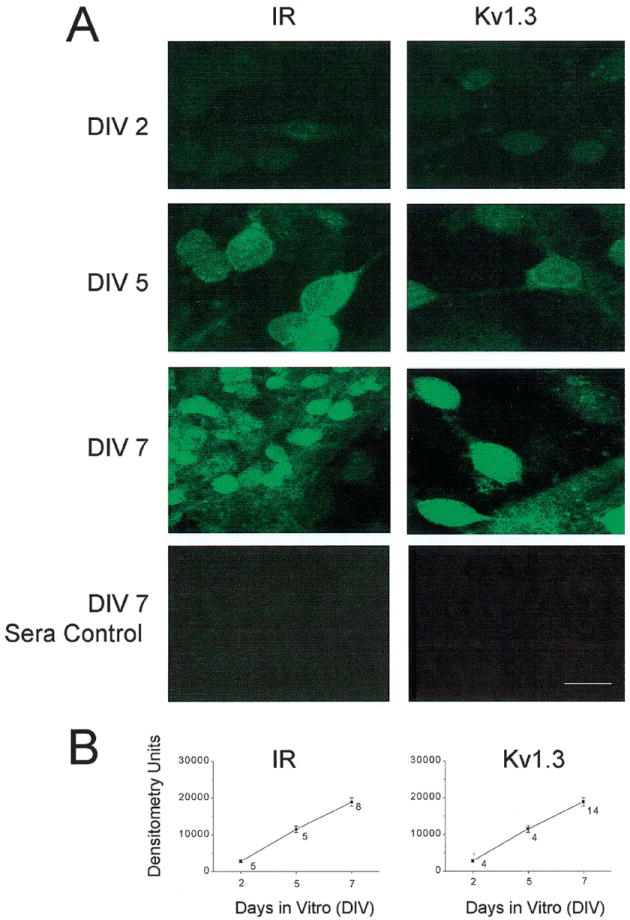
IR kinase and Kv1.3 expression in single olfactory bulb neurons (OBNs). A: cultured OBNs immunolabeled with IR (1:100) (left) or Kv1.3 (1:200) (right) and visualized with a fluorescein-isothiocyanate (FITC)-conjugated secondary antibody. Images were scanned using laser confocal microscopy and stored for later densitometric analysis. Note increase in label over days in vitro (DIV) and subcellular distribution to both the somata and processes of the developing OBNs. Bottom two panels are 1-wk-old cultured OBNs (DIV 7) incubated with nonimmune rabbit serum (1:200) in the absence of IR or Kv1.3 antiserum. Bar = 4 μm. B: line graphs representing the mean (± SE) densitometric units for the fluorescence signal generated by cultured OBNs immunolabeled with IR or Kv1.3 antiserum as in A. 3–5 cells were quantified per micrograph. Number of micrographs analyzed per DIV as indicated.
Odor/sensory deprivation alters phosphorylation, IR kinase expression, and neuromodulation of Kv1.3
Because IR kinase expression was highly localized to the outer nerve, glomerular, and external plexiform layers and this pattern of expression was developmentally regulated, we hypothesized that IR kinase and its subsequent neuromodulation of Kv1.3 ion channel may be involved in odor sensation or coding. We tested this hypothesis by performing left-naris occlusions by cauterization 24 h after birth and compared IR kinase expression, Kv1.3 expression, and total tyrosine phosphorylation in the olfactory bulb ipsilateral to the occlusion and its contralateral control 20 to 30 days after sensory/odor deprivation. We observed what previous studies have shown (reviewed in Brunjes 1994), that there is a differential in size of the olfactory bulbs after naris occlusion. The left olfactory bulb was significantly smaller (approximately 19%) in size (0.023 ± 0.0009 vs. 0.029 ± 0.001 g, paired t-test, n = 11) than the contralateral control olfactory bulb as can be visualized in the photograph in Fig. 9A. Naris occlusion reduced the thickness of the ONL, disrupted the ordered array of the glomeruli, reduced the size of the external plexiform layer, and the demarcation between the mitral and granule cell layer was lost (Fig. 9B). Even though the total size of the olfactory bulb was reduced and the ordered array of the neural lamina was clearly disrupted by naris occlusion, anti-β tubulin III strongly labeled the ONL, GML, and EPL in both the control and naris-occluded olfactory bulb at P30 (Fig. 9C, left). Double-labeling this same section with anti-IR kinase demonstrated a marked reduction in IR kinase signal in all three regions (Fig. 9C, right). IR kinase immunolabeling in the GCL did not appear affected by 30 days of naris occlusion (data not shown). Mean decrease in IR fluorescence signal as measured as a percentage drop in pixel density from the right (control) to the left (naris-occluded) olfactory bulb was the following: 54 ± 3% in the ONL, 27 ± 4% in the GML, 13 ± 5% in the EPL, and 3 ± 5% in the GCL. These data were collected by densitometric analysis of 10 individual sections generated from three different litters of naris-occluded animals.
Fig. 9.
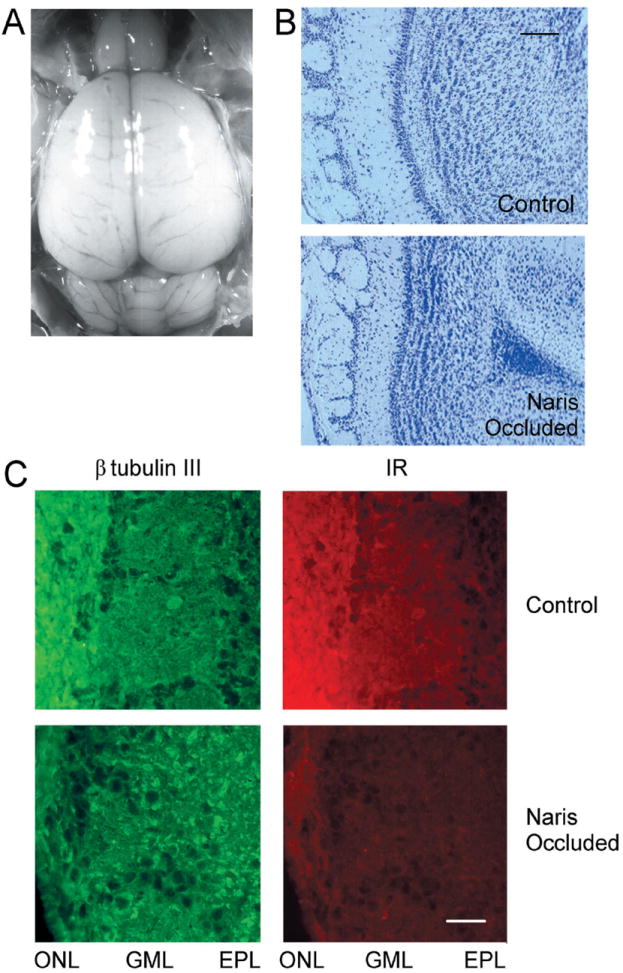
IR kinase is downregulated with unilateral naris occlusion. A: postnatal day 10 animal after left unilateral naris occlusion 24 h after birth. Note the slightly reduced size of the left olfactory bulb. B: 10-micron-thick cresyl violet stained cryosection of a postnatal day 10 animal after naris occlusion as in A. Shown is the control (right olfactory bulb, contralateral to occlusion) versus the naris-occluded (left olfactory bulb, ipsilateral to occlusion) cryosection at ×10 magnification. Note the apparent reduction in the ONL, disordered (and often missing in many sections) glomeruli, reduced thickness of the EPL, and lack of demarcation between the MCL and the GCL in the naris-occluded cryosection. Bar = 100 μm. C: 10-micron cryosections of a postnatal day 30 animal after naris occlusion as in A. Control and naris-occluded conditions were double-immunolabeled with anti-β tubulin III (1:300) and IR kinase (1:100) as indicated. Bar = 15 μm. Abbreviations as in Fig. 7.
Left (ipsilateral to naris occlusion) and right (contralateral control) olfactory bulb tissue were independently placed into primary cell culture 20 days after odor/sensory deprivation. Cultures derived from naris-occluded animals contained a higher proportion of fibroblasts and a lesser proportion of total neurons than that of control cultures. Cultures derived from naris-occluded versus control animals were plated at densities so as to contain approximately equal neurons as indexed by anti-β tubulin III immunoreactivity. In double-blind experiments, 10 to 20 fields of view were counted for Kv1.3 and IR kinase immunoreactive neurons across the two culture subtypes. Cultures derived from naris-occluded animals had significantly fewer neurons immunoreactive for IR kinase but a similar number of neurons immunoreactive for Kv1.3 (Student’s t-test, Fig. 10A). Voltage-clamp recordings taken from these two sets of cultures demonstrated similar mean outward current magnitude and kinetics, implying that the expressed Kv1.3 ion channel protein in these P20 cultured neurons was not functionally altered (Table 2); however, neurons cultured from naris-occluded animals lacked insulin-induced current suppression of the outward Kv1.3 current (Fig. 10B). These data suggest that kinase activity in the olfactory bulb is dependent on sensory experience in the naris.
Fig. 10.
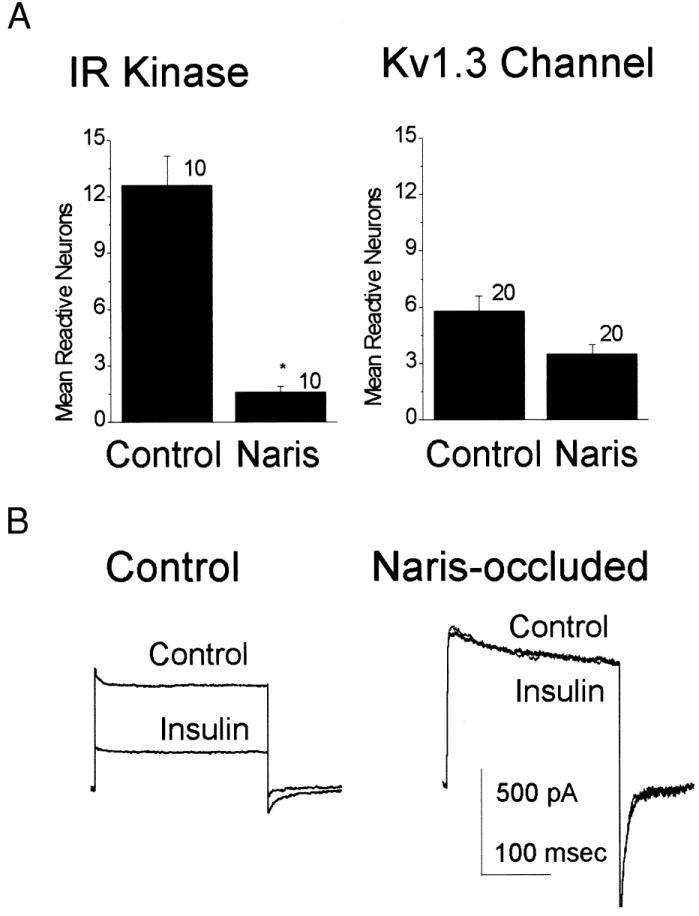
Neuromodulation of Kv1.3 by IR kinase is activity dependent. A: olfactory bulbs from control or naris-occluded animals were harvested at P20 and placed into primary cell culture at equivalent neuronal cell density. Plot of the mean reactive neurons that were immunolabeled for IR kinase or Kv1.3 channel and counted in a double-blind experiment across 10 to 20 microcopic fields. *Significantly different Student’s t-test. B: voltage-clamp recordings in the whole-cell configuration for the primary cultures described in A. Neurons were held at –90 mV and stepped to a single depolarizing potential of +40 mV before (Control) and after (Insulin) 20-min bath application of 0.1 μg/ml insulin. For statistical comparisons, see Table 2.
DISCUSSION
The discovery of the hormone insulin and IR kinase in the CNS has prompted many investigators to reconsider the physiological role for insulin signaling in the brain, once considered an insulin-independent organ (Zaia and Piantanelli 1997). We show that insulin induces current suppression of a predominant voltage-gated ion channel (Kv1.3) in the olfactory bulb. Modulation is the result of tyrosine phosphorylation of Kv1.3 channel protein at multiple discreet sites similar to that of IRS, the traditional downstream target for IR kinase in the periphery. IR kinase is developmentally expressed in the neural lamina of the OB and the pattern of expression is disrupted after 20 to 30 days of odor/sensory deprivation induced by unilateral naris occlusion. Modulation of OB neuronal outward current by insulin is activity dependent and is not observed after naris closure. The continual regulation of neuronal excitability by brain IR kinase could be one of many physiological roles for insulin signaling in the CNS—short-term modulation of ongoing electrical activity to fine-tune developing and ongoing neuronal circuits via phosphorylation.
Our data indicate that insulin activation of IR kinase in a heterologous expression system induces current suppression and concomitant tyrosine phosphorylation of Kv1.3 ion channel. Modulation of the channel is dependent on the kinase activity of IR, as demonstrated by the lack of Kv1.3 current suppression induced by the IR mutant (IRtrunc). We do not know, however, whether the signaling cascade is direct or whether there is an intermediate step between IR kinase activation and Kv1.3 channel tyrosine phosphorylation. nShc is an example of an adaptor protein that is readily phosphorylated by IR kinase (Nakamura et al. 1998; Paez-Espinosa et al. 1998), is highly expressed in the OB (Yip et al. 1980), and could recruit a variety of protein modules to affect Kv1.3 channel properties or phosphorylation state via SH2 or SH3 recognition sites in the ion channel. The cellular tyrosine kinase src is also highly expressed in the OB independent of postnatal development (data not shown) and we have previously demonstrated that Srcpp60 perfused OBNs undergo a time-dependent decrease in current magnitude (Fadool and Levitan 1998). Hilborn and colleagues (1998) have demonstrated that members of the receptor-linked tyrosine kinases modulate sodium channel properties indirectly via src signaling pathways. That insulin induces current suppression of outward currents in native olfactory bulb neurons as well as in Kv1.3 + IR cotransfected HEK 293 cells implies that insulin activation of IR kinase triggers the same event in both systems, regardless of whether it is a direct or indirect mechanism.
In the olfactory bulb, soon after the action potential discharge begins in the mitral cell (Kauer 1991), the pattern and intensity of the discharge is shaped by the action of local circuits (Hamilton and Kauer 1989) and the inherent ionic conductances of the neurons (Mori 1987). K channels make major contributions to these conductances (Egan et al. 1992b). To understand the capacity of electrical signaling in the OB, one must ultimately elucidate the mechanisms by which channel proteins respond to biochemical changes at specific modulatory sites (Levitan 1994). Site-directed mutagenesis of tyrosine phosphorylation recognition motifs in Kv1.3 demonstrates that multiple sites in a single protein are modulated by IR kinase activation. Although our investigation was restricted to Kv1.3 channel protein, there are other types of potassium voltage-gated ion channels that underlie currents in mitral and granule cells (e.g., Kv1.4; A-type currents) (Bardoni et al. 1996; Chen and Shepherd 1997) and which contain similar consensus sequences for tyrosine phosphorylation (Jonas and Kaczmarek 1996). GABAminergic and glutaminergic synaptic pathways have been well defined in specific olfactory connections involved in odor processing (reviewed in Issacson and Strowbridge 1998; Shipley and Ennis 1996; Trombley and Shepherd 1993) receptors that could be modulated by IR kinase phosphorylation, as has been demonstrated in other cell systems for β-adrenergic, g-aminobutyric acid (GABA), and N-methyl-d-aspartate (NMDA) receptors (Chen and Leonard 1996; Karoor et al. 1998; Wang and Salter 1994).
The brain insulin receptor α and β subunits have different molecular weights because of differences in carbohydrate moieties of the peripheral IR kinase (Heidenreich et al. 1983; Hendricks et al. 1984; Yip et al. 1980). In the olfactory bulb and two other brain regions we found that the IR kinase β subunit was slightly larger (~ 120 kDa) than that reported for the peripheral IR kinase (97 kDa) (Waldbillig and LeRoith 1987). It has been suggested that the brain IR may be a hybrid consisting of an αβ insulin receptor subunit and an αβ IGF I receptor subunit (Moxham et al. 1989; Waldbillig and LeRoith 1987). The hybrid receptors would have dual specificity for insulin and IGF I. IGF I IR has been reported in the GML, EPL, and MCL of the olfactory bulb (Bondy et al. 1992; Russo et al. 1994; Werther et al. 1990), which is not unlike our present observed distribution for IR kinase in these neural lamina (Fig. 7). The potential for a hybrid receptor therefore exists; however, the dual specificity of ligand activation is unclear given that IGF I appears not to modulate Kv1.3 channel properties in these neurons (Table 2).
IR knock-out mice have been shown to display normal features at birth, but on feeding die of diabetic ketoacidosis within a few days (Accili 1997). By using naris occlusion, we were able to restrict the IR kinase decrease in expression, presumably, to only the OB to discern whether IR kinase or tyrosine phosphorylation was tied with sensory experience. Our data indicate that there is a decrease in tyrosine phosphorylation after naris occlusion and a reduction of IR kinase in the ONL, EPL, and MCL. Based on autoradiography studies (Baskin et al. 1983; Young et al. 1980) and insulin binding sites in subcellular fractions (dendrodendritic synaptosomes) (Matsumoto and Rhoads 1990), insulin has been proposed as a modulator of mitral-granule cell synaptic transmission as well as final output of the mitral cells to the olfactory cortex (Baskin et al. 1983). Sensory experience or a developmental critical period appears to be essential in expression of insulin receptors in the external plexiform and mitral cell layers that contain these synaptic connections (Fig. 9). The most marked change after naris occlusion, 30-day lack of sensory input, was the decrease of IR kinase in the ONL. The failure of axonal maintenance from the periphery was disrupted as was the robust expression of IR kinase in these axons. Activation of IR kinase may be necessary in this area of the brain that supports continual synaptogenesis and neuronal remodeling of peripheral axons throughout adult life to fine-tune the proper topographical map for odor coding within the OB. Future experimentation in this area is needed to explore this potential function of brain insulin signaling.
In diabetic-induced rats, levels of plasma insulin appreciably fall, whereas levels of brain insulin receptor binding and total IR protein remain unaltered (Gupta et al. 1992). Diabetes also causes an increase in brain IR kinase activity that is markedly localized to the olfactory bulb (Folli et al. 1994; Gupta et al. 1992). This is not unlike what we observed in the olfactory bulb, ipsilateral to naris occlusion. Whereas the total IR protein was not altered across the control and naris-occluded treatments (data not shown; SDS-PAGE), IR immunoreactivity was reduced in discreet cell types (Figs. 8 and 9). The kinase activity, however, was altered in these neurons, as evidenced by changes in total tyrosine phosphorylation (data not shown) and lack of insulin-induced current suppression (Fig. 10). Clearly alteration of IR kinase activity induced by a metabolic or other disease state (reviewed in Wickelgren 1998) would alter the current properties of Kv1.3 as did changes in IR kinase activities produced by sensory/odor deprivation.
It is possible that insulin in the brain could also be used as a satiety factor. After a meal, blood insulin levels would rise in response to increased serum levels of glucose. This peripheral insulin is conjectured to cross the blood– brain barrier and chaperon glucose into brain neurons. Our data suggest that there is a clear differential between the levels of insulin in the plasma and that found in the OB. OB insulin levels are low after a meal. Eating has been shown to alter the response of the olfactory system to sensory input (Cain 1975). Insulin-induced modulation of electrical signaling in the OB could afford a potential mechanism. In alignment with this hypothesis is the fact that brain insulin is reported to be highly retained during periods of starvation (Cashion et al. 1996). Our data indicate that insulin is elevated in the olfactory bulb after a 72-h fast. This elevation in insulin could modulate total outward current in OBNs to change the shape and duration of action potentials produced in these neurons. Further experiments are required to delineate whether insulin is produced locally by the OBNs in response to fasting or whether it is retained or even selectively pumped across the blood– brain barrier.
Insulin receptor kinase modulates the activity of a predominant voltage-gated ion channel by tyrosine phosphorylation at multiple sites in the amino and carboxyl terminus of Kv1.3 ion channel protein. In a region of the brain where IRS expression is reported weak or totally absent (Folli et al. 1994), the downstream docking protein for insulin receptor activation may be the ion channel itself. Kv1.3 ion channel and IRS are similar in that they both lack Asp-Phe-Gly and Ala-Pro-Glu motifs diagnostic of a protein kinase; neither has endogenous kinase activity or undergoes autophosphorylation (Sun et al. 1991). As the putative roles for the brain IR are explored, it will be important not to limit its potential role to a single function, especially given the regenerative nature of the olfactory system, where a molecule acting as a combined neuromodulator, mediator of energy metabolism, and a growth factor would be well served.
Acknowledgments
The authors thank Drs. Ray Henry, Steve Kempf, Mary Mendonca, Sadik Tuzan, Marie Wooten, and Michael Wooten for access to technical equipment necessary to perform our study. We thank T. Tabb for technical assistance; D. Person, B. Rimel, and S. Wazeerud-din for assistance with the occlusions and ELISA protocols; and Drs. Jim Fadool, Frank Simmen, and Vitaly Vodanyoy for constructive reading of the manuscript.
This research was supported by National Institute on Deafness and Other Communication Disorders Grant R29DC-03387 to D. A. Fadool, a Howard Hughes Precollege Life Scholars Award at Auburn University to J. A. Simmen, and an undergraduate scholarship from the Department of Microbiology/Botany of Auburn University to J. J. Phillips.
References
- Accili D. Insulin receptor knock-out mice. Trends Endocrinol Metab. 1997;8:101–104. doi: 10.1016/s1043-2760(97)00031-3. [DOI] [PubMed] [Google Scholar]
- Adamo M, Raizada MK, LeRoith D. Insulin and insulin-like growth factor receptors in the nervous system. Mol Neurobiol. 1989;3:71–100. doi: 10.1007/BF02935589. [DOI] [PubMed] [Google Scholar]
- Adlrich RW, Yellen G. Analysis of nonstationary channel kinetics. In: Sakmann B, Neher E, editors. Single-Channel Recording. New York: Plenum Press; 1983. pp. 287–299. [Google Scholar]
- Bardoni R, Puopolo M, Magherini PC, Belluzzi O. Potassium currents in periglomerular cells of frog olfactory bulb in vitro. Neurosci Lett. 1996;210:95–98. doi: 10.1016/0304-3940(96)12677-x. [DOI] [PubMed] [Google Scholar]
- Baskin DG, Porte D, Jr, Guest K, Dorsa DM. Regional concentrations of insulin in the rat brain. Endocrinology. 1983;112:898–903. doi: 10.1210/endo-112-3-898. [DOI] [PubMed] [Google Scholar]
- Bondy C, Werner H, Roberts CT, JR, LeRoith D. Cellular pattern of type-1 insulin-like growth factor receptor gene expression during maturation of the rat brain: comparison with insulin-like growth factors I and II. Neuroscience. 1992;46:909–923. doi: 10.1016/0306-4522(92)90193-6. [DOI] [PubMed] [Google Scholar]
- Bowlby MR, Fadool DA, Holmes TC, Levitan IB. Modulation of the Kv1.3 potassium channel by receptor tyrosine kinases. J Gen Physiol. 1997;110:601–610. doi: 10.1085/jgp.110.5.601. [DOI] [PMC free article] [PubMed] [Google Scholar]
- Boyd FT, Clarke DW, Mather TF, Raizada MK. Insulin receptors and insulin modulation of norepinephrine uptake in neuronal cultures from rat brain. J Biol Chem. 1985;260:15880–15884. [PubMed] [Google Scholar]
- Bozza TC, Kauer JS. Odorant response properties of convergent olfactory receptor neurons. J Neurosci. 1998;18:4560–4569. doi: 10.1523/JNEUROSCI.18-12-04560.1998. [DOI] [PMC free article] [PubMed] [Google Scholar]
- Brunjes PC. Unilateral naris closure and olfactory system-development. Brain Res Rev. 1994;19:146–160. doi: 10.1016/0165-0173(94)90007-8. [DOI] [PubMed] [Google Scholar]
- Cai Y-C, Douglass J. In vivo and in vitro phosphorylation of the T lymphocyte type n (Kv1.3) potassium channel. J Biol Chem. 1993;268:23720–23727. [PubMed] [Google Scholar]
- Cain DP. Effects of insulin injection on responses of olfactory bulb and amygdala single units to odors. Brain Res. 1975;99:69–83. doi: 10.1016/0006-8993(75)90609-5. [DOI] [PubMed] [Google Scholar]
- Cashion MF, Banks WA, Kastin AJ. Sequestration of centrally administered insulin by the brain: Effects of starvation, aluminum, and TNF-α. Horm Behav. 1996;30:280–286. doi: 10.1006/hbeh.1996.0034. [DOI] [PubMed] [Google Scholar]
- Chen S, Leonard JP. Protein tyrosine kinase-mediated potentiation of currents from cloned NMDA receptors. J Neurochem. 1996;67:194–200. doi: 10.1046/j.1471-4159.1996.67010194.x. [DOI] [PubMed] [Google Scholar]
- Chen WR, shepherd GM. Membrane and synaptic properties of mitral cells in slice of rat olfactory bulb. Brain Res. 1997;745:189–196. doi: 10.1016/s0006-8993(96)01150-x. [DOI] [PubMed] [Google Scholar]
- De Meyts P, Christoffersen CT, Urso B, Wallach B, Gronskov K, Yakushiji F, Shymko RM. Role of the time factor in signaling specificity: application to mitogenic and metabolic signaling by the insulin and insulin-like growth factor-I receptor tyrosine kinases. Metabolism. 1995;44:2–11. doi: 10.1016/0026-0495(95)90214-7. [DOI] [PubMed] [Google Scholar]
- Egan TM, Dagan D, Kupper J, Levitan IB. Properties and rundown of sodium-activated potassium channels in rat olfactory bulb neurons. J Neurosci. 1992a;12:1964–1976. doi: 10.1523/JNEUROSCI.12-05-01964.1992. [DOI] [PMC free article] [PubMed] [Google Scholar]
- Egan TM, Dagan D, Kupper J, Levitan IB. Na+-activated K+ channels are widely distributed in rat CNS and Xenopus oocytes. Brain Res. 1992b;584:319–321. doi: 10.1016/0006-8993(92)90913-t. [DOI] [PubMed] [Google Scholar]
- Ellis L, Clauser E, Morgan DO, Edery M, Roth RA, Rutter WJ. Replacement of insulin receptor tyrosine residues 1162 and 1163 compromises insulin-stimulated kinase activity and uptake of 2-deoxyglucose. Cell. 1986;45:721–732. doi: 10.1016/0092-8674(86)90786-5. [DOI] [PubMed] [Google Scholar]
- Fadool DA, Ache BW. Plasma membrane inositol 1,4,5-trisphosphate- activated channels mediate signal transduction in lobster olfactory receptor neurons. Neuron. 1992;9:907–918. doi: 10.1016/0896-6273(92)90243-7. [DOI] [PMC free article] [PubMed] [Google Scholar]
- Fadool DA, Estey SJ, Ache BW. Evidence that a Gq-protein mediates excitatory odor transduction in lobster olfactory receptor neurons. Chem Senses. 1995;20:489–498. doi: 10.1093/chemse/20.5.489. [DOI] [PubMed] [Google Scholar]
- Fadool DA, Levitan IB. Modulation of olfactory bulb neuron potassium current by tyrosine phosphorylation. J Neurosci. 1998;18:6126–6137. doi: 10.1523/JNEUROSCI.18-16-06126.1998. [DOI] [PMC free article] [PubMed] [Google Scholar]
- Folli F, Bonfanti L, Renard E, Kahn CR, Merighi A. Insulin receptor substrate-1 (IRS-1) distribution in the rat central nervous system. J Neurosci. 1994;14:6412–6422. doi: 10.1523/JNEUROSCI.14-11-06412.1994. [DOI] [PMC free article] [PubMed] [Google Scholar]
- Graziadei PPC, Monti-Graziadei GA. Handbook of Sensory Physiology: Development of Sensory Systems. Berlin: Springer; 1978. p. 55. [Google Scholar]
- Gupta G, Azam M, Baquer NZ. Modulation of rat brain insulin receptor kinase activity in diabetes. Neurochem Int. 1992;20:487–492. doi: 10.1016/0197-0186(92)90027-o. [DOI] [PubMed] [Google Scholar]
- Hamilton KA, Kauer JS. Patterns of intracellular potentials in salamander mitral/tufted cells in response to odor stimulation. J Neurosci. 1989;62:609–625. doi: 10.1152/jn.1989.62.3.609. [DOI] [PubMed] [Google Scholar]
- Heidenreich KA, Zahniser NR, Berhanu P, Brandenburg D, Olefsky JM. Structural differences between insulin receptors in the brain and peripheral target tissues. J Biol Chem. 1983;258:8527–8530. [PubMed] [Google Scholar]
- Hendricks SA, Agardh C-D, Taylor S, Roth J. Unique features of the insulin receptors on rat brain. J Neurochem. 1984;43:1302–1309. doi: 10.1111/j.1471-4159.1984.tb05387.x. [DOI] [PubMed] [Google Scholar]
- Hilborn MD, Vaillancourt RR, Rane SG. Growth factor receptor tyrosine kinase acutely regulate neuronal sodium channels through the src signaling pathway. J Neurosci. 1998;18:590–600. doi: 10.1523/JNEUROSCI.18-02-00590.1998. [DOI] [PMC free article] [PubMed] [Google Scholar]
- Hill JM, Lesniak MA, Pert CB, Roth J. Autoradiographic localization of insulin receptors in rat brain: prominence in olfactory and limbic areas. Neuroscience. 1986;17:1127–1136. doi: 10.1016/0306-4522(86)90082-5. [DOI] [PubMed] [Google Scholar]
- Holmes TC, Berman K, Swartz JE, Dagan D, Levitan IB. Expression of voltage-gated potassium channels decreases cellular protein tyrosine phosphorylation. J Neurosci. 1997;17:8964–8974. doi: 10.1523/JNEUROSCI.17-23-08964.1997. [DOI] [PMC free article] [PubMed] [Google Scholar]
- Huang X-Y, Morielli AD, Peralta EG. Tyrosine kinase-dependent suppression of a potassium channel by the G protein-coupled m1 muscarinic acetylcholine receptor. Cell. 1993;75:1145–1156. doi: 10.1016/0092-8674(93)90324-j. [DOI] [PubMed] [Google Scholar]
- Hubbard MJ, Cohen P. On target with a new mechanism for the regulation of protein phosphorylation. Trends Biochem Sci. 1993;18:172–177. doi: 10.1016/0968-0004(93)90109-z. [DOI] [PubMed] [Google Scholar]
- Huettner JE, Baughman RW. Primary culture of identified neurons form the visual cortex of postnatal rats. J Neurosci. 1986;6:3044–3060. doi: 10.1523/JNEUROSCI.06-10-03044.1986. [DOI] [PMC free article] [PubMed] [Google Scholar]
- Hunter T. The Croonian Lecture 1997. The phosphorylation of proteins on tyrosine: its role in cell growth and disease. Philos Trans R Soc Lond B Biol Sci. 1998;353:583–605. doi: 10.1098/rstb.1998.0228. [DOI] [PMC free article] [PubMed] [Google Scholar]
- Issacson JS, Strowbridge BW. Olfactory reciprocal synapses: dendritic signaling in the CNS. Neuron. 1998;20:749–761. doi: 10.1016/s0896-6273(00)81013-2. [DOI] [PubMed] [Google Scholar]
- Jonas EA, Kaczmarek LK. Regulation of potassium channels by protein kinases. Curr Opin Neurobiol. 1996;6:318–323. doi: 10.1016/s0959-4388(96)80114-0. [DOI] [PubMed] [Google Scholar]
- Jonas EA, Knox RJ, Kaczmarek LK, Schwartz JH, Solomon DH. Insulin receptor in Aplysia neurons: characterization, molecular cloning, and modulation of ion currents. J Neurosci. 1996;16:1645–1658. doi: 10.1523/JNEUROSCI.16-05-01645.1996. [DOI] [PMC free article] [PubMed] [Google Scholar]
- Karoor V, Wang L, Wang H, Malbon CC. Insulin stimulates sequestration of β-adrenergic receptors and enhanced association of β-adrenergic receptors with Grb2 via tyrosine 350. J Biol Chem. 1998;273:33035–33041. doi: 10.1074/jbc.273.49.33035. [DOI] [PubMed] [Google Scholar]
- Kauer JS. Contributions of topography and parallel processing to odor coding in the vertebrate olfactory pathway. Trends Neurosci. 1991;14:79–85. doi: 10.1016/0166-2236(91)90025-p. [DOI] [PubMed] [Google Scholar]
- Kues WA, Wunder F. Heterogeneous expression patterns of mammalian potassium channel genes in developing and adult rat brain. Eur J Neurosci. 1992;4:1296–1308. doi: 10.1111/j.1460-9568.1992.tb00155.x. [DOI] [PubMed] [Google Scholar]
- Kupper J, Bowlby MR, Marom S, Levitan IB. Intracellular and extracellular amino acids that influence C-type inactivation and its modulation in a voltage-dependent potassium channel. Pfluegers Arch. 1995;430:1–11. doi: 10.1007/BF00373833. [DOI] [PubMed] [Google Scholar]
- Levitan IB. Modulation of ion channels by protein phosphorylation and dephosphorylation. Annu Rev Physiol. 1994;56:193–212. doi: 10.1146/annurev.ph.56.030194.001205. [DOI] [PubMed] [Google Scholar]
- Marom S, Goldstein SAN, Kupper J, Levitan IB. Mechanism and modulation of inactivation of the Kv3 potassium channel. Receptors Channels. 1993;1:81–88. [PubMed] [Google Scholar]
- Matsumoto H, Rhoads DE. Specific binding of insulin to membranes from dendrodendritic synaptosomes of rat olfactory bulb. J Neurochem. 1990;54:347–350. doi: 10.1111/j.1471-4159.1990.tb13321.x. [DOI] [PubMed] [Google Scholar]
- Meisami E. Effects of olfactory deprivation on postnatal growth of the rat olfactory bulb utilizing a new method for production of neonatal unilateral anosmia. Brain Res. 1976;107:437–444. doi: 10.1016/0006-8993(76)90243-2. [DOI] [PubMed] [Google Scholar]
- Mori K. Membrane and synaptic properties of identified neurones in the olfactory bulb. Prog Neurobiol. 1987;29:275–320. doi: 10.1016/0301-0082(87)90024-4. [DOI] [PubMed] [Google Scholar]
- Moxham CP, Duronio V, Jacobs S. Insulin-like growth factor-1 receptor b-subunit heterogeneity: evidence for hybrid tetramers composed of insulin-like growth factor I and insulin receptor heterotetramers. J Biol Chem. 1989;264:13238–13244. [PubMed] [Google Scholar]
- Myers MG, JR, White MF. The new elements of insulin signaling: insulin receptor substrate-1 and proteins with SH2 domains. Diabetes. 1993;42:643–650. doi: 10.2337/diab.42.5.643. [DOI] [PubMed] [Google Scholar]
- Myers MG, JR, White MF. Insulin signal transduction and the IRS proteins. Annu Rev Pharmacol Toxicol. 1996;36:615–658. doi: 10.1146/annurev.pa.36.040196.003151. [DOI] [PubMed] [Google Scholar]
- Nakamura T, Muraoka S, Sanokawa R, Mori N. N-shc and sck, two neuronally expressed shc adapter homologs: their differential regional expression in the brain and roles in neurotrophin and src signaling. J Biol Chem. 1998;273:6960–6967. doi: 10.1074/jbc.273.12.6960. [DOI] [PubMed] [Google Scholar]
- Paez-Espinosa V, Carvalho CRO, Alvarez-Rojas F, Janeri L, Velloso LA, Boschero AC, Saad MJA. Insulin induces tyrosine phosphorylation of shc and stimulates shc/grb2 association in insulin-sensitive tissues of the intact rat. Endocr J. 1998;8:193–200. doi: 10.1385/ENDO:8:2:193. [DOI] [PubMed] [Google Scholar]
- Pawson T. Protein modules and signalling networks. Nature. 1995;373:573–580. doi: 10.1038/373573a0. [DOI] [PubMed] [Google Scholar]
- Philpot BD, Lim JH, Halpain S, Brunjes PC. Experience-dependent modification in MAP2 phosphorylation in rat olfactory bulb. J Neurosci. 1997;17:9596–9604. doi: 10.1523/JNEUROSCI.17-24-09596.1997. [DOI] [PMC free article] [PubMed] [Google Scholar]
- Ressler KJ, Sullivan SL, Buck LB. Information coding in the olfactory system: evidence for a stereotyped and highly organized epitope map in the olfactory bulb. Cell. 1994;79:1245–1255. doi: 10.1016/0092-8674(94)90015-9. [DOI] [PubMed] [Google Scholar]
- Rotwein P, Burgess SK, Milbrandt JD, Krause JE. Differential expression of insulin-like growth factor genes in rat central nervous system. Proc Natl Acad Sci USA. 1988;85:265–269. doi: 10.1073/pnas.85.1.265. [DOI] [PMC free article] [PubMed] [Google Scholar]
- Russo VC, Edmondson SR, Mercuri FA, Buchanan CR, Werther GA. Indentification, localization, and regulation of insulin-like growth factor binding proteins and their messenger ribonucleic acids in the newborn rat olfactory bulb. Endocrinology. 1994;135:1437–1446. doi: 10.1210/endo.135.4.7523098. [DOI] [PubMed] [Google Scholar]
- Sambrook J, Fritsch EF, Maniatas T. Molecular Cloning: A Laboratory Manual. Cold Spring Harbor, NY: Cold Spring Harbor Laboratory; 1989. [Google Scholar]
- Shipley MT, Ennis M. Functional organization of the olfactory system. J Neurobiol. 1996;30:123–176. doi: 10.1002/(SICI)1097-4695(199605)30:1<123::AID-NEU11>3.0.CO;2-N. [DOI] [PubMed] [Google Scholar]
- Skolnik EY, Batzer A, Li N, Lee CH, Lowestein EJ, Mohammadi M. The function of GRB2 in linking the insulin receptor to Ras signaling pathways. Science. 1993;260:1953–1955. doi: 10.1126/science.8316835. [DOI] [PubMed] [Google Scholar]
- Smith M, Clemens J, Kerchner GA, Mendelsohn LG. The insulin-like growth factor-II (IGF-II) receptor of rat brain: regional distribution visualized by autoradiography. Brain Res. 1988;445:241–246. doi: 10.1016/0006-8993(88)91185-7. [DOI] [PubMed] [Google Scholar]
- Sun H, Tonks NK. The coordinated action of protein tyrosine phosphatases and kinases in cell signaling. Trends Biochem Sci. 1994;19:480–485. doi: 10.1016/0968-0004(94)90134-1. [DOI] [PubMed] [Google Scholar]
- Sun XJ, Rothenberg P, Kahn CR, Backer JM, Araki E, Wilden PA, Cahill DA, Goldstein BJ, White MF. Structure of the insulin receptor substrate IRS-1 defines a unique signal transduction protein. Nature. 1991;352:73–77. doi: 10.1038/352073a0. [DOI] [PubMed] [Google Scholar]
- Tricarico D, Mallamaci R, Barbieri M, Camerino DC. Modulation of ATP-sensitive K+ channel by insulin in rat skeletal muscle fibers. Biochem Biophys Res Commun. 1997;232:536–539. doi: 10.1006/bbrc.1997.6320. [DOI] [PubMed] [Google Scholar]
- Trombley PQ, Shepherd GM. Synaptic transmission and modulation in the olfactory bulb. Curr Opin Neurobiol. 1993;3:540–547. doi: 10.1016/0959-4388(93)90053-2. [DOI] [PubMed] [Google Scholar]
- Waldbillig RJ, LeRoith D. Insulin receptors in the peripheral nervous system: a structural and functional analysis. Brain Res. 1987;409:215–220. doi: 10.1016/0006-8993(87)90704-9. [DOI] [PubMed] [Google Scholar]
- Wang YT, Salter MW. Regulation of NMDA receptors by tyrosine kinases and phosphatases. Nature. 1994;369:233–235. doi: 10.1038/369233a0. [DOI] [PubMed] [Google Scholar]
- Werther GA, Abate M, Hogg A, Oldfield B, Hudson P, Freed K, Herington AC. Localisation of IGF-1 mRNA in rat brain by in situ hybridisation—relationship to IGF-1 receptors. Mol Endocrinol. 1990;4:773–778. doi: 10.1210/mend-4-5-773. [DOI] [PubMed] [Google Scholar]
- White MF. The insulin signalling system and the IRS proteins. Diabetalogia. 1997;40:S2–S17. doi: 10.1007/s001250051387. [DOI] [PubMed] [Google Scholar]
- Wickelgren I. Tracking insulin to the mind. Science. 1998;280:517–519. doi: 10.1126/science.280.5363.517. [DOI] [PubMed] [Google Scholar]
- Wilson GF, Kaczmarek LK. Mode-switching of a voltage-gated cation channel is mediated by a protein kinase A-regulated tyrosine phosphatase. Nature. 1993;366:433–438. doi: 10.1038/366433a0. [DOI] [PubMed] [Google Scholar]
- Yip CC, Moule ML, Yeung CWT. Characterization of insulin receptor subunits in brain and other tissue by photoaffinity labeling. Biochem Biophys Res Commun. 1980;96:1671–1678. doi: 10.1016/0006-291x(80)91366-2. [DOI] [PubMed] [Google Scholar]
- Young WS, Kuhar MJ, Roth J, Brownstein MJ. Radiohistochemical localization of insulin receptors in the adult and developing brain. Neuropeptides. 1980;1:15–22. [Google Scholar]
- Zaia A, Piantanelli L. Insulin receptors in mouse brain: age-related modifications are corrected by thymus graft. Mech Ageing Dev. 1997;98:37–46. doi: 10.1016/s0047-6374(97)00066-3. [DOI] [PubMed] [Google Scholar]