

Abstract
Background:
Younger ages at diagnosis for blacks compared with whites have been reported for several cancer types. However, the US black population is younger than the white population, which may bias age comparisons that do not account for the populations at risk.
Methods:
We analyzed Surveillance, Epidemiology, and End Results data for non-Hispanic blacks and non-Hispanic whites from 18 regions for the year 2010. We calculated crude mean ages at diagnosis among cases of 29 cancer types for whites and blacks. Separately, we calculated adjusted means that corrected for differences in population structure, which we obtained by fitting linear regression models to the ages at diagnosis with statistical weights specific to age and sex. Negative differences indicate younger ages in blacks, while positive differences indicate older ages in blacks. All statistical tests were two-sided.
Results:
Based on crude means, blacks were diagnosed at younger ages than whites for nearly every cancer type. However, adjustment for population structure shifted the comparisons toward older ages among blacks, and only six statistically significant differences of three or more years remained. Blacks were younger than whites at diagnosis for Kaposi sarcoma (-10.2 years), male soft tissue cancer (-5.6), male anal cancer (-5.5), and non-Hodgkin’s lymphoma (-3.7), but older for cervical cancer (+4.7 years) and female thyroid cancer (+3.3). Smaller differences (<3 years) were present for female breast, female colon, lung, pancreas, prostate, and uterine corpus cancers (all P ≤ .001).
Conclusions:
Most differences between blacks and whites in the age at cancer diagnosis are small. Large differences for a few cancer types may be driven by etiologic and subtype heterogeneity as well as disparities in access to care.
Racial disparities exist in cancer incidence and survival, some of which may be explained by differences in cancer risk factors, screening, and treatment (1–3). For example, in the United States, blacks have higher mortality than whites for most common cancers and cancer overall (3). Additionally, studies have reported younger ages at diagnosis for blacks compared with whites for several cancer types. For female breast cancer, blacks have been reported to be five to 10 years (4,5) or even over 20 years (6) younger on average at diagnosis. A younger age in blacks has also been reported for prostate (7), lung (8), colon (9), rectal (10), head and neck (11), uterine corpus (12), and various hematologic cancers (13,14). Changes in screening guidelines and other clinical practices, targeted specifically to blacks, have been suggested partially on the basis of these apparent age differences (5,6,9,15).
Reports of a younger age at diagnosis in blacks are typically based on comparisons of the mean or median age calculated among observed cancer cases, without consideration of the underlying populations from which cancer cases arise. Some have noted that these case-only comparisons may be biased, because the underlying population age distributions are different for blacks and whites (7,9,14,16–18). In the United States, there are proportionally fewer blacks than whites in older age groups (eg, 19.5% of whites are age ≥60 years old compared with 12.4% of blacks [19]) and cancer risk is greatest at older ages. Therefore, cancer cases that occur in blacks are inherently more likely to arise among younger age groups. A similar bias has been noted in other populations with different age distributions (20,21).
In this study, we sought to assess whether there are racial differences in the age at cancer diagnosis after appropriately accounting for differences in population age structure between US blacks and whites. We hypothesized that correction for population differences might demonstrate that reports of a younger age in blacks are overstated for many cancers, and also potentially reveal true age differences that have previously been obscured.
Methods
Data Source
We obtained cancer incidence data from 18 registries in the Surveillance, Epidemiology, and End Results (SEER) program and restricted to invasive cancers occurring among non-Hispanic whites and blacks in 2010. In our analysis, we included cancer types (or groups of types), as defined by the World Health Organization 2008 SEER site recode (22), for which at least 100 cases occurred among each of whites and blacks in 2010 (see Table 1 for list). We obtained case counts for each cancer type and midyear population estimates, stratified by race (white/black), age (single years [0–84] and ≥85 years), and sex. We excluded the 85-years-and-older age group, where single years of age are not available for population estimates.
Table 1.
Ages at diagnosis for blacks compared with whites in 18 US regions, 2010
| Cancer type* | Cases, No. | Adjusted mean age, y† | Differences in mean ages, blacks – whites, y | P difference in adjusted means‡ | |||
|---|---|---|---|---|---|---|---|
| Whites | Blacks | Whites | Blacks | Crude | Adjusted | ||
| Oral cavity and pharynx | 6797 | 855 | 61.2 | 60.7 | −3.2 | −0.6 | .12 |
| Esophagus | |||||||
| Females | 488 | 114 | 68.0 | 65.0 | −5.1 | −3.0 | .01 |
| Males | 2102 | 278 | 65.4 | 65.2 | −2.4 | −0.3 | .68 |
| Stomach | 3071 | 760 | 66.0 | 66.2 | −2.6 | +0.2 | .81 |
| Small intestine | 1265 | 289 | 63.2 | 64.8 | −1.4 | +1.6 | .05 |
| Colon | |||||||
| Females | 7213 | 1558 | 67.0 | 65.2 | −4.6 | −1.9 | <.001§ |
| Males | 7752 | 1425 | 65.7 | 65.6 | −2.9 | −0.1 | .42 |
| Rectum | 6590 | 1096 | 62.0 | 62.4 | −2.4 | +0.3 | .59 |
| Anus | |||||||
| Females | 731 | 74 | 60.8 | 61.0 | −2.9 | +0.2 | .92 |
| Males | 401 | 88 | 59.4 | 53.9 | −8.5 | −5.5 | .001§ |
| Liver | 3116 | 819 | 63.0 | 62.0 | −2.8 | −1.0 | .002 |
| Gallbladder | 458 | 120 | 69.0 | 65.9 | −5.4 | −3.1 | .007 |
| Pancreas | 6318 | 1183 | 67.6 | 66.2 | −3.7 | −1.4 | <.001§ |
| Larynx | 2054 | 451 | 63.9 | 63.9 | −2.2 | 0.0 | .93 |
| Lung | 34 773 | 5159 | 68.2 | 66.9 | −3.4 | −1.3 | <.001§ |
| Soft tissue | |||||||
| Females | 734 | 161 | 53.7 | 53.5 | −6.2 | −0.3 | .52 |
| Males | 989 | 153 | 56.6 | 51.0 | −12.5 | −5.6 | <.001§ |
| Breast (female) | 38 301 | 5815 | 61.1 | 60.3 | −3.7 | −0.8 | <.001§ |
| Cervix | 1728 | 454 | 49.7 | 54.4 | +1.3 | +4.7 | <.001§ |
| Uterine corpus | 8046 | 1054 | 61.9 | 63.8 | −0.4 | +1.8 | <.001§ |
| Ovary | 3656 | 432 | 61.4 | 61.0 | −3.9 | −0.4 | .66 |
| Prostate | 37 061 | 7943 | 65.7 | 64.5 | −2.8 | −1.2 | <.001§ |
| Bladder | 12 382 | 884 | 68.8 | 69.1 | −2.1 | +0.3 | .38 |
| Kidney | 8622 | 1530 | 62.1 | 62.7 | −2.5 | +0.6 | .27 |
| Brain | 3590 | 335 | 53.0 | 50.8 | −10.6 | −2.2 | .37 |
| Thyroid | |||||||
| Females | 5630 | 621 | 49.2 | 52.4 | 0.0 | +3.3 | <.001§ |
| Males | 1989 | 138 | 53.5 | 54.0 | −3.2 | +0.5 | .80 |
| Hodgkin’s lymphoma | 1416 | 272 | 42.5 | 41.6 | −5.2 | −0.9 | .89 |
| Non-Hodgkin’s lymphoma | 10 940 | 1250 | 63.3 | 59.6 | −8.0 | −3.7 | <.001§ |
| Myeloma | 3040 | 923 | 67.0 | 66.1 | −3.2 | −0.8 | .02 |
| Chronic lymphocytic leukemia | 2508 | 190 | 67.8 | 68.1 | −1.9 | +0.3 | .70 |
| Acute myeloid leukemia | 2101 | 255 | 61.7 | 61.1 | −6.4 | −0.6 | .44 |
| Chronic myeloid leukemia | 832 | 133 | 60.3 | 57.8 | −7.6 | −2.5 | .07 |
| Kaposi sarcoma | 162 | 100 | 51.7 | 41.5 | −13.3 | −10.2 | <.001§ |
* Analyses are stratified by sex for cancers where the adjusted difference in mean age at diagnosis between blacks and whites was statistically significantly different between males and females. Rectum includes rectosigmoid junction, anus includes anal canal and anorectum, and kidney includes renal pelvis.
† Adjusted means use statistical weights to account for differences between blacks and whites in the population distribution of age and sex.
‡ Two-sided P difference in adjusted means is derived from the race coefficient in a weighted linear regression model fit to either transformed or untransformed values of the age at diagnosis. The transformations used for individual cancers, along with crude mean ages separately for blacks and whites, are listed in Supplementary Table 1 (available online).
§ P value was statistically significant after a Bonferroni correction for multiple comparisons.
In a sensitivity analysis, we excluded Kaposi sarcoma (KS) and non-Hodgkin’s lymphoma (NHL) cases that occurred in individuals infected with human immunodeficiency virus (HIV). HIV infection status (ie, “HIV flag”) is recorded by SEER registries at the time of diagnosis for KS and all lymphomas and is also captured by cause of death. Those with missing values for the HIV flag were assumed to be HIV-negative (23). This analysis excluded data from Iowa, which does not collect an HIV flag.
Statistical Analysis
We calculated the crude mean age at diagnosis among blacks and whites for each cancer type. To examine the influence of differences in population age structure, we also calculated a weighted mean age. The weighted (termed “adjusted,” ie, age- and sex-adjusted) means accounted for the underlying population structures using statistical weights. We calculated these weights for blacks and whites in each stratum defined by single year of age i and sex j as (Pblack,i,j +Pwhite,i,j)/Pblack,i,j and (Pblack,i,j +Pwhite,i,j)/Pwhite,i,j, respectively, where P is the population size in that stratum. As such, the adjusted means represent what the mean ages at diagnosis would be if blacks and whites had the same population distribution of age and sex. We calculated age differences by subtracting the mean age at diagnosis among whites from the age among blacks for both crude and adjusted estimates. Therefore, negative differences indicate younger ages in blacks, while positive differences indicate older ages in blacks.
To test for statistical significance of adjusted mean differences, we used weighted linear regression with age as the outcome and race as a coefficient. For most cancer types, we transformed age values to improve normality of the distribution of residuals from the model, thus increasing the accuracy of the resulting race coefficient P values. These transformations included square, cube, and square root transformations (see Supplementary Table 1, available online, for details by cancer type). We did not test for statistical significance of crude mean differences.
For each cancer type, to determine whether age comparisons should be stratified by sex, we tested whether the adjusted mean age difference between blacks and whites differed between males and females. We fit a weighted linear regression model with age as the outcome that included race, sex, and an interaction between race and sex (age values were transformed as described above). For cancer types with P interaction values less than .10, we conducted sex-stratified analyses.
We conducted three sensitivity analyses. First, we repeated the main analysis including the 85-years-and-older age group (coded as age 85 years). Second, for KS and NHL, risk is strongly increased in people infected with HIV (24), and HIV-infected cases measurably impact general population rates (25). Therefore, for NHL and KS, we repeated the analysis after excluding HIV-infected cancer cases. Finally, to assess the sensitivity of our results to the normality assumption required for our P values, we calculated P values for each cancer type with a statistically significant adjusted difference using three possible transformations (square, cube, square root) and no transformation.
We applied a Bonferroni correction based on 34 comparisons to a type 1 error level of α = 0.05 to assess statistical significance of adjusted mean differences. For cancer types with statistically significant differences, we examined 2010 age-specific incidence rates separately for whites and blacks, with emphasis on cancers with differences of three or more years. We quantified differences in age-specific incidence rates by calculating incidence rate ratios (IRRs) comparing blacks with whites, at younger than 60 years and 60 years and older, using Poisson regression. Analyses were done in SAS version 9.3 and Stata version 13.1, and all P values are two-sided.
Results
Comparison of the Mean Age at Cancer Diagnosis between Whites and Blacks
Among non-Hispanic blacks and whites contributing data to SEER-18 in 2010, the population age distribution was older for whites than blacks (population aged ≤84 years) (Figure 1). Individuals older than age 50 years made up 23.2% and 34.7% of the population for blacks and whites, respectively, and individuals older than age 70 years made up 4.2% and 8.1%, respectively. The mean age among blacks was 33 years, compared with 39 years for whites.
Figure 1.

Population age distributions for blacks and whites age 84 years or younger in 18 regions of the United States, 2010.
We included 29 cancer types in our analysis (Table 1). A statistically significant (P < .10) interaction between sex and race was present for esophageal, colon, anal, soft tissue, and thyroid cancers (data not shown). Analyses for these cancers were therefore stratified by sex.
The crude mean age at cancer diagnosis was younger in blacks compared with whites for nearly every cancer type examined (32 of 34 comparisons) (Supplementary Table 1, available online). The differences in crude means ranged from -13.3 years for KS (ie, 13.3 years younger in blacks) to +1.3 years for cervical cancer (ie, 1.3 years older in blacks) (Figure 2A).
Figure 2.
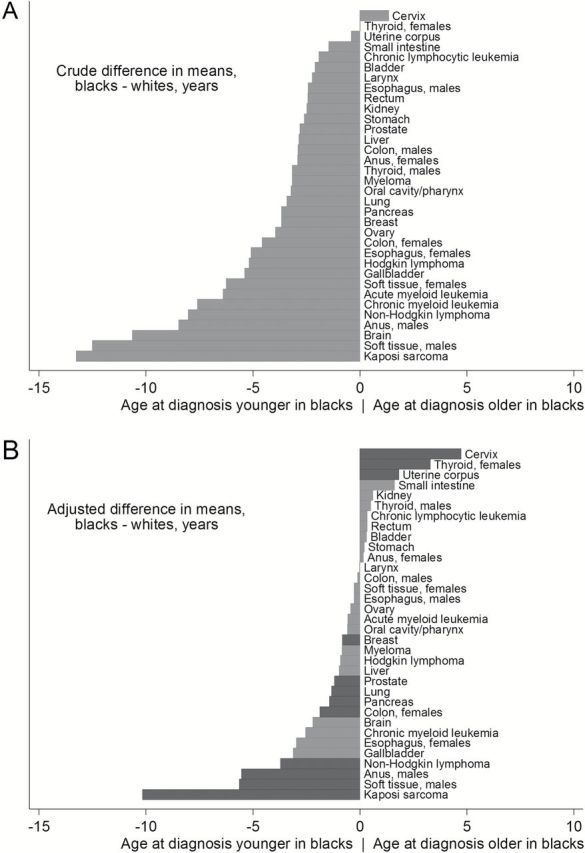
Crude (A) and adjusted (B) differences in the mean age at cancer diagnosis between blacks and whites in 18 US regions, 2010. Crude mean differences were calculated among observed cancer cases, without adjustment for underlying population structure. Adjusted means use statistical weights to account for differences between blacks and whites in the population distribution of age and sex. Analyses are stratified by sex for cancers where the adjusted difference in mean age at diagnosis between blacks and whites was statistically significantly different between males and females. Dark bars indicate statistical significance of adjusted differences, based on a Bonferroni correction applied to P values derived from weighted linear regression models. We did not test for statistical significance of crude differences. Rectum includes rectosigmoid junction, anus includes anal canal and anorectum, and kidney includes renal pelvis.
After adjusting for differences in population structure between blacks and whites, the apparently younger mean age for blacks was greatly diminished for most cancers, and for a few cancers adjustment for population structure revealed older ages in blacks that were previously masked (Figure 2A-B). Adjusted mean differences ranged from -10.2 years (KS) to +4.7 years (cervical cancer) (Table 1).
After a Bonferroni correction, there was a statistically significant adjusted mean difference between blacks and whites for 12 cancer types. Blacks were statistically significantly younger than whites at diagnosis for KS (-10.2 years), NHL (-3.7), pancreatic cancer (-1.4), and lung cancer (-1.3) in both sexes combined, for soft tissue (-5.6), anal (-5.5), and prostate (-1.2) cancers in males, and for colon (-1.9) and breast (-0.8) cancers in females. Blacks were statistically significantly older than whites for cervical (+4.7), thyroid (+3.3), and uterine corpus (+1.8) cancers in females (all P ≤ .001) (Table 1).
Sensitivity Analyses
After including individuals age 85 years and older, the final group of cancer types with statistically significant adjusted differences remained exactly the same (data not shown). Adjusted mean differences were more than one year larger for KS (change from -10.2 to -11.9 years) and cervical cancer (change from +4.7 to +6.2 years).
For NHL, exclusion of HIV-infected cases did not substantially alter the adjusted difference (HIV excluded: -2.5 years, P < .001 vs overall: -3.7 years, P < .001) (Supplementary Table 2, available online). However, for KS, the adjusted difference was smaller and no longer statistically significant (HIV excluded: -4.9 years, P = .38 vs overall: -10.2 years, P < .001).
After application of three possible transformations and no transformation for the 12 cancers with statistically significant adjusted differences, three scenarios no longer reached Bonferroni-corrected statistical significance (male anal cancer with cube transformation and male soft tissue cancer with a square root or no transformation [data not shown]).
Age-Specific Incidence Rates
Age-specific incidence rates for cancers with statistically significant adjusted differences of three or more years are shown in Figure 3 (for the remaining cancers with smaller statistically significant differences, see Supplementary Figure 1, available online). For KS and male anal cancer, incidence was higher in blacks at younger ages (mainly age 20–59 years), but similar at older ages (Figure 3, A and C). For male anal cancer, IRRs comparing incidence in blacks with whites were 1.47 among men younger than 60 years and 0.81 among men age 60 years and older. For KS, IRRs were 3.58 and 1.13, respectively.
Figure 3.
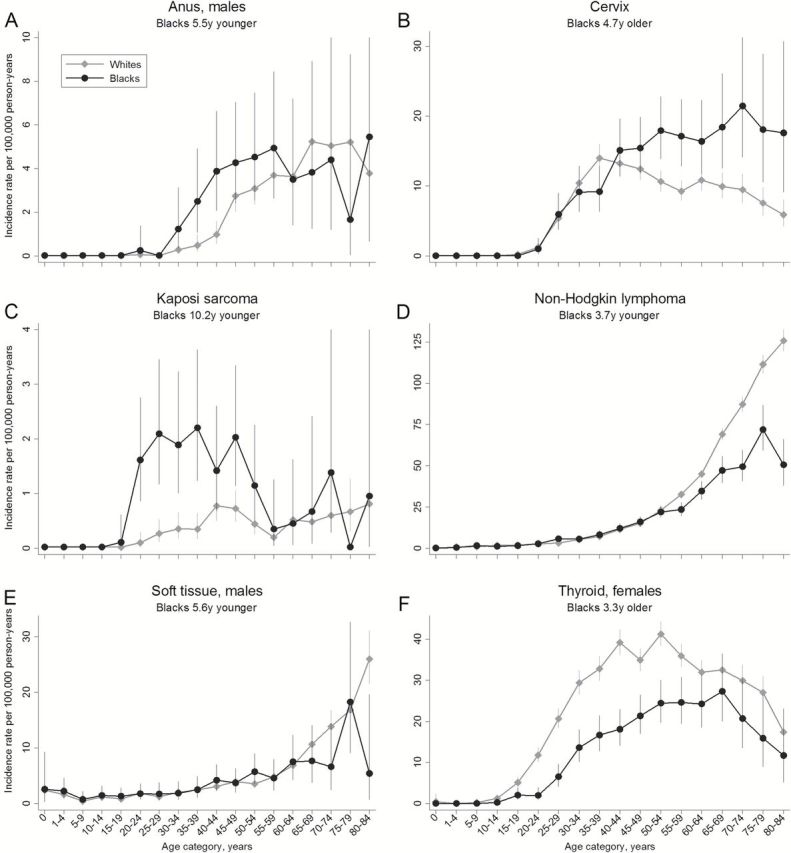
Age-specific cancer incidence rates for cancers with statistically significant adjusted differences of at least three years between blacks and whites in the mean age at cancer diagnosis in 18 US regions, 2010. Error bars represent 95% exact confidence intervals. A) Male anal cancer; B) cervical cancer; C) Kaposi sarcoma; D) non-Hodgkin’s lymphoma; E) male soft tissue cancer; F) female thyroid cancer.
For NHL and male soft tissue cancer, incidence was lower at older ages in blacks (IRRs among individuals age 60 years and older 0.60 and 0.69, respectively) (Figure 3, D-E), but more similar at younger ages (IRRs among individuals younger than 60 years 0.78 and 1.06, respectively). Cervical cancer showed the reverse pattern, with higher incidence in blacks at older ages (IRR = 1.96 among women age 60 years and older) (Figure 3B) and similar incidence at younger ages (IRR = 1.04 among women younger than 60 years). Finally, thyroid cancer incidence in women was lower among blacks across all ages, but particularly at younger ages (IRR = 0.45 for women younger than 60 years compared with 0.76 for women age 60 years and older) (Figure 3F).
Discussion
In a population-based study of US cancer cases, we did not observe large differences between blacks and whites in the age at diagnosis for most cancer types, but showed instead that differences in population age structure strongly influence these comparisons. After correctly accounting for population structure, we identified that blacks are much younger at diagnosis for only a few cancers, notably KS, male anal and soft tissue cancers, and NHL. Blacks are slightly younger for female breast, female colon, lung, pancreas, and prostate cancers. We also uncovered that blacks are older than whites at diagnosis for cervical, uterine corpus, and female thyroid cancers.
Previous reports of widespread and larger age-at-cancer-diagnosis differences between blacks and whites (4–14) compared cases only and were strongly influenced by failure to account for the populations at risk. Such comparisons can identify false differences and also conceal true differences. For example, blacks have been reported to develop uterine corpus tumors at younger ages than whites (12), but we found a small difference in the reverse direction. It is possible that population differences have also influenced reports that blacks are younger at diagnosis for diseases other than cancer, such as type II diabetes (26), cystic fibrosis (27), severe asthma (28), and pediatric systemic lupus erythematosus (29).
True racial differences in the age at cancer diagnosis, remaining after appropriate corrections, have several potential causes. One is etiologic heterogeneity, in which the important cause or causes of cancer differ across groups and also cause cancer at different ages. For cancers with several subtypes that have different etiologies, this may produce racial differences in the distribution of subtypes. Second, one group may be exposed earlier or more intensely to important risk factors, such as tobacco smoking. Finally, age differences can arise from differences in the timing, prevalence, and frequency of early cancer detection, whether through screening or as incidental findings, or from differences in follow-up after a positive screening test. Though we cannot definitively identify the cause of age-at-diagnosis differences for most cancers, we can suggest potential explanations for some of the larger differences we observed.
Younger ages at diagnosis in blacks for KS and male anal cancer may result from etiologic heterogeneity in which HIV infection causes a larger proportion of cases in blacks. These two cancers are rare in the US general population but strongly increased among HIV-infected people; as a result, approximately 71% of KS and 28% of male anal cancer cases occur in HIV-infected people (25,30). These high proportions, coupled with the young age of the HIV population (21) and approximately seven-fold higher HIV prevalence in blacks than whites (31), produced higher incidence in blacks at younger ages. For KS, we demonstrated the influence of HIV directly by excluding cases with known HIV infection, which eliminated the statistically significant age difference. SEER does not collect HIV status for anal cancer cases; however, HIV disproportionately impacts anal cancer among young black men, with an HIV prevalence of approximately 84% vs 51% among black and white men age 20 to 49 years who have anal cancer, respectively (30).
Age differences in NHL and male soft tissue cancer may relate to etiologic heterogeneity across histologic subtypes. For NHL, the younger age in blacks was driven by 1.7-fold higher incidence in whites among older ages. NHL has many subtypes across which the typical age at onset and key environmental and genetic risk factors differ (32,33). Therefore, racial differences in exposure and/or susceptibility to different risk factors may produce racial differences in incidence across subtypes (32), which in turn lead to age-at-diagnosis differences. Though NHL is also an HIV-related cancer, HIV prevalence in US NHL cases is modest (6%) (23), and the 3.7-year age difference was not strongly affected by removal of HIV-infected cases. Of note, however, residual age differences for NHL and KS could be affected by imperfect sensitivity of the HIV flag (ie, by HIV-infected cases classified as uninfected) (23,34). The cause of the 5.6-year age difference for male soft tissue cancer is unclear, but this cancer also comprises many subtypes with differential incidence by race (35). For these and other heterogeneous cancer types, subtype-specific analyses may be warranted, because individual subtypes may show age-at-diagnosis or other racial differences that are not apparent when subtypes are combined. For breast cancer, for example, the relationship between age-specific incidence curves for blacks and whites varies by tumor size, grade, lymph node status, and estrogen receptor status (36).
Racial differences in early detection of cancer in the United States (1) may have influenced the observed age differences for cervical and female thyroid cancers. For cervical cancer, which is preventable by screening, increased incidence among older black women is consistent with lower rates of follow-up after screening and treatment of precancerous lesions (37). For female thyroid cancer, incidence rates are higher in whites across all age groups, but the difference is larger at younger ages. Increasing thyroid cancer incidence over time is believed to be partly because of enhanced detection (38). Thus, the pattern we observed may be consistent with more use of sensitive diagnostic technology among whites compared with blacks, particularly at younger ages.
In general, our findings illustrate that adjustment for population structure is necessary when comparing the age at cancer diagnosis between groups with different population age distributions. However, some patterns cannot be captured by age-at-diagnosis comparisons and instead require examination of age-specific incidence rates. For example, multiple myeloma incidence has been reported to be three-fold higher in blacks compared with whites among people younger than 50 years and two-fold higher among people 70 years and older (14). While the 0.8-year younger age among blacks in our study (P = .02) reflects the shift in IRR across age groups, it does not reflect the strongly elevated risks in blacks across ages (ie, the overall magnitude of the IRR). Another example is the “crossover” pattern for breast cancer in which incidence is higher in blacks at younger ages but higher in whites at older ages (36). The small age-at-diagnosis difference we detected for breast cancer is consistent with but cannot capture this pattern.
Our study used a straightforward approach to correct for the bias resulting from differences in population age structure between blacks and whites and analyzed data from the large and representative SEER program. One limitation may be residual population structure differences within the one-year age strata used in our analysis, which would affect our adjusted ages. Therefore, caution should be used when interpreting small differences (eg, less than one year). Additionally, our P values relied on a normality assumption, though our results were largely robust to different transformations of age values. Finally, our study included non-Hispanic blacks and whites and is not generalizable to other racial/ethnic groups.
Our age-at-diagnosis comparison examines a single facet of racial differences in cancer, and our results should not be interpreted to contradict well-documented racial disparities in cancer incidence and survival. For example, our approach does not highlight cancers where the incidence is strongly and uniformly increased in blacks compared with whites across age groups. Further, striking differences in cancer survival represent a troubling aspect of racial disparities in the United States (1–3). These disparities result from the influence of a variety of social, economic, and cultural factors that affect the spectrum of cancer from prevention, early detection, and diagnosis to treatment and mortality (1).
In conclusion, most differences between blacks and whites in the age at cancer diagnosis are small, and case-only comparisons have been strongly influenced by differences in population age structure. We found age differences for several cancers that may be driven by etiologic and subtype heterogeneity as well as disparities in access to medical care. Racial differences in HIV prevalence, exposure to other cancer risk factors, and early detection of cancer have influenced cancer incidence across racial groups, demonstrating potential opportunities for improvement in cancer prevention.
Funding
This research was supported by the Intramural Research Program of the National Cancer Institute at the National Institutes of Health .
Supplementary Material
The sponsor reviewed and approved final submission but did not have a role in design and conduct of the study, the collection, management, analysis, or interpretation of the data, the preparation of the manuscript, nor the decision to submit for publication.
References
- 1. Ward E, Jemal A, Cokkinides V, et al. Cancer disparities by race/ethnicity and socioeconomic status. CA Cancer J Clin. 2004;54(2):78–93. [DOI] [PubMed] [Google Scholar]
- 2. Howlader N, Noone AM, Krapcho M, et al. SEER Cancer Statistics Review, 1975–2010, National Cancer Institute; Bethesda, MD: http://seer.cancer.gov/csr/1975_2010/ Accessed April 1, 2013. [Google Scholar]
- 3. American Cancer Society. Cancer Facts & Figures for African Americans 2013–2014. 2013. Atlanta, American Cancer Society. [Google Scholar]
- 4. Joslyn SA, West MM. Racial differences in breast carcinoma survival. Cancer. 2000;88(1):114–123. [DOI] [PubMed] [Google Scholar]
- 5. El-Tamer MB, Wait RB. Age at presentation of African-American and Caucasian breast cancer patients. J Am Coll Surg. 1999;188(3):237–240. [DOI] [PubMed] [Google Scholar]
- 6. Bowen RL, Duffy SW, Ryan DA, Hart IR, Jones JL. Early onset of breast cancer in a group of British black women. Br J Cancer. 2008;98(2):277–281. [DOI] [PMC free article] [PubMed] [Google Scholar]
- 7. Metcalfe C, Evans S, Ibrahim F, et al. Pathways to diagnosis for Black men and White men found to have prostate cancer: the PROCESS cohort study. Br J Cancer. 2008;99(7):1040–1045. [DOI] [PMC free article] [PubMed] [Google Scholar]
- 8. Yang R, Cheung MC, Byrne MM, et al. Do racial or socioeconomic disparities exist in lung cancer treatment? Cancer. 2010;116(10):2437–2447. [DOI] [PubMed] [Google Scholar]
- 9. Theuer CP, Wagner JL, Taylor TH, et al. Racial and ethnic colorectal cancer patterns affect the cost-effectiveness of colorectal cancer screening in the United States. Gastroenterology. 2001;120(4):848–856. [DOI] [PubMed] [Google Scholar]
- 10. Morris AM, Billingsley KG, Baxter NN, Baldwin LM. Racial disparities in rectal cancer treatment: a population-based analysis. Arch Surg. 2004;139(2):151–155. [DOI] [PubMed] [Google Scholar]
- 11. Molina MA, Cheung MC, Perez EA, et al. African American and poor patients have a dramatically worse prognosis for head and neck cancer: an examination of 20,915 patients. Cancer. 2008;113(10):2797–2806. [DOI] [PubMed] [Google Scholar]
- 12. Wright JD, Fiorelli J, Schiff PB, et al. Racial disparities for uterine corpus tumors: changes in clinical characteristics and treatment over time. Cancer. 2009;115(6):1276–1285. [DOI] [PubMed] [Google Scholar]
- 13. Shenoy PJ, Malik N, Nooka A, et al. Racial differences in the presentation and outcomes of diffuse large B-cell lymphoma in the United States. Cancer. 2011;117(11):2530–2540. [DOI] [PubMed] [Google Scholar]
- 14. Waxman AJ, Mink PJ, Devesa SS, et al. Racial disparities in incidence and outcome in multiple myeloma: a population-based study. Blood. 2010;116(25):5501–5506. [DOI] [PMC free article] [PubMed] [Google Scholar]
- 15. Agrawal S, Bhupinderjit A, Bhutani MS, et al. Colorectal cancer in African Americans. Am J Gastroenterol. 2005;100(3):515–523. [DOI] [PubMed] [Google Scholar]
- 16. Ingleby JD. Early onset of breast cancer in Black British women: how reliable are the findings? Br J Cancer. 2008;99(6):986–987. [DOI] [PMC free article] [PubMed] [Google Scholar]
- 17. Cichowska A, Fischbacher CM, Brock A, et al. Early onset of breast cancer in British Black women. Br J Cancer. 2008;98(12):2011. [DOI] [PMC free article] [PubMed] [Google Scholar]
- 18. Karami S, Young HA, Henson DE. Earlier age at diagnosis: another dimension in cancer disparity? Cancer Detect Prev. 2007;31(1):29–34. [DOI] [PubMed] [Google Scholar]
- 19. U.S. Census Bureau. Annual Estimates of the Resident Population by Race, Hispanic Origin, Sex and Age for the United States: April 1, 2000 to July 1, 2009 (NC-EST2009-04). http://www.census.gov/popest/national/asrh/NC-EST2009-asrh.html Accessed 2014.
- 20. Picco MF, Goodman S, Reed J, Bayless TM. Methodologic pitfalls in the determination of genetic anticipation: the case of Crohn disease. Ann Intern Med. 2001;134(12):1124–1129. [DOI] [PubMed] [Google Scholar]
- 21. Shiels MS, Pfeiffer RM, Engels EA. Age at cancer diagnosis among persons with AIDS in the United States. Ann Intern Med. 2010;153(7):452–460. [DOI] [PMC free article] [PubMed] [Google Scholar]
- 22. Surveillance Research Program of the National Cancer Institute. Site Recode ICD-O-3/WHO 2008 Definition. Accessible at http://seer.cancer.gov/siterecode/icdo3_dwhoheme/index.html Accessed 2014.
- 23. Shiels MS, Engels EA, Linet M, et al. The epidemic of non-Hodgkin lymphoma in the United States: disentangling the effect of HIV, 1992–2009. Cancer Epidemiol Biomarkers Prev. 2013;22(6):1069–1078. [DOI] [PMC free article] [PubMed] [Google Scholar]
- 24. Engels EA, Biggar RJ, Hall HI, et al. Cancer risk in people infected with human immunodeficiency virus in the United States. Int J Cancer. 2008;123(1):187–194. [DOI] [PubMed] [Google Scholar]
- 25. Shiels MS, Pfeiffer RM, Hall HI, et al. Proportions of Kaposi sarcoma, selected non-Hodgkin lymphomas, and cervical cancer in the United States occurring in persons with AIDS, 1980–2007. JAMA. 2011;305(14):1450–1459. [DOI] [PMC free article] [PubMed] [Google Scholar]
- 26. Koopman RJ, Mainous AG, III, Diaz VA, Geesey ME. Changes in age at diagnosis of type 2 diabetes mellitus in the United States, 1988 to 2000. Ann Fam Med. 2005;3(1):60–63. [DOI] [PMC free article] [PubMed] [Google Scholar]
- 27. Hamosh A, FitzSimmons SC, Macek M, Jr, et al. Comparison of the clinical manifestations of cystic fibrosis in black and white patients. J Pediatr. 1998;132(2):255–259. [DOI] [PubMed] [Google Scholar]
- 28. Gamble C, Talbott E, Youk A, et al. Racial differences in biologic predictors of severe asthma: Data from the Severe Asthma Research Program. J Allergy Clin Immunol. 2010;126(6):1149–1156. [DOI] [PMC free article] [PubMed] [Google Scholar]
- 29. Hiraki LT, Benseler SM, Tyrrell PN, et al. Ethnic differences in pediatric systemic lupus erythematosus. J Rheumatol. 2009;36(11):2539–2546. [DOI] [PubMed] [Google Scholar]
- 30. Shiels MS, Pfeiffer RM, Chaturvedi AK, Kreimer AR, Engels EA. Impact of the HIV epidemic on the incidence rates of anal cancer in the United States. J Natl Cancer Inst. 2012;104(20):1591–1598. [DOI] [PMC free article] [PubMed] [Google Scholar]
- 31. Centers for Disease Control and Prevention. HIV Surveillance Report Vol. 23. Diagnoses of HIV infection in the United States and Dependent Areas, 2011. Accessed February 28, 2013.
- 32. Morton LM, Wang SS, Devesa SS, et al. Lymphoma incidence patterns by WHO subtype in the United States, 1992–2001. Blood. 2006;107(1):265–276. [DOI] [PMC free article] [PubMed] [Google Scholar]
- 33. Morton LM, Wang SS, Cozen W, et al. Etiologic heterogeneity among non-Hodgkin lymphoma subtypes. Blood. 2008;112(13):5150–5160. [DOI] [PMC free article] [PubMed] [Google Scholar]
- 34. Clarke CA, Glaser SL. Population-based surveillance of HIV-associated cancers: utility of cancer registry data. J Acquir Immune Defic Syndr. 2004;36(5):1083–1091. [DOI] [PubMed] [Google Scholar]
- 35. Rouhani P, Fletcher CD, Devesa SS, Toro JR. Cutaneous soft tissue sarcoma incidence patterns in the U.S.: an analysis of 12,114 cases. Cancer. 2008;113(3):616–627. [DOI] [PubMed] [Google Scholar]
- 36. Anderson WF, Rosenberg PS, Menashe I, Mitani A, Pfeiffer RM. Age-related crossover in breast cancer incidence rates between black and white ethnic groups. J Natl Cancer Inst. 2008;100(24):1804–1814. [DOI] [PMC free article] [PubMed] [Google Scholar]
- 37. Simard EP, Naishadham D, Saslow D, Jemal A. Age-specific trends in black-white disparities in cervical cancer incidence in the United States: 1975–2009. Gynecol Oncol. 2012;127(3):611–615. [DOI] [PubMed] [Google Scholar]
- 38. Li N, Du XL, Reitzel LR, Xu L, Sturgis EM. Impact of enhanced detection on the increase in thyroid cancer incidence in the United States: review of incidence trends by socioeconomic status within the Surveillance, Epidemiology, and End Results registry, 1980–2008. Thyroid. 2013;23(1):103–110. [DOI] [PMC free article] [PubMed] [Google Scholar]
Associated Data
This section collects any data citations, data availability statements, or supplementary materials included in this article.