

Abstract
Importance
Previous studies of the implications of age-related macular degeneration (AMD) severity in one eye on prognosis for the fellow eye have focused on incidence of neovascular AMD in the fellow eye of subjects with neovascular AMD in the other eye. It is unclear to what extent AMD severity in one eye impacts incidence, progression, and regression of AMD in its fellow eye across the entire range of AMD severity.
Objective
To investigate the impact of severity of AMD in one eye on incidence, progression, and regression of AMD in the fellow eye.
Design, Setting and Participants
The Beaver Dam Eye Study, a longitudinal population-based study of age-related eye diseases conducted in the city and township of Beaver Dam, Wisconsin. Examinations were performed every 5 years over a 20-year period (1988-1990 through 2008-2010). Study participants (N=4379) were aged 43 to 86 years at the baseline examination. At baseline and up to 4 subsequent examinations, retinal photographs were taken.
Exposures
Age, sex, and the Y402H polymorphism in the Complement Factor H gene on chromosome 1q; AMD severity in the fellow eye.
Main Outcome Measures
Incidence, progression, and regression of AMD assessed in retinal photographs according to the Wisconsin Age-Related Maculopathy Grading System; mortality.
Results
More severe AMD in one eye was associated with increased incidence and progression of AMD in its fellow eye (Level 1 to 2: hazard ratio [HR] 4.90, 95% confidence interval [CI] 4.26-5.63; Level 2 to 3: HR 2.09, CI 1.42-3.06; Level 3 to 4: HR 2.38, CI 1.74-3.25; Level 4 to Level 5: HR 2.46, CI 1.65-3.66). Less severe AMD in one eye was associated with less progression of AMD in its fellow eye (Level 2 to 3: HR 0.42, CI 0.33-0.55; Level 3 to 4: HR 0.50, CI 0.34-0.83). We estimate that 51% of subjects who develop any AMD always maintain AMD severity states within 1 step of each other between eyes; 90% stay within 2 steps.
Conclusions and Relevance
Using multi-state models, we show that AMD severity in one eye tracks AMD severity in its fellow eye.
Introduction
Age-related macular degeneration (AMD) is thought to be a symmetric disease in that its presence, incidence, and progression of lesions defining it are not significantly different between eyes, although one eye may precede the other.1,2 This results in asymmetry between eyes for both early and late AMD.3-5 Most studies that have examined the prognostic implications of risk based on knowing the severity of AMD in one eye have focused on using signs of neovascular AMD in that eye to estimate the risk of developing neovascular AMD in the fellow eye. These estimates have been made using data from clinical trials and cohort studies.2,6,7 Understanding of the course of AMD and the risk of early AMD progressing based on either the worse or better eye may help in determining how often patients who are at risk of progression of AMD should be seen. The purpose of this study is to investigate the impact of severity of AMD in one eye on incidence, progression, and regression of AMD in the fellow eye using multistate models (MSMs) in the Beaver Dam Eye Study (BDES).
Methods
Population
Methods used to identify the study population have been described previously.8-13 Characteristics of the population at each examination and reasons for nonparticipation appear elsewhere.9-13
Procedures and Definitions
Similar procedures were used at all examinations.2,14-18 Data were collected with Institutional Review Board approval from the University of Wisconsin-Madison, informed consent was obtained from each participant at each examination, and the study adhered to the tenets of the Declaration of Helsinki. Pertinent parts of the examination consisted of taking stereoscopic 30° color fundus photographs centered on the disc (Diabetic Retinopathy Study standard field 1) and macula (Diabetic Retinopathy Study standard field 2) and a nonstereoscopic color fundus photograph temporal to but including the fovea of each eye.
Grading procedures have been described previously.1,14,15 Information on gradability has been published elsewhere.2,15,16,19,20 In this study, AMD status in each eye was classified using a 5-step severity scale.21 Subjects were classified as to severity level based on the worse eye.
Information on alleles for the Y402H polymorphism for CFH was available for 4479 participants (91%). Distributions of other characteristics for these subjects did not differ from the rest of the population (data not shown).
Vital status was monitored by reading the obituaries in local newspapers and by making annual telephone contact. Persons not known to have died but who could not be contacted had their survival time entered as their last contact date.
Statistical Analysis
Incidence, progression, and regression of AMD and mortality were modeled using multi-state models (MSMs) in continuous time for panel data. Traditional survival analysis is a special case of an MSM in which (1) there are two possible states (alive or dead), (2) a single possible transition between states (alive to dead) and (3) the process is under continuous observation, i.e., if the subject is not lost to follow-up, the current state is always known (continuous observation). The MSM generalizes traditional survival analysis models to incorporate multiple disease states (AMD severity as well as death) and to accommodate panel data in which the state is only observed at a finite series of times (scheduled visits with fundus photographs).
We identified 26 mutually exclusive and exhaustive states representing the current status of each subject at a given age. Here, eyes were classified as being in 1 of the 5 levels on the BDES AMD severity scale:
No AMD (Level 1)
Hard drusen or small soft drusen (<125 μm in diameter) only, regardless of area of involvement, and no pigmentary abnormalities (defined as increased retinal pigment or RPE depigmentation).
Minimally severe early AMD (Level 2)
Hard drusen or small soft drusen (<125 μm in diameter), regardless of area of involvement, with any pigmentary abnormality or soft drusen (≥125 μm in diameter) with drusen area <196,350 μm2 (equivalent to a circle with a diameter of 500 μm) and no pigmentary abnormalities.
Moderately severe early AMD (Level 3)
Soft drusen (≥125 μm in diameter) with drusen area <196,350 μm2 (equivalent to a circle with a diameter of 500 μm) and with any pigmentary abnormality or soft drusen (≥125 μm in diameter) with drusen area ≥196,350 μm2 (equivalent to a circle with a diameter of 500 μm) with or without increased retinal pigment but no RPE depigmentation.
Severe early AMD (Level 4)
Soft drusen (≥125 μm in diameter) with drusen area ≥196,350 μm2 (equivalent to a circle with a diameter of 500 μm) and RPE depigmentation present, with or without increased retinal pigment.
Late AMD (Level 5)
Pure geographic atrophy in the absence of exudative macular degeneration or exudative macular degeneration with or without geographic atrophy present.
Subjects were classified as being in 1 of 25 AMD states (AMD severity in the right eye, AMD severity in the left eye) or dead. Figure 1 illustrates the underlying MSM at the subject level. For each eye, instantaneous transitions (the next state to which the individual moves and the time of the change) were allowed between adjacent AMD states with one exception, namely that regression from late AMD (Level 5) to severe early AMD (Level 4) was not allowed. We assumed that an eye could not instantaneously worsen (or improve) by multiple steps (e.g., one eye could not move from Level 1 to Level 3 without being in Level 2 for some length of time) and both eyes could not simultaneously worsen (or improve) at the same instant of time. These assumptions apply to the underlying continuously observed process.
Figure 1.
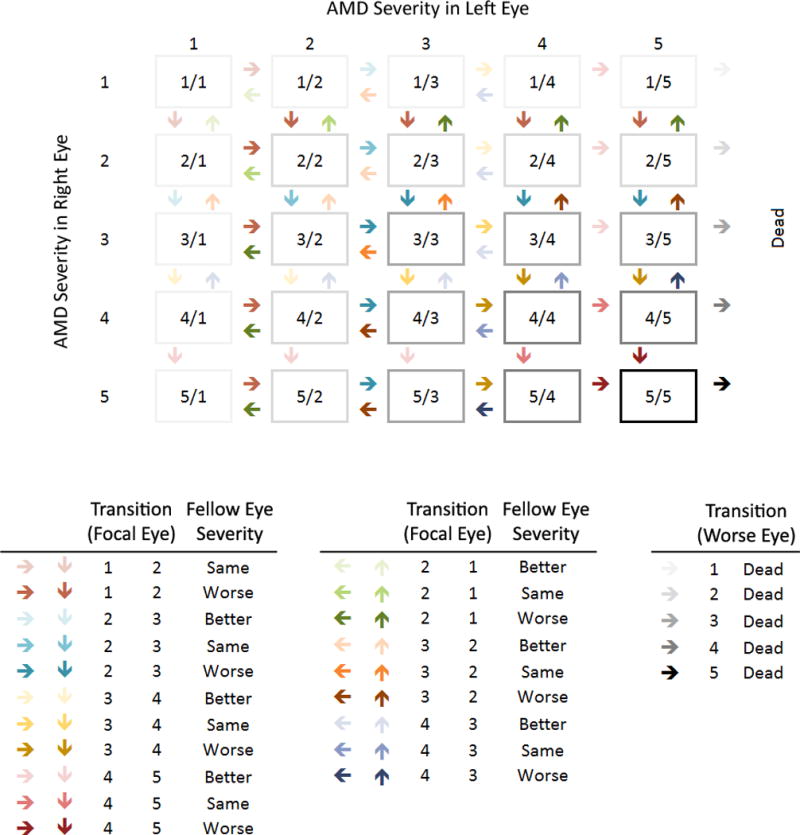
Transition diagram for age-related macular degeneration (AMD) severity and death. Arrows indicate possible instantaneous transitions between states. For AMD transitions, colors distinguish the 7 possible transitions in a single eye, while shades within a color distinguish the modifying effect of AMD severity in the fellow eye. Gray shades distinguish AMD severity in the better eye and its effect on the transition to death.
Transitions are governed by 25 intensities, one for each possible instantaneous transition between states (represented by arrows in Figure 1), which represent the hazard (instantaneous risk) of moving between states at the subject level. These intensities reflect 7 fundamental transitions between AMD states in a single eye modified by the AMD status of the fellow eye (20 total transitions) and the transition to death modified by the AMD state in the better eye (5 total transitions). Dependence of transition intensities on age, sex, CFH Y402H genotype and AMD severity in the fellow eye was specified using log-linear regression models. Age was entered as a linear term and updated annually. Sex and CFH Y402H genotype were entered using indicator variables. Covariate effects on transitions within the AMD scale were unconstrained. Covariate effects on transitions to death were constrained to be equal, i.e., independent of current AMD level in either eye. For transitions within the AMD scale, AMD severity in the fellow eye (categorized as worse, same, or better) was entered using indicator variables. For transitions to death, AMD severity in the better eye was included as a covariate.
The MSM incorporates all available information on the history of disease progression into likelihood calculations. Current AMD state is observed at intermittent study follow-up visits; transition times and numbers of intermediate transitions are unobserved. Death times are available, but AMD state at death is unknown. If subjects are alive at the end of follow-up, the final AMD state is unknown. At study visits, the exact AMD state may be unknown if photographs from one or both eyes were ungradable.
Analyses were conducted in R15 using the MSM package.14 Covariate effects on transition intensities are summarized as hazard ratios (HRs). We estimated 5-year transition probabilities to each AMD state (and death), adjusted to the sex and CFH Y402H genotype distribution at the first BDES visit, for specified subgroups based on age, current AMD severity, and AMD severity in the fellow eye.
Results
Of the 4973 subjects seen at any study visit, 494 were excluded for missing CFH Y402H genotype and an additional 100 were excluded for ungradable AMD status at all visits; 4379 subjects contributed data from 12,640 BDES follow-up intervals (up to 4 per subject). Table 1 displays characteristics of the cohort at the start of each interval by AMD level. Subjects with more severe AMD in the primary or fellow eye were older and more likely to be female, to have CFH Y402H genotype CT or CC, and to be seen at later visits.
Table 1.
Characteristics of the Cohort by Current Age-related Macular Degeneration Status (Primary Eye, Fellow Eye) at the Beginning of the Beaver Dam Eye Study Follow-up Intervals.
| AMD Severity, Primary Eye |
No AMD, Level 1 | Minimal Early AMD, Level 2 | Moderate Early AMD, Level 3 | Severe Early AMD, Level 4 | Late AMD, Level 5 | ||||||||
|---|---|---|---|---|---|---|---|---|---|---|---|---|---|
|
| |||||||||||||
| AMD Severity, Fellow Eye |
Same, Level 1 |
Worse, Level 2-5 |
Better, Level 1 |
Same, Level 2 |
Worse, Level 3-5 |
Better, Level 1-2 |
Same, Level 3 |
Worse, Level 4-5 |
Better, Level 1-3 |
Same, Level 4 |
Worse, Level 5 |
Better, Level 1-4 |
Same, Level 5 |
|
| |||||||||||||
| Characteristic | N=16948 | N=1671 | N=1296 | N=456 | N=273 | N=544 | N=578 | N=156 | N=185 | N=130 | N=68 | N=143 | N=256 |
|
|
|
||||||||||||
| Age, mean (SD) | 63 (10) | 68 (10) | 67 (10) | 71 (10) | 73 (10) | 71 (10) | 75 (9) | 77 (9) | 76 (9) | 77 (9) | 79 (8) | 78 (8) | 82 (7) |
|
|
|||||||||||||
| N (%) | N (%) | N (%) | N (%) | N (%) | N (%) | N (%) | N (%) | N (%) | N (%) | N (%) | N (%) | N (%) | |
|
|
|||||||||||||
| Male | 7288 (43) | 801 (48) | 626 (48) | 220 (48) | 119 (44) | 254 (47) | 206 (36) | 46 (29) | 57 (31) | 50 (38) | 28 (41) | 57 (40) | 78 (30) |
| Visit | |||||||||||||
| BDES 1 | 6302 (37) | 547 (33) | 442 (34) | 176 (39) | 79 (29) | 160 (29) | 174 (30) | 37 (24) | 37 (20) | 20 (15) | 12 (18) | 36 (25) | 66 (26) |
| BDES 2 | 4370 (26) | 486 (29) | 380 (29) | 128 (28) | 79 (29) | 161 (30) | 156 (27) | 46 (29) | 50 (27) | 28 (22) | 16 (24) | 36 (25) | 50 (20) |
| BDES 3 | 3448 (20) | 369 (22) | 274 (21) | 84 (18) | 61 (22) | 130 (24) | 134 (23) | 39 (25) | 50 (27) | 40 (31) | 22 (32) | 37 (26) | 56 (22) |
| BDES 4 | 2828 (17) | 269 (16) | 200 (15) | 68 (15) | 54 (20) | 93 (17) | 114 (20) | 34 (22) | 48 (26) | 42 (32) | 18 (26) | 34 (24) | 84 (33) |
| CFH Y402H genotype | |||||||||||||
| TT | 6964 (41) | 652 (39) | 508 (39) | 172 (38) | 106 (39) | 212 (39) | 150 (26) | 33 (21) | 54 (29) | 24 (18) | 9 (13) | 26 (18) | 24 (22) |
| CT | 7806 (46) | 811 (49) | 634 (49) | 218 (48) | 136 (50) | 258 (47) | 292 (51) | 88 (56) | 98 (53) | 80 (62) | 46 (68) | 91 (64) | 154 (60) |
| CC | 2178 (13) | 208 (12) | 154 (12) | 66 (14) | 31 (11) | 74 (14) | 136 (24) | 35 (22) | 33 (18) | 26 (20) | 13 (19) | 26 (18) | 78 (30) |
AMD, age-related macular degeneration; BDES, Beaver Dam Eye Study; CFH, complement factor H; N, number of eye follow-up intervals; SD, standard deviation.
Table 2 shows observed transitions between consecutive BDES visits. The first column presents transitions for the 16,948 BDES visits where subjects had no AMD (Level 1) in the primary eye and no AMD in the fellow eye. At the next BDES visit, 76% (n=12,849) of primary eyes were still free of AMD, 3% (n=465) progressed to minimally severe early AMD (Level 2), 1% (n=250) progressed to Level 3, 0.1% (n=18) progressed to Level 4, 0.1% (n=13) progressed to late AMD, and 12% (n=2,030) died. Four percent (n=725) were seen with no information, and 4% (n=598) were not seen.
Table 2.
Observed State Transitions During Consecutive Visit Intervals.
| AMD Severity, Beginning of Interval | |||||||||||||
|---|---|---|---|---|---|---|---|---|---|---|---|---|---|
|
| |||||||||||||
| Primary Eye | No AMD, Level 1 | Minimal Early AMD, Level 2 | Moderate Early AMD, Level 3 | Severe Early AMD, Level 4 | Late AMD, Level 5 | ||||||||
|
| |||||||||||||
| Fellow Eye | Same, Level 1 |
Worse, Level 2-5 |
Better, Level 1 |
Same, Level 2 |
Worse, Level 3-5 |
Better, Level 1-2 |
Same, Level 3 |
Worse, Level 4-5 |
Better, Level 1-3 |
Same, Level 4 |
Worse, Level 5 |
Better, Level 1-4 |
Same, Level 5 |
|
| |||||||||||||
| N=16948 | N=1671 | N=1296 | N=456 | N=273 | N=544 | N=578 | N=156 | N=185 | N=130 | N=68 | N=143 | N=256 | |
|
| |||||||||||||
| AMD Severity, End of Interval |
N (%) | N (%) | N (%) | N (%) | N (%) | N (%) | N (%) | N (%) | N (%) | N (%) | N (%) | N (%) | N (%) |
|
|
|
||||||||||||
| Level 1 | 12849 (76) | 961 (58) | 181 (14) | 23 (5) | 12 (4) | 12 (2) | 11 (2) | 0 (0) | 0 (0) | 0 (0) | 0 (0) | ||
| Level 2 | 465 (3) | 125 (7) | 620 (48) | 173 (38) | 64 (23) | 76 (14) | 34 (6) | 2 (1) | 9 (5) | 0 (0) | 1 (1) | ||
| Level 3 | 250 (1) | 120 (7) | 144 (11) | 87 (19) | 59 (22) | 211 (39) | 205 (35) | 36 (23) | 15 (8) | 1 (1) | 0 (0) | ||
| Level 4 | 18 (0) | 8 (0) | 25 (2) | 20 (4) | 18 (7) | 47 (9) | 101 (17) | 39 (25) | 57 (31) | 51 (39) | 10 (15) | ||
| Level 5 | 13 (0) | 10 (1) | 7 (1) | 5 (1) | 8 (3) | 17 (3) | 54 (9) | 21 (13) | 27 (15) | 34 (26) | 19 (28) | 78 (55) | 105 (41) |
| Seen, Ungradable | 725 (4) | 86 (5) | 51 (4) | 24 (5) | 85 (31) | 25 (5) | 25 (4) | 3 (2) | 10 (5) | 6 (5) | 3 (4) | 10 (7) | 23 (9) |
| Not Seen | 598 (4) | 60 (4) | 48 (4) | 10 (2) | 10 (4) | 20 (4) | 14 (2) | 6 (4) | 6 (3) | 4 (3) | 3 (4) | 5 (3) | 8 (3) |
| Dead | 2030 (12) | 301 (18) | 220 (17) | 114 (25) | 17 (6) | 136 (25) | 134 (23) | 49 (31) | 61 (33) | 34 (26) | 32 (47) | 50 (35) | 120 (47) |
AMD, age-related macular degeneration; N, number of subject follow-up intervals.
In a given eye, progression was more common and regression was less common if the severity in the fellow eye was worse (progression: 4% if same vs. 16% if worse for Level 1, 14% if better vs. 25% if same vs. 31% if worse for Level 2, 12% vs. 27% vs. 38% for Level 3, 15% vs. 26% vs. 28% for Level 4; regression: 14% vs. 5% vs. 4% for Level 2, 16% vs. 8% vs. 1% for Level 3, 13% if same vs. 1% if worse for Level 4). Few subjects were not seen at the next scheduled visit, and the proportion not seen did not vary with AMD severity.
Covariate effects on transition intensities
Covariate effects from the MSMs are presented in Table 3. There was no evidence of interactions between AMD severity in the fellow eye and age (P=0.18), sex (P=0.21) or CFH Y402H genotype (P=0.15).
Table 3.
Estimated Covariate Effects on Transition Intensities or Hazards.
| Incidence or Progression | Regression | Mortality | ||||||
|---|---|---|---|---|---|---|---|---|
|
|
||||||||
| Level 1 to Level 2 | Level 2 to Level 3 | Level 3 to Level 4 | Level 4 to Level 5 | Level 2 to Level 1 | Level 3 to Level 2 | Level 4 to Level 3 | Any AMD to Death | |
| Covariate | HR (95% CI) | HR (95% CI) | HR (95% CI) | HR (95% CI) | HR (95% CI) | HR (95% CI) | HR (95% CI) | HR (95% CI) |
|
|
|
|||||||
| Age (per 5 years) | 1.40 (1.35-1.45) | 1.28 (1.20-1.38) | 1.11 (1.04-1.19) | 1.22 (1.11-1.33) | 1.12 (1.05-1.20) | 1.17 (1.03-1.33) | 0.87 (0.69-1.10) | 1.67 (1.63-1.71) |
| Sex (male) | 0.89 (0.78-1.01) | 0.69 (0.55-0.87) | 0.79 (0.62-1.01) | 1.06 (0.79-1.42) | 0.80 (0.62-1.03) | 0.81 (0.54-1.21) | 0.33 (0.12-0.90) | 1.55 (1.42-1.68) |
| CFH Y402H genotype | ||||||||
| TT | 1.00 (referent) | 1.00 (referent) | 1.00 (referent) | 1.00 (referent) | 1.00 (referent) | 1.00 (referent) | 1.00 (referent) | 1.00 (referent) |
| CT | 1.34 (1.17-1.54) | 1.23 (0.94-1.60) | 1.26 (0.95-1.68) | 1.31 (0.90-1.91) | 0.92 (0.70-1.19) | 0.84 (0.53-1.31) | 0.62 (0.25-1.55) | 0.95 (0.86-1.04) |
| CC | 1.94 (1.62-2.33) | 1.63 (1.18-2.25) | 1.07 (0.75-1.52) | 1.57 (1.01-2.46) | 1.08 (0.72-1.62) | 0.57 (0.30-1.10) | 0.62 (0.20-1.93) | 0.99 (0.87-1.13) |
| AMD severity (fellow eye) | ||||||||
| Better | 0.42 (0.33-0.55) | 0.50 (0.34-0.73) | 0.88 (0.55-1.42) | 1.03 (0.67-1.57) | 2.00 (1.12-3.58) | 8.97 (1.01-80.10) | ||
| Same | 1.00 (referent) | 1.00 (referent) | 1.00 (referent) | 1.00 (referent) | 1.00 (referent) | 1.00 (referent) | 1.00 (referent) | |
| Worse | 4.90 (4.26-5.63) | 2.09 (1.42-3.06) | 2.38 (1.74-3.25) | 2.46 (1.65-3.66) | 1.00 (0.51-1.93) | 1.56 (0.82-2.97) | 1.23 (0.07-20.40) | |
| AMD severity (better eye) | ||||||||
| Level 1 | 1.00 | |||||||
| Level 2 | 0.98 (0.63-1.52) | |||||||
| Level 3 | 1.03 (0.76-1.40) | |||||||
| Level 4 | 1.14 (0.77-1.68) | |||||||
| Level 5 | 1.28 (1.03-1.58) | |||||||
AMD, age-related macular degeneration; HR, hazard ratio; CFH, complement factor H; CI, confidence interval.
Level 1 = no AMD, Level 2 = minimally severe early AMD, Level 3 = moderately severe early AMD, Level 4 = severe early AMD, Level 5 = late AMD.
More severe AMD in one eye was associated with increased incidence and progression of AMD in its fellow eye (reported as HR [95% confidence interval (CI)]: Level 1 to 2, 4.90 [4.26-5.63]; Level 2 to 3, 2.09 [1.42-3.06]; Level 3 to 4, 2.38 [1.74-3.25]; Level 4 to 5, 2.46 [1.65-3.66]). Less severe AMD in one eye was associated with less progression of AMD in its fellow eye (Level 2 to 3, 0.42 [0.33-0.55]; Level 3 to 4, 0.50 [0.34-0.83]).
Older age was associated with increased AMD incidence, progression, regression, and mortality. Being male was associated with increased mortality but not with AMD incidence, progression, or regression. CFH Y402H genotype CC was associated, relative to genotype TT, with increased AMD incidence and progression but not with regression or mortality. Late AMD in both eyes was associated with increased mortality relative to no AMD although earlier stages of AMD were not.
Five-year transition probabilities by age and AMD severity in the fellow eye
Five-year transition probabilities by age and AMD severity in the fellow eye are displayed in Figure 2. These probabilities are adjusted to the sex and CFH Y402H genotype distribution at the first BDES visit. For eyes free of AMD at age 50, incidence of any AMD in that eye by age 55 was higher if AMD was present in the fellow eye (7% vs. 2%). A similar effect of AMD severity in the fellow eye was seen at age 70 (21% vs. 6%) and at age 90 (24% vs. 10%). For an eye with AMD at Level 2 at age 50, regression to no AMD by age 55 was less common as AMD severity in the fellow eye moved from better to same to worse (14% vs. 12% vs. 11%); progression to Level 3 or higher was more common as AMD severity in the fellow eye increased from better to same to worse (11% vs. 25% vs. 40%). Similar relationships are seen at age 70 (regression: 17% vs. 12% vs. 9%; progression: 23% vs. 44% vs. 57%) and at age 90 (regression: 6% vs. 3% vs. 2%; progression: 21% vs. 29% vs. 31%). Patterns are similar for eyes with AMD at Level 3 or Level 4.
Figure 2.
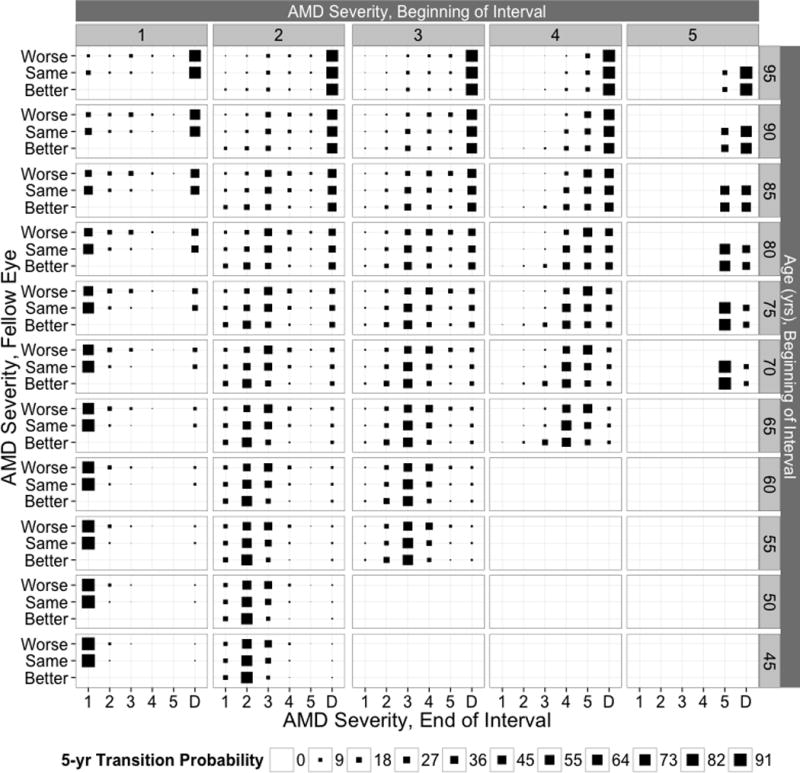
Five-year transition probabilities to age-related macular degeneration (AMD) states and death for the specified initial AMD state, fellow eye AMD state, and age in the Beaver Dam Eye Study. Adjusted to the sex and Complement Factor H Y402H genotype distribution at the baseline examination.
Simulated realizations of AMD history for individuals free of AMD at age 45 years
To quantify the extent to which AMD severity in the fellow eyes track each other, we simulated realizations of AMD history for 1000 subjects (for each sex and CFH genotype combination) free of AMD at age 45 years from the estimated MSM. For comparison, we performed an identical simulation assuming no impact of the fellow eye on AMD incidence, progression, and/or regression. The incidence of any AMD (through age 100 years) adjusted to the sex and CFH Y402H genotype at the first BDES visit was 50% in both sets of simulations. When accounting for fellow eye AMD status, 51% of subjects who developed any AMD always maintained AMD states in their two eyes within 1 step of each other; 90% stayed within 2 steps. Conversely, without the influence of the fellow eye, only 31% stayed within 1 step and 64% stayed within 2 steps.
Comment
In a cohort followed for 20 years, we showed that AMD severity in one eye largely tracks AMD severity in the fellow eye at all stages of the disease (lifetime occurrence of asymmetry greater than 2 steps < 10%). Our model demonstrated the effect of one eye on incidence and progression of AMD in its fellow eye across the entire continuum of AMD severity.
The MSM used here is advantageous because it models the course of AMD at the eye level rather than the subject level used in previous work.22,23 The higher resolution of the state space (25 left eye/right eye AMD states rather than 5 worse eye AMD states) allows us to better exploit all of the available information from both eyes rather than artificially integrating them into a single subject-level measure. The model can also easily incorporate eye-level covariates in addition to subject-level covariates. In addition, it can more usefully exploit the information from subjects with gradable photographs of one eye and ungradable photographs of the other. Disadvantages of the MSM are the large computational burden involved in model fitting, which grows quickly along with the number of states, and the sparseness of information regarding some transitions, which, for example, requires categorization of fellow eye AMD severity as worse, same, or better instead of using the exact severity level.
Estimated effects of subject-level covariates (age, sex, and CFH genotype) on incidence, progression, and regression of AMD are qualitatively and quantitatively similar to those seen in subject-level MSMs.22,23 Age and CFH genotypes CC and CT are associated with increased incidence and progression of AMD, while sex is not associated with incidence, progression, or regression of AMD. In this study, late AMD in both eyes is associated with a 28% increase in overall mortality compared to no AMD in at least one eye. This is qualitatively consistent with our prior findings,22 which found late AMD in at least one eye to be associated with a 37% increase in overall mortality compared to no AMD in both eyes, despite the differences in the reference and exposed categories. These differences suggest that there may be a role for fellow eye AMD severity in the association with mortality. Due to the small number of subjects with late AMD, we have limited ability to investigate this question.
This information may be helpful to clinicians in assessing the prognosis of the better eye. For example, over five years, an eye free of AMD is 2.4-3.5 times as likely to develop incident AMD if the fellow eye has AMD than if the fellow eye is also free of AMD. In a clinical trial setting, it provides estimates of progression of the better (worse) eye that can be used for sample size calculation for trials of eye-specific interventions in subjects with asymmetric disease.
The estimates of late AMD were based solely on grading of stereoscopic 30° color fundus photographs. It is likely that new imaging technologies such as spectral domain optical coherence tomography, fundus autofluorescence, and infrared imaging will, in the future, be incorporated into new classification schemes that may provide different estimates of disease. The MSM described herein will be applicable to assessment of risk of AMD progression using these newer, more detailed classification systems.
We are currently working to extend these models to account for potential misclassification of AMD assessed by fundus photographs. Based on our previous findings,23 the major substantive impact of failure to directly incorporate misclassification into the MSM is likely to be an overestimate of the rate of AMD regression, but the qualitative findings for covariate effects, including fellow eye AMD severity, are unlikely to change. As such, rates of AMD regression presented here should be interpreted with caution.
In summary, we provide an approach using MSMs to model incidence, progression, and regression of AMD at the eye level rather than the subject level. We have considered a small number of determinants of AMD to illustrate the modeling approach; extensions of the model to incorporate additional covariates are conceptually straightforward, if computationally challenging. This modeling approach will provide greater insight into the impact of genetic and environmental factors on the course of AMD; it will also facilitate the inclusion of eye-level covariates as exposures, confounders, and mediators. The general modeling approach described here will be applicable to other AMD severity scales.24,25
Acknowledgments
Funding/Support: The National Institutes of Health grant EY06594 (R Klein, BEK Klein) provided funding for entire study including collection and analyses of data; further support for data analyses was provided by an unrestricted grant from Research to Prevent Blindness, New York, NY.
Role of the Funder/Sponsor: The funders had no role in the design and conduct of the study; collection, management, analysis, and interpretation of the data; preparation, review, or approval of the manuscript; and decision to submit the manuscript for publication.
Footnotes
Conflict of Interest Disclosures: Dr. R. Klein reports grants from National Eye Institute and from Research to Prevent Blindness during the conduct of the study.
Author Contributions: Conception and design (REG), acquisition of data (RK, BEKK, KEL, SKI), analysis and interpretation of data (REG, RK, BEKK, KEL, SKI, TAS), drafting of the manuscript (REG), critical revision of the manuscript for important intellectual content (KEL, RK, BEKK, SKI, TAS), statistical expertise (REG), obtaining funding (RK, BEKK), administrative/technical/material support (TAS).
Meeting Presentation: An abstract of this study was presented at the 2014 Annual Meeting of the Association for Research in Vision and Ophthalmology (ARVO), Orlando, Florida, USA, May 8, 2014.
Author Contributions: Dr. R. Gangnon had full access to all the data in the study and takes responsibility for the integrity of the data and the accuracy of the data analysis. REG and KEL (both of the University of Wisconsin School of Medicine and Public Health) conducted and are responsible for the data analysis.
Disclaimer: The content is solely the responsibility of the authors and does not necessarily reflect the official views of the National Eye Institute or the National Institutes of Health.
References
- 1.Klein R, Klein BE, Linton KL. Prevalence of age-related maculopathy. The Beaver Dam Eye Study. Ophthalmology. 1992;99(6):933–943. doi: 10.1016/s0161-6420(92)31871-8. [DOI] [PubMed] [Google Scholar]
- 2.Klein R, Klein BE, Jensen SC, Meuer SM. The five-year incidence and progression of age-related maculopathy: the Beaver Dam Eye Study. Ophthalmology. 1997;104(1):7–21. doi: 10.1016/s0161-6420(97)30368-6. [DOI] [PubMed] [Google Scholar]
- 3.Keilhauer CN, Fritsche LG, Weber BH. Age-related macular degeneration with discordant late stage phenotypes in monozygotic twins. Ophthalmic Genet. 2011;32(4):237–244. doi: 10.3109/13816810.2011.592177. [DOI] [PubMed] [Google Scholar]
- 4.Mann SS, Rutishauser-Arnold Y, Peto T, et al. The symmetry of phenotype between eyes of patients with early and late bilateral age-related macular degeneration (AMD) Graefes Arch Clin Exp Ophthalmol. 2011;249(2):209–214. doi: 10.1007/s00417-010-1483-x. [DOI] [PubMed] [Google Scholar]
- 5.Nunes RP, Gregori G, Yehoshua Z, et al. Predicting the progression of geographic atrophy in age-related macular degeneration with SD-OCT en face imaging of the outer retina. Ophthalmic Surg Lasers Imaging Retina. 2013;44(4):344–359. doi: 10.3928/23258160-20130715-06. [DOI] [PubMed] [Google Scholar]
- 6.Marques JP, Costa M, Melo P, et al. Ocular Risk Factors for Exudative AMD: A Novel Semiautomated Grading System. ISRN Ophthalmol. 2013;2013:464218. doi: 10.1155/2013/464218. [DOI] [PMC free article] [PubMed] [Google Scholar]
- 7.Pieramici DJ, Bressler SB. Age-related macular degeneration and risk factors for the development of choroidal neovascularization in the fellow eye. Curr Opin Ophthalmol. 1998;9(3):38–46. doi: 10.1097/00055735-199806000-00007. [DOI] [PubMed] [Google Scholar]
- 8.Klein R, Klein BE, Linton KL, De Mets DL. The Beaver Dam Eye Study: visual acuity. Ophthalmology. 1991;98(8):1310–1315. doi: 10.1016/s0161-6420(91)32137-7. [DOI] [PubMed] [Google Scholar]
- 9.Klein R, Klein BE. The Beaver Dam Eye Study Manual of Operations, Revised. Springfield, VA: National Technical Information Service; 1991. Accession No. PB91-149823. [Google Scholar]
- 10.Klein R, Klein BE. The Beaver Dam Eye Study II Manual of Operations. Springfield, VA: National Technical Information Service; 1995. Accession No. PB95-273827. [Google Scholar]
- 11.Klein R, Klein BE, Lee KE. Changes in visual acuity in a population. The Beaver Dam Eye Study. Ophthalmology. 1996;103(8):1169–1178. doi: 10.1016/s0161-6420(96)30526-5. [DOI] [PubMed] [Google Scholar]
- 12.Klein R, Klein BE, Lee KE, Cruickshanks KJ, Chappell RJ. Changes in visual acuity in a population over a 10-year period : The Beaver Dam Eye Study. Ophthalmology. 2001;108(10):1757–1766. doi: 10.1016/s0161-6420(01)00769-2. [DOI] [PubMed] [Google Scholar]
- 13.Klein R, Klein BE, Lee KE, Cruickshanks KJ, Gangnon RE. Changes in visual acuity in a population over a 15-year period: the Beaver Dam Eye Study. Am J Ophthalmol. 2006;142(4):539–549. doi: 10.1016/j.ajo.2006.06.015. [DOI] [PubMed] [Google Scholar]
- 14.Jackson CH. Multi-state models for panel data: the msm package for R. J Stat Softw. 2011;38(8):1–28. [Google Scholar]
- 15.R Development Core Team. R: A language and environment for statistical computing. Vienna, Austria: R Foundation for Statistical Computing; 2008. computer program. [Google Scholar]
- 16.Klein R, Klein BE, Tomany SC, Meuer SM, Huang GH. Ten-year incidence and progression of age-related maculopathy: The Beaver Dam eye study. Ophthalmology. 2002;109(10):1767–1779. doi: 10.1016/s0161-6420(02)01146-6. [DOI] [PubMed] [Google Scholar]
- 17.Klein R, Davis MD, Magli YL, Segal P, Klein BE, Hubbard L. The Wisconsin age-related maculopathy grading system. Ophthalmology. 1991;98(7):1128–1134. doi: 10.1016/s0161-6420(91)32186-9. [DOI] [PubMed] [Google Scholar]
- 18.Klein R, Davis MD, Magli YL, Segal P, Klein BE, Hubbard L. The Wisconsin Age-Related Maculopathy Grading System. Springfield, VA: National Technical Information Service; 1991. Accession No. PB91-184267. [DOI] [PubMed] [Google Scholar]
- 19.Klein R, Klein BE, Knudtson MD, Meuer SM, Swift M, Gangnon RE. Fifteen-year cumulative incidence of age-related macular degeneration: the Beaver Dam Eye Study. Ophthalmology. 2007;114(2):253–262. doi: 10.1016/j.ophtha.2006.10.040. [DOI] [PubMed] [Google Scholar]
- 20.Efron B, Tibshirani RJ. An Introduction to the Bootstrap. Boca Raton: Chapman and Hall/CRC; 1994. [Google Scholar]
- 21.Knudtson MD, Klein BE, Klein R. Age-related eye disease, visual impairment, and survival: the Beaver Dam Eye Study. Arch Ophthalmol. 2006;124(2):243–249. doi: 10.1001/archopht.124.2.243. [DOI] [PubMed] [Google Scholar]
- 22.Gangnon RE, Lee KE, Klein BE, Iyengar SK, Sivakumaran TA, Klein R. Effect of the Y402H variant in the complement factor H gene on the incidence and progression of age-related macular degeneration: results from multistate models applied to the Beaver Dam Eye Study. Arch Ophthalmol. 2012;130(9):1169–1176. doi: 10.1001/archophthalmol.2012.693. [DOI] [PMC free article] [PubMed] [Google Scholar]
- 23.Gangnon RE, Lee KE, Klein BE, Iyengar SK, Sivakumaran TA, Klein R. Misclassification can explain most apparent regression of age-related macular degeneration: results from multistate models with misclassification. Invest Ophthalmol Vis Sci. 2014;55(3):1780–1786. doi: 10.1167/iovs.13-12375. [DOI] [PMC free article] [PubMed] [Google Scholar]
- 24.Ferris FL, Davis MD, Clemons TE, et al. A simplified severity scale for age-related macular degeneration: AREDS Report No. 18. Arch Ophthalmol. 2005;123(11):1570–1574. doi: 10.1001/archopht.123.11.1570. [DOI] [PMC free article] [PubMed] [Google Scholar]
- 25.Ferris FL, 3, Wilkinson CP, Bird A, et al. Clinical classification of age-related macular degeneration. Ophthalmology. 2013;120(4):844–851. doi: 10.1016/j.ophtha.2012.10.036. [DOI] [PMC free article] [PubMed] [Google Scholar]