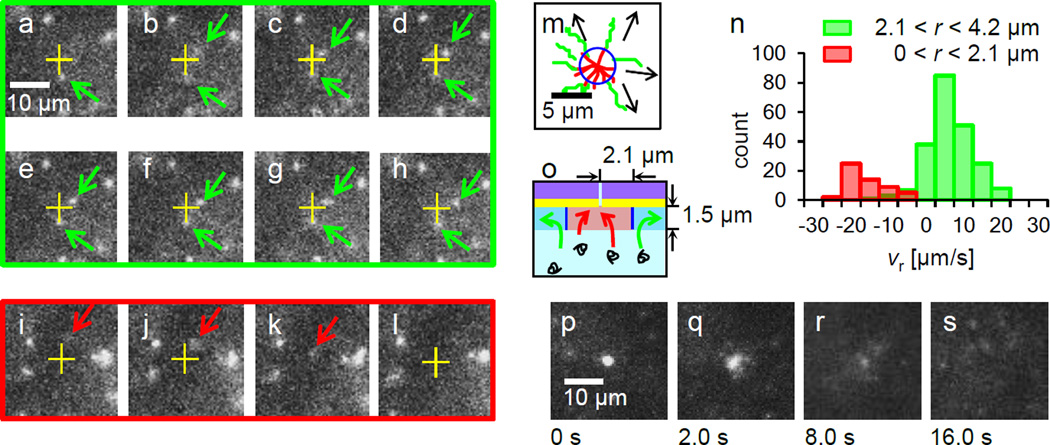
Figure 3.
DNA motions at Vgate = −0.4 V, Vcis = 0 and Vtrans = 0.3 V in 0.01 M KCl. (a)–(h) Images extracted from a sequential 14 frames per second movie showing typical behavior of DNA molecules. One green arrowed DNA below a nanopore (a yellow cross) is nearly at rest while the other green arrowed above is gradually drifting away. From (i) to (l), images are extracted at t = 0.00, 0.14, 0.29 and 0.43 sec. A red arrowed DNA is landing and entering into the nanopore. (m) A drawing of typical DNA trajectories in the vicinity of a nanopore reveals two types of DNA motions. 8 red trajectories present DNA molecules for translocations into the nanopore while 7 green trajectories show the existence of DNA molecules drifting away radially from the nanopore. Arrows indicate the direction of the green trajectories. A blue circle is likely the boundary between these two categories of motions. (n) A histogram of radial velocity of DNA molecules drifting in the ranges 0 <r ≤ 2.1 µm and 2.1 <r ≤ 4.2 µm. Apparently the distribution shows the anisotropic DNA motions in the radial direction. (o) A schematic of the extrapolated two different DNA motions, red and green arrows in the r – z plane near nanopore with the boundary is drawn in blue lines. The highlighted area corresponds to the imaging range by our optical microscope in the z axis. (p)–(s) DNA aggregations near a nanopore at Vgate= −0.4 V, Vcis = 0 and Vtrans = 0.3 V in 0.01 M KCl. (p) Over 20 DNA molecules are aggregated near the nanopore in 120 sec. (q)–(s) The images are taken 2, 8, 16 sec after turning all electrode’s voltages to 0 V at (p) for eliminating electric fields in solution. Free diffusion of DNA molecules from the aggregated DNA is observed in this image sequence. No DNA molecule is left at the nanopore in (s).

