Abstract
Fetal scanning is one of the most common applications of ultrasound imaging and serves as a source of vital information about maternal and fetal health. Visualization of clinically relevant structures, however, can be severely compromised in difficult-to-image patients due to poor resolution and the presence of high levels of acoustical noise or clutter. We have developed novel coherence-based beamforming methods called Short-Lag Spatial Coherence (SLSC) imaging and Harmonic Spatial Coherence imaging (HSCI) and applied them to suppress the effects of clutter in fetal imaging. This method is used to create images of the spatial coherence of the backscattered ultrasound as opposed to images of echo magnitude. We present the results of a patient study to assess the benefits of coherence-based beamforming in the context of first trimester fetal exams. Matched fundamental B-mode, SLSC, harmonic B-mode and HSCI images were generated using raw RF data collected on 11 volunteers in the first trimester of pregnancy. The images were compared for qualitative differences in image texture and target conspicuity as well as using quantitative imaging metrics such as SNR, CNR and contrast. SLSC and HSCI showed statistically significant improvements across all imaging metrics compared to B-mode and harmonic B-mode respectively. These improvements were greatest for poor quality B-mode images where contrast of anechoic targets was improved from 15 dB in fundamental B-mode to 27 dB in SLSC and 17 dB in harmonic B-mode to 30 dB in HSCI. CNR improved from 1.4 to 2.5 in the fundamental images and 1.4 to 3.1 in the harmonic case. These results exhibit the potential of coherence-based beamforming to improve image quality and target detectability, especially in high noise environments.
Keywords: Spatial Coherence, Fetal Ultrasound, Clutter reduction, Beamforming, Ultrasound Imaging
1. Introduction
Fetal imaging has been a mainstay of diagnostic ultrasonography since its introduction into the field of medicine in the late 1960’s and provides valuable anatomical as well as physiological information about the progress of pregnancy. Today, it is a standard procedure in prenatal care and is routinely performed to assess fetal and maternal health. One of the earliest diagnostic procedures during pregnancy is the first trimester scan. This exam can be conducted transvaginally at early stages (<8 weeks) or transabdominally later in development and is used to investigate basic information such as the number of fetuses and location of the placenta, maternal pelvic structures. It has been shown to be useful in estimating accurate gestational age1 and reducing preventable procedures such as postdate induction2. This visit is also critical for early detection of fetal structural abnormalities and genetic syndromes. Measurement of nuchal translucency (NT) thickness is one of the major ultrasound markers measured during the first trimester exam. It is well established as a predictor of chromosomal abnormalities3,4 and has also been correlated with congenital heart disease (CHD)5. The feasibility of fetal echocardiography to interrogate structural development of the fetal heart during the first trimester has also been pursued6,7,8. Besides NT thickness, several other ultrasound markers such as fronto-maxillary facial (FMF) angle, nasal bone (NB) and ductus venosus (DV) have also been investigated for their clinical impact in determining the health of the fetus9,10.
The benefits of early detection of fetal developmental anomalies are, however, contingent upon the ability to acquire good quality images that allow clinicians to make accurate measurements of the ultrasound markers mentioned above. Several studies have drawn the relation between maternal obesity and sub-optimal visualization of fetal anatomy; this issue is exacerbated for mothers with prior caesarian sections or abdominal surgeries11-13. Difficulty in visualization of fetal anatomy in the obese population has been reported to be a significant issue even at late gestational ages and for extended exam durations14. The rate of sub-optimal visualization can be as high as 49.8% for cardiac structures and 31% for craniospinal structures15. Degradation of image quality of ultrasound images can arise from two main causes: a decrease in resolution and the presence of acoustical noise. Imaging deep targets adversely affects resolution because it necessitates the use of lower frequencies to improve depth of penetration and also imposes a diffraction limit on resolution due to a fixed aperture size. This is the case especially in obese patients due to factors such as increased depth of insonification and increased absorption in the adipose tissue. Acoustical noise or clutter, on the other hand, results from factors such as reverberation in the subcutaneous layers, imperfect focusing and spatial misregistration of echoes. Clutter presents itself as a temporally stable overlying haze and degrades target definition and image conspicuity16,17.
Over the past couple decades; various techniques have been developed to improve the quality of ultrasound images. The two that have had gained the most traction in clinical settings are tissue harmonic imaging and spatial compounding. Harmonic imaging works on the principle of non-linear propagation of ultrasonic waves and the generation of their harmonics within tissue. Harmonic imaging improves resolution, because it utilizes a higher frequency (on receive) and reduces clutter because the harmonics are generated during propagation through the tissue and are thus less susceptible to reverberation near the transducer face17,18. However, harmonic imaging does suffer from lower penetration and can potentially be more susceptible to phase aberration due to the higher frequency17. Spatial compounding, on the other hand, aims to reduce speckle variance in the image by combining multiple views of the target area acquired from various angles19. This technique, however, often tends to draw trade-offs between spatial resolution and frame rate. While both methods mentioned above have improved the image quality of clinical ultrasound images significantly, they do not address the underlying problem of clutter directly. Consequently, they underperform in obese subjects where imaging conditions are challenging and clutter sources are abundant20.
We have recently introduced beamforming techniques that generate images based on the spatial coherence of received ultrasound signals as opposed to their amplitude21. These techniques are termed Short Lag Spatial Coherence (SLSC) and, its harmonic counterpart, Harmonic Spatial Coherence Imaging (HSCI). Through previous investigations we have found them to be measurably more resistant to clutter artifacts compared to B-mode and tend to produce better image quality and contrast. The robustness of these improvements has previously been shown to hold up for lesion detectability tasks in simulations22 as well for in vivo detection of clinically relevant structures in human livers23 and hearts24. This work aims to investigate the application and potential benefits of coherence imaging in the context of fetal ultrasound. Given our prior success in the case of liver vasculature, we expect SLSC and HSCI to improve structure detectability, especially for hypoechoic targets. The results of this study show that SLSC and HSCI have strong potential in suppressing clutter artifacts especially in poor imaging environments. The image quality improvements lead to better target detectability as well as measurable enhancements in image quality metrics. These effects could significantly improve the diagnostic value of fetal ultrasound exams.
2. Methods
A. Spatial Coherence Imaging
In pulse-echo ultrasound, radio frequency (RF) backscattered echoes are acquired for targets along axial depth at particular lateral positions within the field of view. These RF signals are recorded at individual elements in the receive aperture as a function of depth and represent spherically diverging waves reflected from the scattering medium. This data set is commonly referred to as ‘channel data’. These signals must first be time delayed or focused to account for geometric path length differences due to the curvature of the received wavefront. In conventional beamforming, the focused signals are then summed across the receive aperture to generate images of echo amplitude or brightness. However, valuable diagnostic information can also be extracted by interrogating the spatial covariance of the focused signals.
Spatial covariance of ultrasonic signals represents the similarity of the time delayed received signals at two points in space as a function of their spatial separation or lag. It is predicted by the van Cittert-Zernike (VCZ) theorem as the Fourier transform of the square of the product of the transmit beam pattern with the scattering function25. The spatial covariance function can be normalized by the variance of its constituent RF signals to yield the spatial coherence function. This normalization removes the effect of echo amplitude. The spatial coherence function can be computed as a function of element separation or lag using equation 1.
| (1) |
Here, N is the number of elements in the receive aperture, m is the element separation or lag, si(n) are the focused individual-channel signals for element i as a function of depth and n2 − n1 is the axial window used for the correlation. This window is generally selected to be on the order of a wavelength.
This computation yields a coherence function for every depth sample in the data set. Assuming relative uniformity of the transmit beam pattern, the shape of the coherence function is determined by the reflectivity of the scattering object and the amount of signal degradation due noise sources like acoustical clutter or electronic noise. Targets can then be differentiated based on their spatial coherence signature on a pixel-by-pixel basis. The most significant differences between the coherence curves occur at short lags and thus an effective way to quantify these differences is to integrate the coherence curves over short lags, which are on the order of 5-30% of the transmit aperture21. The quantity that can be displayed as an image is the short-lag spatial coherence (SLSC) metric. The SLSC metric is calculated using equation 2 as:
| (2) |
where M is the lag to which the coherence curve is integrated to generate the pixel value Vslsc. The SLSC image is a display of this metric; it is calculated for all axial windows in a particular channel data set to generate depth information and repeated over all channel data sets (corresponding to various look directions) to generate lateral information across the field of view.
Spatial coherence of the second harmonic signals can also be measured in the same manner. This requires harmonically received channel data sets, which can be acquired using either pulse inversion or band-pass filtering of fundamental channel data. Equations 1 and 2 can then be applied to generate a harmonic counterpart of the SLSC image; this technique is called harmonic spatial coherence imaging (HSCI). Even though harmonic signals have lower amplitudes and therefore lower SNR, they are theorized to have superior coherence properties26. Thus, HSCI images show improvements in image quality over SLSC images.
B. Study Design
A pilot study to assess the potential benefits of coherence imaging in the detection of first trimester ultrasound markers was conducted at the Duke University Hospital, Fetal Diagnostic Center. Volunteers were recruited into the study at the time of their scheduled first trimester screening exams. Fetal and maternal structures relevant to the first trimester were targeted during data acquisition. Among these were fetal developmental landmarks like stomach, bladder, ventricles in the brain and nuchal translucency and maternal structures like uterine wall and placental edge. The data acquisition process was initiated after receiving IRB approval of the protocol and written informed consent from all volunteers. Data was collected transabdominally on 11 volunteers. They were divided into three image-quality groups (good, medium and poor quality images) based on the subjective assessment of clinical B-mode image made by the sonographer at the time of acquisition.
Multiple individual channel data sets were acquired for each volunteer using the Siemens Acuson S2000™ (Siemens Medical Solutions, USA, Inc., Issaquah, WA). Data was collected using a Siemens 4C1 abdominal probe over a 40° field of view consisting of 118 A-lines. Channel data acquisition was made possible by employing a custom synthetic aperture sequence and the Axius Direct™ Ultrasound Research Interface27.
On transmit, an F/2 configuration was used with a single conventional focus set between 8 and 10 cm. On receive, unfocused channel signals were acquired for 64 (out of 128) elements around each transmit direction. A Siemens 4C1 curvilinear array was utilized with center frequency of 2.5 MHz. Fundamental data was acquired at 2.22 MHz and the second harmonic was acquired by band-pass filtering the focused channel signals around 4.44 MHz. The channel signals were reconstructed offline into SLSC and HSCI images. We also acquired the delay-and-summed RF signals within the same sequence to reconstruct matched B-mode images. The receive F-number was kept constant at 1.5 in the case of the summed RF signals.
C. Image Processing and Statistical Analysis
The individual channel data sets were beamformed as described in the previous section into matched SLSC and HSCI images. The axial kernel length used in Eq 1. was one wavelength thereby maintaining comparable axial resolution to B-mode. The short lag cut off for both SLSC and HSCI was set at M=12, which corresponds to 25% of the transmit aperture. Matched fundamental and harmonic B-mode images were also reconstructed using the delay-and-summed RF signals. The four images were then grouped into matched quads to facilitate an easy comparison of the visibility of target structures.
Numerical metrics of image quality were also computed to facilitate a quantitative comparison of the techniques. Speckle signal-to-noise ratio (SNR), contrast-to-noise ratio (CNR) and contrast were calculated for all acquired images using the definitions in equations 3,4 and 5. These metrics were calculated on beamformed, envelope-detected pixel values for B-mode (prior to log compression) and on the computed pixel values of the coherence metric (Vslsc) for SLSC and HSCI.
| (3) |
| (4) |
| (5) |
Here, SS is the magnitude of the pixel values in a region of uniform speckle, averaged over a spatial region (denoted by the operator). σS is the standard deviation of the pixel values over the same region. SA and σA are the same quantities measured in an anechoic region. Regions of uniform speckle were chosen either in the fetal abdomen or the uterine wall. Anechoic regions were chosen in the amniotic cavity. All regions were manually traced on the harmonic B-mode image and placed as close as possible to the transmit focus. The metrics were calculated for the same spatial regions on all four matched images within an acquisition.
Each calculated metric was then binned based on the image quality categorization of the volunteers as per the visual assessment of the clinical B-mode scan by the sonographer. The image quality categories assigned by the sonographer were good, medium and poor quality. Comparisons of these metrics between fundamental B-mode vs. SLSC and harmonic B-mode vs. HSCI were made for each individual image quality group. Statistical significance of these changes was established using the Kolmogorov-Smirnov test. p-values of less than 0.01 were considered to indicate a statistically significant difference. A similar analysis was performed by pooling the metrics of all images within each of the three image quality groups to study the consistency of changes across the four imaging techniques implemented. The matched images were also compared for differences in target detectability, image conspicuity and uniformity.
3. Results
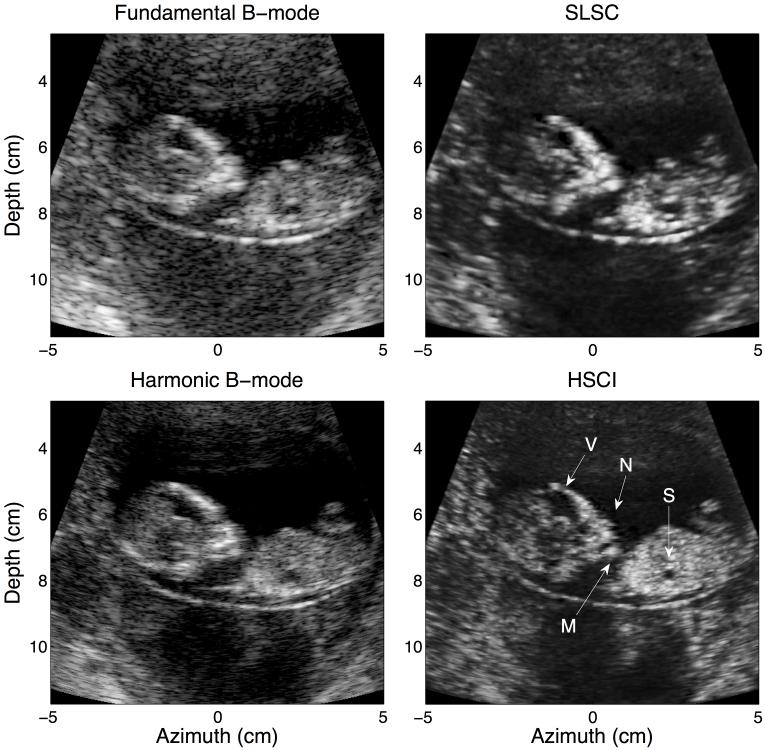
Figures 1-5 show examples of matched B-mode and SLSC/HSCI images from each image quality group. The B-mode images are presented on a logarithmic gray-scale with a dynamic range of 50-55 dB, while the coherence images are displayed on a linear scale ranging from 0 to 1 (ie. no compression is applied to the coherence images). A linear gray level mapping was chosen for the coherence images because the distribution of pixel values generated through the coherence beamformer is fairly uniform over its full dynamic range. In the case of B-mode this distribution is skewed to the low end of the range and thus log compressed is required to faithfully represent the image.
FIG. 1.
A good quality B-mode image targeting the fetal stomach (S). While most structures are visible in all four images, they are most clearly defined in the HSCI image. Additional structural features in the sagittal view of the ventricles (V) and the fetal profile (nose (N) and mouth (M)) are evident when comparing the harmonic B-mode to the HSCI.
FIG. 5.
This figure shows a poor quality B-mode image. There is appreciable ring down from the uterine wall corrupting the amniotic cavity and from the fetal skull into the ventricles (V). The same structures in the HSCI image appear much more distinct from the background tissue. CNR (for the ventricles) improved from 0.90 to 2.57; contrast for the same jumped from 7.49 dB to 23.70 dB. The ROIs used to calculate the CNR and contrast for the ventricles (V) are outlined in white.
Figure 1 shows the four imaging modalities in a patient with good quality B-mode images as assessed by the sonographer. The major anatomical structures of the fetus captured here include the fetal stomach (S), ventricles in the brain (V), facial profile and lower extremities. While these structures are visible in the fundamental B-mode, the image suffers from poor resolution and speckle noise. The level of clutter in this case is minimal but can be noticed in the dark area below the fetus. The acoustical noise in this region decreases appreciably between fundamental and harmonic B-mode, suggesting that the harmonic B-mode is indeed less susceptible to clutter artifacts. Comparing the fundamental B-mode and SLSC, we can notice significantly less clutter in the SLSC, however, the detectability of fetal structures remains less than optimal owing to resolution limitations. The HSCI image on the other hand, appears more true to the expected anatomy and is more accurately able to capture subtle features like the nose (N) and the mouth (M) of the fetus. The structural borders in this image are also much more clearly defined; this is especially evident around the fetal stomach and the ventricles. The anechoic structures appear distinct from the background tissue which has a smoother texture compared even to the harmonic B-mode. The features captured in the harmonic B-mode and HSCI images are very similar in this low clutter environment.
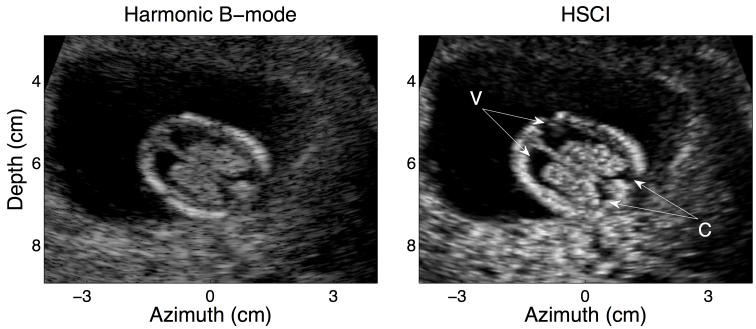
Figure 2 demonstrates another example of a good quality harmonic B-mode image and the corresponding HSCI image. It is evident that even in the absence of significant clutter, coherence imaging is able to preserve fine anatomical structure of the fetal ventricles. The distinction between the internal border of the fetal skull and the fetal brain is appreciable due to the enhanced borders in the HSCI image; the choroids (C) (at the posterior edge of the skull) are also more clearly outlined.
FIG. 2.
Harmonic B –mode (left) and HSCI image (right) of a good quality data set. The target structure here is a horizontal view of the ventricles in the fetal brain (V). Clutter does not have a major impact in these images; however, the edge enhancing effect of coherence imaging is noticeable especially around the posterior ends of the ventricles.
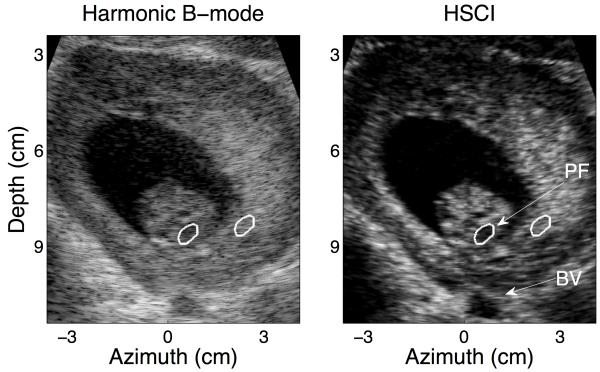
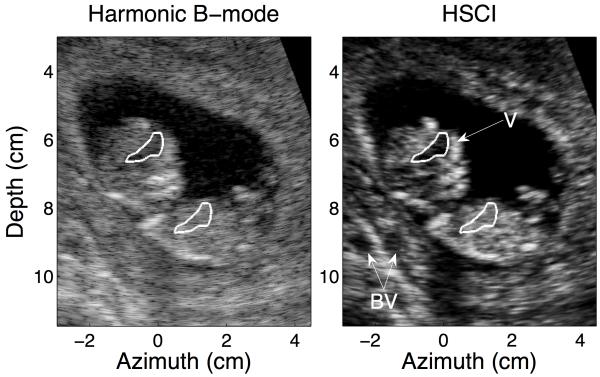
An example of a medium quality B-mode image and its HSCI counterpart is shown in Figure 3. Clutter manifests itself as an overlying haze and is appreciable in this image around the anterior uterine border, within the fetal ventricles and also over the anechoic target at the base of the image, which is suspected to be a blood vessel (BV). Suppression of these undesirable effects of incoherent noise leads to significant improvements in contrast between B-mode and SLSC/ HSCI. CNR more than doubles, from 1.71 in harmonic B-mode to 3.72 in HSCI, for the anechoic void at the base of the skull (suspected to be the posterior fossa (PF)); contrast for the same void showed an 8 dB improvement. Similar improvements are also observed for the anechoic region at the base of the field of view. One of the drawbacks of SLSC is a smaller depth of field and dropout in the near field; this is shown in Figure 3(b). The upper layers of the placenta are not as clearly visualized when compared to their appearance in the harmonic B-mode.
FIG. 3.
A representative medium quality B-mode image and its matched HSCI pair. A substantial level of clutter is observed around the walls of the amniotic cavity and within the fetal skull even in the harmonic B-mode, this is noticeable suppressed in the HSCI image. The layered structure of the uterus is also captured. The CNR for the anechoic region at the base of the fetal skull (PF) was measured to be 1.71 in the harmonic B-mode and 3.72 in the HSCI image. The contrast improved from 24.40 dB to 32.24 dB respectively. The ROIs used to calculate the CNR and contrast for the structure are outlined in white.
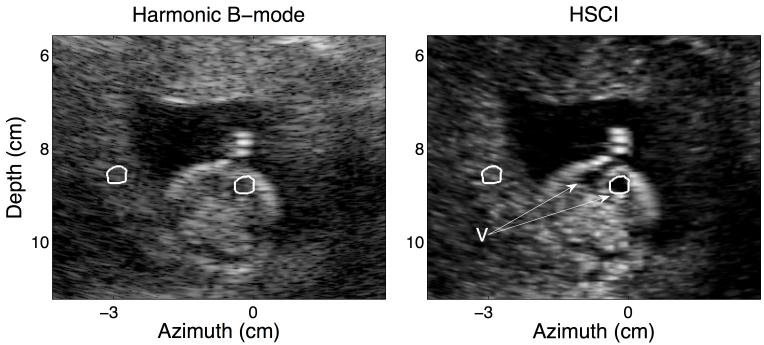
Figure 4 is another example of a medium quality B-mode image; the improvement in the detection of the fetal ventricles is evident again and is supported quantitatively by a greater than two fold increase in the CNR from 1.65 in the harmonic B-mode to 3.84 in HSCI. There are also potential blood vessels in the uterine wall (BV) (at a depth of 5 cm, lateral of 2 cm and depth of 9 cm, lateral of −2 cm) that are significantly more visible in the HSCI. There is an appreciable dark region below the fetal skull in the B-mode (at a lateral of 0 cm); suggesting this could potentially be a shadowing artifact (as is commonly seen in B-mode images). However, it appears dark on the coherence image as well suggesting that the local region is one of low echogenecity and is filled by clutter artifacts. This clutter is being rejected in the HSCI image thereby indicating the lack of viable scattering from this region. In the case of B-mode, it is ambiguous whether this dark region appears due to shadowing from the fetal bones directly above it or if it is indeed clutter corrupting an anechoic region.
FIG. 4.
This image shows a medium quality B-mode image and its matched HSCI image. While the fetal ventricles (V) show a good degree of improvement in clutter reduction, there are also a number of other structural differences of note. In two areas within the uterine wall (depth of 5 cm, lateral of 2 cm and depth of 9 cm, lateral of −2 cm) we observe anechoic voids (which could be blood vessels (BV)) in the HSCI image that are not captured in the harmonic B-mode. The ROIs used to calculate the CNR and contrast for the ventricles (V) are outlined in white.
Figure 5 shows a poor quality B-mode image of an axial view of the fetal brain. The clutter suppression is most evident in this image and leads to much better delineation of each individual ventricle (V) with a prominent midline between them. The contrast of anechoic structures of interest like the amniotic cavity and the ventricles (as compared to the background uterine tissue) is drastically enhanced. The surrounding uterine tissue has a much more textured appearance suggested high variance and low acoustical SNR. This can be attributed to an overall degradation of the quality of the data due to the high levels of acoustical clutter. However, the detectability of the targets of interest (fetal brain, skull, ventricles) is measurably improved in the HSCI image compared to the matched harmonic B-mode.
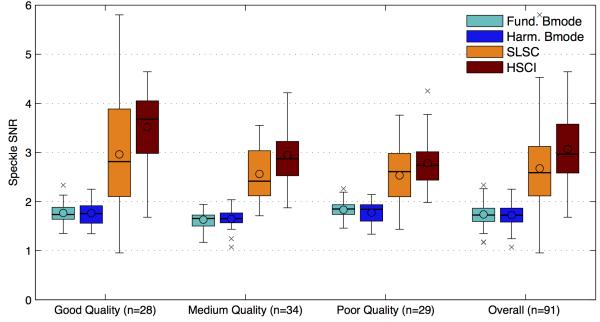
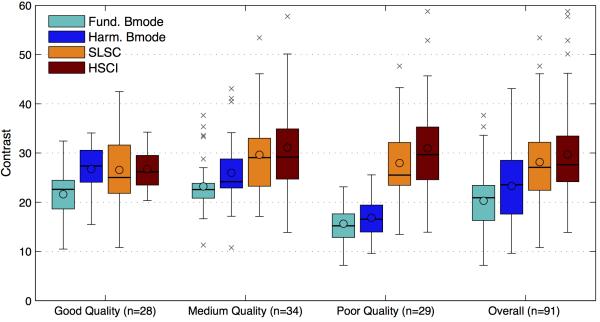
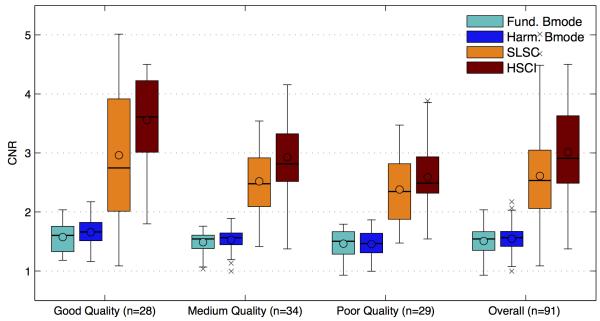
Figures 6,7 and 8 compare the SNR, contrast and CNR of the images collected from the images. The mean, median and interquartile ranges of the imaging metrics mentioned above are displayed in a box plot format for the four imaging techniques and as a function of the various image quality groups. The box plot on the far right displays the combined statistics of the metric for all images (combined across the image quality groups); this gives a broad sense of the direction of change for each metric between the techniques. The circles represents the mean, the horizontal bars represent the median, the top and bottom boundaries of the box represent the 75th and 25th percentile of the data respectively. The top and bottom of the fence represents 1.5 times the interquartile range (75th percentile – 25th percentile) above and below the respective ends of the box. Any data point outside of the range of the fence was considered an outlier and marked with crosses. The shades of teal/blue represent B-mode while the orange/red represent coherence imaging. Table 1 shows the percentage improvements in the means of each metric comparing fundamental B-mode to SLSC and harmonic B-mode to HSCI. The statistical significance of all improvements was tested using the Kolmogorov-Smirnov test and was determined to be significant if the p value was found to be less than 0.01.
FIG. 6.
The speckle SNR for matched images for all four imaging techniques is divided into the three image quality groups and also for all images combined. The broad trend shows that both B-mode techniques have a theoretical cap of 1.9 on the speckle SNR. SLSC/ HSCI does not have this limit and show a higher SNR for all matched cases, indicating a smoother image texture. A decreasing trend in SNR with image quality is observed for the SLSC/HSCI case, but no change is observed with fundamental /harmonic B-mode.
FIG. 7.
The contrast (in dB) measured between uniform speckle and a region of amniotic fluid. The contrast in B-Mode shows a general decreasing trend with decreasing image quality. On the other hand, the contrast in SLSC/HSCI stays relatively constant even as the image quality decreases. The harmonic B-mode and HSCI show small improvements in contrast when compared with fundamental B-mode and SLSC respectively.
FIG. 8.
The CNR of the B-mode modalities is relatively unchanged between fundamental and Harmonic imaging and is relatively flat across the three image quality groups. The CNR for SLSC/ HSCI images tend to be considerably higher for all cases suggesting an improvement in feature detectability.
Table 1.
Percentage improvements in the mean for speckle SNR, contrast and CNR between fundamental B-mode vs. SLSC and harmonic B-mode vs. HSCI across all three image quality groups.
| Good Quality (n=28) |
Medium Quality (n=34) |
Poor Quality (n=29) |
Overall (n=91) |
||
|---|---|---|---|---|---|
|
Speckle
SNR |
Fundamental B-mode
vs. SLSC |
62%* | 46%* | 41%* | 50%* |
|
Harmonic B-mode vs.
HSCI |
109%* | 73%* | 48%* | 72%* | |
| Contrast |
Fundamental B-mode
vs. SLSC |
10% | 28%* | 67%* | 29%* |
|
Harmonic B-mode vs.
HSCI |
4.3% | 20%* | 79%* | 17%* | |
| CNR |
Fundamental B-mode
vs. SLSC |
71%* | 60%* | 56%* | 64%* |
|
Harmonic B-mode vs.
HSCI |
117%* | 80%* | 69%* | 85%* |
The signifies a statistically significant improvement with a p<0.01.
The speckle SNR values displayed in figure 6, were measured over a region of uniform speckle close to the transmit focus chosen either within the fetal abdomen, the fetal brain or the uterine wall. The regions of interest were manually traced and were no smaller than 1 cm2 in area. The speckle SNR for the B-mode images, both fundamental and harmonic, lies in a fairly narrow range around the theoretical limit of 1.9128. It also stays relatively constant across the three image quality groups. SLSC and HSCI images display much higher speckle SNRs for all matched cases with HSCI being marginally better than SLSC. However, they do have a significantly broader spread and show a decreasing trend as image quality decreases. Across all the images we found there to be a 50% increase in SNR in the fundamental case and 72% in the harmonic.
The contrasts, shown in figure 7, were measured between the region of uniform speckle used for the SNR calculation and a region within the amniotic fluid. The region of amniotic fluid serves as an anechoic target. The contrast values for B-mode drop off significantly from good to poor quality images. This can mainly be attributed to increased clutter that is written into the amniotic cavity causing the mean brightness within the anechoic region to rise. The harmonic B-mode images show slightly higher contrast values but display the same decreasing trend. The contrast values of the SLSC and HSCI images stay relatively constant across the three image groups owing to the clutter suppression effect of this technique. The box plots on the far right are illustrative of the marginal improvements in contrast over the four modalities. The largest improvements were found to be in the poor quality images and were measured at 67% for the fundamental and 79% for the harmonic images. The contrast changes between fundamental B-mode vs. SLSC and harmonic B-mode vs. HSCI for the good quality image were found to be not statistically significant.
The CNR, shown in figure 8, is a measure of target detectability and is a measure combining the effects of SNR and contrast. This metric shows a gradual decreasing trend in the case of B-mode as well as coherence images. However, a side-by-side comparison of the two imaging techniques within each image quality group shows that SLSC/HSCI have appreciably higher CNR values compared to the B-modes. The range of improvements stretches from 117%, in the case of good quality harmonic images, to 56%, in the case of poor quality fundamental images.
4. Discussion
Even though B-mode and SLSC are both derived from the same raw channel data and appear similar in their representation of gross anatomy, they are inherently images of different tissue parameters. B-mode forms images of the echogenecity of tissue where local bright regions signify the presence of highly reflective scatterers while dark regions signify an absence of scatterers. This paradigm, however, suffers in in vivo imaging environments due to clutter that arises from sources such as reverberation, off-axis scattering and aberration17. Reverberant echoes occur when the transmitted sound gets trapped within tissue layers. Consequently, the echoes from such events appear at erroneous depth locations in the final image thereby generating acoustical clutter. Off-axis scattering leads to clutter due to the fact that echoes from the entire isochronous volume of the transmit beam contribute to form a lateral line in the image; thus the true lateral location of the scatterers that produced these echoes can be misrepresented. Phase aberration leads to clutter by degrading transmit and receive beam shapes and increasing off-axis scattering. These sources of clutter tend to be temporally stable, however, electronic or thermal noise also contributes to clutter in a temporally varying manner. Harmonic B-mode, while less susceptible to reverberation and off-axis scattering clutter, can exacerbate phase aberration clutter17. Harmonic images have lower clutter levels compared to their fundamental counterparts but are not immune to acoustical noise.
On the other hand, coherence-based imaging techniques, SLSC and HSCI, do not utilize the brightness information in the received echoes. Instead they differentiate tissue based on the similarity of the waveform received across the aperture or the spatial coherence of the received echo signals. The clutter suppression effect of SLSC/HSCI is based upon the principle that the coherence curve of pristine echo signals follows the VCZ theorem, while that of echoes corrupted by clutter (both temporally stable and varying) falls off that trend (towards zero) very quickly ie. at low lags23. These coherence curves, when integrated in the short lag region and displayed as an image allow for interrogation of local changes in coherence of the targets within the field. Thus, bright regions of a coherence image signify highly coherent structures (speckle or bone) while dark regions signify regions where the additive incoherent components of the signal (clutter) are dominant. This principle makes SLSC and HSCI ideal for detectability of small anechoic targets, especially in high noise environments where B-mode generally tends to suffer22,23. This effect is exemplified in the examples of medium and poor quality B-mode images (Figs. 3-5) and also describes the trends seen in Fig 7. The statistical insignificance of contrast changes in good quality images results from the fact that these data sets do not intrinsically have an appreciable amount of clutter. The increasing improvements in contrast from medium to poor quality images are achieved as the contrast in B-mode progressively diminishes while that in SLSC and HSCI stays relatively contrast.
Besides clutter suppression, a desirable change between the SLSC/HSCI and their B-mode counterparts is the improvement in the apparent smoothness of uniform tissue. In B-mode, uniform tissue has a characteristic speckled texture, which arises from the interference between multiple scatterers within each resolution cell. This imposes an intrinsic noise level independent limit on the speckle SNR of B-mode (both fundamental harmonic) and forces it to a value around 1.9128. Such a fundamental limit does not directly apply to coherence imaging. In SLSC and HSCI, the texture of the image is a function of local variations in the coherence curve on a pixel-by-pixel basis and the choice of lag cutoff used to generate the coherence image. While the lag cutoff was kept constant in this study, in general increasing this parameter leads to a coherence image with finer texture and increased variance and thereby lower SNR21.
The speckle SNRs of B-mode images tend to have a tight distribution around 1.9 for all groups presented in Fig 6. This is because in B-mode, speckle SNR is not affected by the level of intrinsic acoustical noise in the raw data. This is not the case for SLSC and HSCI. Here the variance of the image is affected by the subtle variations in the shape of the coherence curves. These curves are fairly sensitive to the acoustical noise in the raw data and thus can vary significantly between data sets, even when they were subjectively determined to be in the same image quality group based on the clinical B-mode. This phenomenon explains the larger spread in the box plots of speckle SNRs observed in the coherence images as compared to that of the B-mode images in Fig 6.
However, in general the variance of the coherence images tends to be lower than standard speckle variance observed in B-mode and consequently uniform tissue appears smoother in SLSC/HSCI images compared to matched B-mode cases. Tissue smoothness and SNR are also improved in HSCI when compared to SLSC, because the harmonic signals maintain coherence over longer lags and yields a more uniform coherence function26. The decreasing trend of the SNR, over decreasing image quality, is indicative of a rise in the incoherent component of the raw received data. In the extreme case where noise completely overrides the signal of interest, the speckle SNR of a coherence image will tend to 0 while that of the B-mode will hold steady at 1.9122.
SLSC and HSCI also tend to enhance tissue borders yielding a more crisp representation of structural boundaries. This is illustrated in Figs. 1-5 through the sharp borders of the fetal ventricles and also the uterine wall. Edges in B-mode tend to be blurred axially due to reverberation and laterally due to a finite beam width and side lobe effects. However, the edges in the SLSC/HSCI images are defined by variations in spatial coherence, which tends to drop quickly around edges thereby retaining a sharp transition. This effect can be useful in applications where measuring an accurate size of anatomical structures is important.
The combined effects of decreased clutter, increased background smoothness and enhanced edges leads to overall improvements in target detectability, especially for small anechoic targets. The imaging metric most closely related to performance of detectability tasks is CNR. Fig. 8 shows that target detectability is improved in the coherence image for each matched B-mode and SLSC/HSCI pair. As image quality decreases; the CNR in B-mode gradually trends downwards from 1.5. The coherence images, however, start off at a much higher value (3 and 3.5 for SLSC and HSCI respectively) owing to the higher SNR. While the CNR of the coherence images still decreases concurrently with image quality, the CNR values remain greater than 2.5 even for poor quality images where the raw channel SNR is low. This can be attributed to the sustained level of contrast in the coherence images across all image quality groups. .
The qualitative appearance of a coherence image and also the associated quantitative imaging metrics are highly dependent on the choice of the lag cutoff or M21. The lag cutoff in this study (M=12, 25% of transmit aperture) was chosen empirically and held constant for all images. However, the cutoff to optimize target detectability can vary depending on the intrinsic level of noise in a given data set. In general, increasing M leads to lower SNR and higher contrast, suggesting an optimal M to maximize CNR and target detectability.
The improvements discussed above, however, come at the cost of decreased depth of field and significantly increased computational complexity. Coherence images perform best around the transmit focus and drop off significantly away from it; this is because the coherence is generated based on the transmit beam pattern. For regions away from the transmit focus the isochronous volume tends to be wide and thus leads to low coherence echoes. This drawback can be overcome by using larger F/#s, using multiple transmit foci, or more sophisticated synthetic aperture approaches that are able to retain transmit focus across the field of view29. While computational complexity has been a limiting factor in the past, demonstrations of coherence imaging using GPU and CUDA based implementations have shown real-time capabilities30. Such implementations could eventually allow access to the benefits of SLSC and HSCI with frame rates at par with current B-mode imaging.
This study had a few drawbacks. Firstly, the B-mode images used as the reference were not comparable with state-of-the-art clinical images on commercial scanners. This is because we did not have access to the post-processing filters that are generally used by manufacturers to improve B-mode image quality. Likewise, no post-processing filters were applied to the coherence images thereby facilitating a raw B-mode to raw SLSC/HSCI comparison. Secondly, because this was a pilot study, the patient count was relatively low.
With these caveats, we believe that the trends presented in this data align with the theoretical predictions we well as previous clinical work using coherence imaging techniques. We expect these results to hold true for a larger patient population.
5. Conclusions
We have demonstrated the utility of coherence-based beamforming techniques such as SLSC and HSCI in improving image quality over fundamental and harmonic B-mode in the context of first trimester fetal ultrasound exams. SLSC and HSCI images displayed greater tissue uniformity, improved border delineation, higher contrast (through clutter suppression) and greater conspicuity of structures when compared to their B-mode counterparts. These observable improvements were validated through statistically significant differences in the imaging metrics such as SNR, CNR and contrast. The benefits of SLSC and HSCI were most relevant in poor quality images where clutter noise was abundant. In these cases we measured average contrast improvements of 67% for the fundamental images and 79% for the harmonic ones.
Acknowledgements
This work was supported by the Coulter Foundation and NIH Grant R01-EB013661, NIH Grant R01-EB015506, NIH Grant R01-EB017711-01A1. We also thank Siemens Medical Solution for their in-kind and technical support.
References
- 1.Crowther CA, Kornman L, O’Callaghan S, George K, Furness M, Willson K. Is an ultrasound assessment of gestational age at the first antenatal visit of value? A randomised clinical trial. Brit J Obstet Gynaec. 2000 Jun;107(6):832. doi: 10.1111/j.1471-0528.1999.tb08181.x. [DOI] [PubMed] [Google Scholar]
- 2.Bennett K a, Crane JM, O’Shea P, Lacelle J, Hutchens D, Copel J a. First trimester ultrasound screening is effective in reducing postterm labor induction rates: A randomized controlled trial. Am J Obstet Gynecol. 2004 Apr;190(4):1077–81. doi: 10.1016/j.ajog.2003.09.065. [DOI] [PubMed] [Google Scholar]
- 3.Snijders R, Johnson S. First- trimester ultrasound screening for chromosomal defects. Ultrasound Obstet Gynecol. 1996;(7):216–26. doi: 10.1046/j.1469-0705.1996.07030216.x. [DOI] [PubMed] [Google Scholar]
- 4.Wapner R, Thom E. First-trimester screening for trisomies 21 and 18. N Engl J Med. 2003;349(15):1405–13. doi: 10.1056/NEJMoa025273. [DOI] [PubMed] [Google Scholar]
- 5.Bahado-Singh RO, Wapner R, Thom E, Zachary J, Platt L, Mahoney MJ, et al. Elevated first-trimester nuchal translucency increases the risk of congenital heart defects. Am J Obstet Gynecol. 2005 May;192(5):1357–61. doi: 10.1016/j.ajog.2004.12.086. [DOI] [PubMed] [Google Scholar]
- 6.Carvalho JS, Moscoso G, Tekay A, Campbell S, Thilaganathan B, Shinebourne EA. Clinical impact of first and early second trimester fetal echocardiography on high risk pregnancies. Heart. 2004 Aug 1;90(8):921–6. doi: 10.1136/hrt.2003.015065. [DOI] [PMC free article] [PubMed] [Google Scholar]
- 7.Rasiah SV, Publicover M, Ewer a K, Khan KS, Kilby MD, Zamora J. A systematic review of the accuracy of first-trimester ultrasound examination for detecting major congenital heart disease. Ultrasound Obstet Gynecol. 2006 Jul;28(1):110–6. doi: 10.1002/uog.2803. [DOI] [PubMed] [Google Scholar]
- 8.Lombardi CM, Bellotti M, Fesslova V, Cappellini a. Fetal echocardiography at the time of the nuchal translucency scan. Ultrasound Obstet Gynecol. 2007 Mar;29(3):249–57. doi: 10.1002/uog.3948. [DOI] [PubMed] [Google Scholar]
- 9.Nicolaides KH. Nuchal translucency and other first-trimester sonographic markers of chromosomal abnormalities. Am J Obstet Gynecol. 2004 Jul;191(1):45–67. doi: 10.1016/j.ajog.2004.03.090. [DOI] [PubMed] [Google Scholar]
- 10.Sonek J, Nicolaides K. Additional first-trimester ultrasound markers. Clin Lab Med. Elsevier Ltd. 2010 Sep;30(3):573–92. doi: 10.1016/j.cll.2010.04.004. [DOI] [PubMed] [Google Scholar]
- 11.Paladini D. Sonography in obese and overweight pregnant women: clinical, medicolegal and technical issues. Ultrasound Obstet Gynecol. 2009 Jun;33(6):720–9. doi: 10.1002/uog.6393. [DOI] [PubMed] [Google Scholar]
- 12.Dashe JS, McIntire DD, Twickler DM. Maternal obesity limits the ultrasound evaluation of fetal anatomy. J Ultrasound Med. 2009 Aug;28(8):1025–30. doi: 10.7863/jum.2009.28.8.1025. [DOI] [PubMed] [Google Scholar]
- 13.Khoury FR, Ehrenberg HM, Mercer BM. The impact of maternal obesity on satisfactory detailed anatomic ultrasound image acquisition. J Matern Neonatal Med. 2009 Apr;22(4):337–41. doi: 10.1080/14767050802524586. [DOI] [PubMed] [Google Scholar]
- 14.Wolfe HM, Sokol RJ, Martier SM, Zador IE. Maternal obesity: a potential source of error in sonographic prenatal diagnosis. Obstet Gynecol. 1990;76(3) [PubMed] [Google Scholar]
- 15.Hendler I, Blackwell SC, Bujold E, Treadwell MC, Wolfe HM, Sokol RJ, et al. The impact of maternal obesity on midtrimester sonographic visualization of fetal cardiac and craniospinal structures. Int J Obes. 2004 Dec;28(12):1607–11. doi: 10.1038/sj.ijo.0802759. [DOI] [PubMed] [Google Scholar]
- 16.Lediju MA, Pihl MJ, Dahl JJ, Trahey GE. Quantitative assessment of the magnitude, impact and spatial extent of ultrasonic clutter. Ultrason Imaging. 2008 Jul;30(3):151–68. doi: 10.1177/016173460803000302. [DOI] [PMC free article] [PubMed] [Google Scholar]
- 17.Pinton G, Trahey G, Dahl J. Sources of image degradation in fundamental and harmonic ultrasound imaging: A nonlinear, full-wave, simulation study. IEEE Trans Ultrason Ferroelectr Freq Control. 2011;58(6):1272–83. doi: 10.1109/TUFFC.2011.1938. [DOI] [PMC free article] [PubMed] [Google Scholar]
- 18.Tranquart F, Grenier N, Eder V, Pourcelot L. Clinical use of Ultrasound Tissue Harmonic Imaging. Ultrasound Med Biol. 1999;25(6):889–94. doi: 10.1016/s0301-5629(99)00060-5. [DOI] [PubMed] [Google Scholar]
- 19.Wagner RF, Insana MF, Smith SW. Fundamental correlation lengths of coherent speckle in medical ultrasonic images. IEEE Trans Ultrason Ferroelectr Freq Control. 1988 Jan;35(1):34–44. doi: 10.1109/58.4145. [DOI] [PMC free article] [PubMed] [Google Scholar]
- 20.Hendler I, Blackwell SC, Treadwell MC, Bujold E, Sokol RJ, Sorokin Y. Does advanced ultrasound equipment improve the adequacy of ultrasound visualization of fetal cardiac structures in the obese gravid woman? Am J Obstet Gynecol. 2004 Jun;190(6):1616–9. doi: 10.1016/j.ajog.2004.03.064. discussion 1619-20. [DOI] [PubMed] [Google Scholar]
- 21.Lediju MA, Trahey GE, Byram BC, Dahl JJ. Short-lag spatial coherence of backscattered echoes: imaging characteristics. IEEE Trans Ultrason Ferroelectr Freq Control. 2011 Jul;58(7):1377–88. doi: 10.1109/TUFFC.2011.1957. [DOI] [PMC free article] [PubMed] [Google Scholar]
- 22.Dahl JJ, Hyun D, Lediju M, Trahey GE. Lesion Detectability in Diagnostic Ultrasound with Short-Lag Spatial Coherence Imaging. Ultrason Imaging. 2011;133(2):119–33. doi: 10.1177/016173461103300203. [DOI] [PMC free article] [PubMed] [Google Scholar]
- 23.Jakovljevic M, Trahey GE, Nelson RC, Dahl JJ. In vivo application of short-lag spatial coherence imaging in human liver. Ultrasound Med Biol. 2013 Mar;39(3):534–42. doi: 10.1016/j.ultrasmedbio.2012.09.022. [DOI] [PMC free article] [PubMed] [Google Scholar]
- 24.Bell M, Goswami R, Trahey G. Clutter reduction in echocardiography with short-lag spatial coherence (SLSC) imaging. Biomed Imaging (ISBI); 2012 9th IEEE Int Symp; 2012.pp. 1116–9. [Google Scholar]
- 25.Mallart R, Fink M. The van Cittert-Zernike theorem in pulse echo measurements. J Acoust Soc Am. 2013 May;90 1991. [Google Scholar]
- 26.Dahl J, Jakovljevic M, Pinton GF, Trahey GE. Harmonic Spatial Coherence Imaging: An Ultrasonic Imaging Method Based on Backscatter Coherence. IEEE Trans Ultrason Ferroelectr Freq Control. 2012 Apr;59(4):648–59. doi: 10.1109/TUFFC.2012.2243. [DOI] [PMC free article] [PubMed] [Google Scholar]
- 27.Ashfaq M, Brunke S, Dahl J, Ermert H, Hansen C, Insana M. An ultrasound research interface for a clinical system. IEEE Trans Ultrason Ferroelectr Freq Control. 2006 Oct;53(10):1759–71. doi: 10.1109/tuffc.2006.109. [DOI] [PubMed] [Google Scholar]
- 28.Burckhardt CB. Speckle in ultrasound B-mode scans. IEEE Trans Sonics Ultrason. 1978 Jan;25(1):1–6. [Google Scholar]
- 29.Bottenus N, Byram BC, Dahl JJ, Trahey GE. Synthetic aperture focusing for short-lag spatial coherence imaging. IEEE Trans Ultrason Ferroelectr Freq Control. 2013;60(9):1816–26. doi: 10.1109/TUFFC.2013.2768. [DOI] [PMC free article] [PubMed] [Google Scholar]
- 30.Hyun D, Trahey GE, Dahl JJ. In vivo demonstration of a real-time simultaneous B-mode/spatial coherence GPU-based beamformer; 2013 IEEE Int Ultrason Symp. IEEE; 2013 Jul.pp. 1280–3. [Google Scholar]


