

Abstract
Alaskan Husky encephalopathy (AHE 1) is a fatal brain disease associated with a mutation in SLC19A3.1 (c.624insTTGC, c.625C>A). This gene encodes for a thiamine transporter 2 with a predominately (CNS) central nervous system distribution. Considering that brain is particularly vulnerable to thiamine deficiency because of its reliance on thiamine pyrophosphate (TPP)‐dependent metabolic pathways involved in energy metabolism and neurotransmitter synthesis, we characterized the impact of this mutation on thiamine status, brain bioenergetics and the contribution of oxidative stress to this phenotype. In silico modeling of the mutated transporter indicated a significant loss of alpha‐helices resulting in a more open protein structure suggesting an impaired thiamine transport ability. The cerebral cortex and thalamus of affected dogs were severely deficient in TPP‐dependent enzymes accompanied by decreases in mitochondrial mass and oxidative phosphorylation (OXPHOS) capacity, and increases in oxidative stress. These results along with the behavioral and pathological findings indicate that the phenotype associated with AHE is consistent with a brain‐specific thiamine deficiency, leading to brain mitochondrial dysfunction and increased oxidative stress. While some of the biochemical deficits, neurobehavior and affected brain areas in AHE were shared by Wernicke's and Korsakoff's syndromes, several differences were noted likely arising from a tissue‐specific vs. that from a whole‐body thiamine deficiency.
Keywords: brain, mitochondrial dysfunction, mtDNA deletions, oxidative stress, thiamine deficiency
Introduction
Mitochondrial encephalomyopathies such as Leigh syndrome can be associated with the deficiency of enzymes involved in energy metabolism including complexes I, II, III and IV of the electron transport chain, ATP synthase, pyruvate dehydrogenase (PDH), pyruvate carboxylase as well as mitochondrial DNA mutations 27. While a number of nuclear gene mutations affecting either structural subunits of respiratory chain complexes, factors essential for their assembly 101, or genes involved in mitochondrial DNA (mtDNA) stability 104 have been described as causative of mitochondrial encephalopathies, the majority of the reported mutations occur in the mitochondrial genome, and up to a third of cases have no known etiology 67, 85. In addition to genetic causes, environmental (ie, heavy metals, paraquat and rotenone) as well as gene × environment factors [ie, enhancement of the flame‐retardant BDE‐49 toxicity by a PTEN‐deficient background 69] may also play a crucial role in the onset and development of nonclassic mitochondrial diseases 10, 24, 59, 69.
Thiamine (vitamin B1) is an essential micronutrient for humans and other species. It is obtained mainly from the diet 11 and it is mostly absorbed in the proximal 10 part of the small intestine 89. Thiamine is essential in carbohydrate, amino acid and fatty acid synthesis and metabolism. Thiamine pyrophosphate or diphosphate (TPP), the activated form of thiamine, is an essential cofactor of cytosolic transketolase (TK) that functions in the nonoxidative branch of the pentose phosphate pathway, and for the peroxisomal 2‐hydroxyphytanoyl‐coenzyme A (CoA) lyase 36. The pentose phosphate pathway, in which TK plays a critical role, supplies NADPH (for antioxidant defenses and fatty acid synthesis) and ribose‐5‐phosphate (for ATP and GTP synthesis and nucleic acid synthesis). In mitochondria, TPP is essential for three enzymatic mitochondrial complexes [PDH, branched chain ketoacid dehydrogenase complex and the alpha‐ketoglutarate dehydrogenase (KGDH) complex]. Mitochondria are central to cellular energy production, and critical for sustaining adequate energy levels in highly aerobic organs such as brain 79 and heart 58.
Thiamine deficiency can result from multiple factors including: (i) the presence of anti‐thiamine activity in the diet [eg, fish or fish‐derived products containing thiaminase 25, 50, 106]; (ii) thiamine inactivation by heat and/or sulfur dioxide; (iii) changes in thiamine demand [lactation or pregnancy or increased physical activity not matched by the consumption 25, 64, 94]; and (iv) genetic defects at the level of any of the thiamine transporters (SLC25A19, SLC19A2, SLC19A3) and/or within the thiamine pathway (TPK1, THTPA, ENTPD5). Primary (genetic defect) or secondary have devastating effects across species 15, 22, 39, 75, 76, 88, 97, 103, 108, 116. Insufficient intake of thiamine in humans can cause neurological disorders such as Wernicke's encephalopathy, Wernicke–Korsakoff syndrome 77 and beriberi 82. Thiamine deficiency results in a progressive encephalopathy in both humans and animals 7, 22, 54, 60, 75, 84, 116, characterized by time‐dependent lesions in the brain; however, the distribution and severity of the lesions is species‐dependent. For instance, lesions in thalamus and the caudal colliculi are typical in rats 31, bilaterally symmetrical spongy changes and necrosis of brainstem nuclei in dogs 87, 102, progressive brain atrophy and bilateral thalami and basal ganglia lesions in humans 119, whereas lesions are diffuse in aquatic mammals such as seals 25. Regardless of the species, it is clear that there is a particular vulnerability of the brain because of its reliance on metabolic pathways requiring thiamine for energy metabolism and neurotransmitter synthesis.
Alaskan Husky encephalopathy (AHE) is fatal brain disease in Alaskan Husky (AH) dogs 14, 114. It presents as a multifocal central nervous system deficit with seizures, altered mentation, dysphagia, central blindness, hypermetria, proprioceptive positioning deficits, facial hypoalgesia, ataxia and tetraparesis. AHE has been associated with a novel defect in the solute transporter 19 member 3.1 (SLC19A3.1) included a 4‐base pair insertion and single nucleotide polymorphism in exon 2, predicted to result in a frame shift with premature peptide termination resulting in a truncation of 279 amino acids of the 498 amino acid present in the full‐length protein (c.624insTTGC, c.625C>A) 109. In humans, thiamine metabolism dysfunction syndrome 2 (an autosomal recessive metabolic disorder characterized by encephalopathy, and presenting as confusion, seizures, external ophthalmoplegia and dysphagia) has been associated with mutations in the SLC19A3 gene or thiamine transporter 2 (OMIM #606152) and affected patients show encephalopathies that have clinical and neuropathological similarities to AHE 40, 78. Notably, in the canine genome there is a duplication of SLC19A3 resulting in two paralogs, SLC19A3.1 (43,411,960‐43,419,612 Mb) and SLC19A3.2 (43,363,905‐43,386,983 Mb). SLC19A3.1 shares 84.7% identity and SLC19A3.2 shares 79.9% identity at the amino acid level to the human gene. Maximum gene expression of SLC19A3.1 was observed in cerebrum, cerebellum, spinal cord, kidney and testis, whereas SLC19A3.2 was mainly expressed in liver and kidney 109 suggesting a tissue‐specific expression profile (possibly function) for each paralog in these organs. Recently, a Moroccan family with Leigh syndrome‐like phenotype carrying a c20C>A mutation in SLC19A3 resulting in a pSer7Ter showed negligible thiamine uptake in cells in culture defects in thiamine transport can result in a phenotype resembling a mitochondrial disease 40.
Given that the AHE manifested as a CNS disorder, matching the tissue expression of this transporter [only minor pathological defects were observed in liver, skeletal muscle or fibroblasts 109], we sought to evaluate the biochemical impact of thiamine deficiency on mitochondrial function in brains of affected dogs. AHE provides a unique opportunity to define and characterize the effects of an organ‐ (brain) and region‐specific thiamine deficiency as opposed to an “overall thiamine deficiency” such as that resulting from nutritional deficits. The present study is a biochemical evaluation of a “localized” thiamine deficiency in AHE dogs focusing on the effects on mitochondria and intermediary metabolism in brain.
Materials and Methods
Colony characterization and housing of Alaskan Huskies
Alaskan Husky dogs from a racing kennel in Alaska, with clinical signs suggestive of encephalopathy were examined at the University of California Davis, William R. Pritchard Veterinary Teaching Hospital. Clinical signs included generalized seizures, difficulty walking, difficulty eating, high stepping gait, blindness and ataxia 114. Dogs were euthanized and had immediate necropsy evaluation. The brain was removed and samples from the cerebral cortex and thalamus were immediately frozen in liquid nitrogen. The remainder of the brain was placed into 10% formalin. Neuropathological lesions diagnostic for AHE included bilaterally symmetrical, cavitatory, malacic lesions in the thalamus and smaller malacic lesions in the putamen, claustrum, junctional gray and white matter in the cerebral cortex, in the brainstem and midline cerebellar vermis 14. Affected dogs all had a histological diagnosis of AHE confirmed by a board certified veterinary pathologist (RH). Samples from dogs utilized for this study were part of a previous study described in 109. Brain samples obtained from Alaskan Huskies that died of AHE were included in this study. Control samples of brain were obtained from five adult dogs with a known cause of death unrelated to thiamine deficiency.
Diet and feeding characteristics
Diet included a mix of a proprietary diet made by Caribou Creek Gold (http://www.cariboucreekgold.com/ingredientsblue.htm) supplemented with minerals and vitamins and approved by the Association of American Feed Control Officials (AAFCO). No data on food consumption/animal was available for this study.
Neurological signs in AHE
Details on the phenotype and neurological signs presented by the affected dogs analyzed in this study are shown in Supporting Information Table S1. Clinical manifestations of dogs affected with AHE can be seen in Supporting Information Movies S1 and S2.
Chemicals and biochemicals
All chemicals and biochemicals were of analytical (or higher) grade. Potassium phosphate was purchased from Fisher (Waltham, MA, USA), NAD+ was from Calbiochem (Billerica, MA, USA); all other reagents were from Sigma Chemical Co (St. Louis, MO, USA).
Preparation of brain tissues for enzymatic analyses
Approximately 1–5 mg of wet weight brain was homogenized with a Retsch Mixer Mill MM200 using 3.2 mm stainless steel beads (Alliance Analytical Inc, Menlo Park, CA, USA) in 20 mM HEPES, pH 7.4 supplemented with proteolytic and phosphatase inhibitors (using a wet weight to volume ratio of 1 to 5). Homogenates were then centrifuged at 3000 g at 4°C to remove any residual particulate matter, and the supernatant was used for protein determination and enzymatic activity assays.
Mitochondrial complex and enzymatic activities
Activities of complex I, succinate‐cytochrome c reductase (SCCR), cytochrome c oxidase, complex V (evaluated by following ATPase activity) and citrate synthase were evaluated as previously described in detail 70 using variable amount of brain proteins (2–8 μg). Protein fractions were quantified with BCA Protein Assay Kit, (#23225, Pierce Biotechnology, Rockford, IL, USA).
Biochemical assessment of thiamine deficiency
The most widely used methods to detect thiamine deficiency are the measurement of thiamine content (total or as TMP, TDP or TTP, and TTP) in red blood cells, the TK activation test, and the TK activity assay 8, 25, 29, 93, 113. The last two tests are functional rather than a direct measurement of thiamine status and therefore may be influenced by factors other than thiamine deficiency. These include loss of reactivatable apoenzyme during chronic deficiency in vivo 83, 117, altered binding of apoenzyme and coenzyme because of the presence of isoenzymes of TK 55 and reduced synthesis of apoenzyme in patients with diabetes 37 and liver disease 35, among other technical factors 83. If no appropriate controls are available, these factors may have contributed to the lack of agreement over the upper limit of the reference range for the activation assay, with values ranging from 15.5% to 40% 2, 21. On the other hand, the evaluation of total thiamine content (free and bound as well as all phosphorylated forms) does not take into account the actual fraction incorporated into key enzymes of the metabolism whose inactivation results in the occurrence of symptoms 26, 32, 112. The gold standard method to assess thiamine status is red cell concentration of TDP, the physiologically active form of thiamin. This measure reflects body thiamine stores and, in a variety of studies, has been correlated with TK functional testing 6, 105. Thus, in this study, we proceeded to evaluate total TK and PDH activities as TPP‐dependent enzymes located in the cytosol and mitochondrial compartments as surrogate markers of thiamine deficiency. TK activity was measured as previously described 25. Briefly, the reaction mixture contained 1.6 mM xylulose 5‐phosphate, 1.7 mM ribose‐5‐phosphate, 3 mM MgCl2, 20 units α‐GDH/TPI and 100 mM Tris, pH 7.6. The assay was performed at 37°C. Then 50‐μg protein was added, and the reaction was started by adding 0.2 mM NADH, and followed for 30 minutes. The decrease in absorbance resulting from the oxidation of NADH was recorded at 340 nm. The change in slope/minute was taken in the linear range, which was from 10 to 25 minutes. An INT‐coupled assay was used to measure PDH activity 49, 100. The reaction mixture contained 4 μM rotenone, 6.5 μM phenazine methasulfate, 0.1 mM coenzyme A, 0.6 mM INT, 1 mM MgCl2, 2.5 mM NAD+, 3 mM α‐keto‐β‐methylvalerate, 5 mM pyruvate, 25 mM oxamate, 0.1% Triton, 0.1% BSA, 50 mM potassium phosphate buffer, pH 7.8. The reaction was started by adding 20 μg protein. The absorbance was recorded at 500 nm in the presence or absence of 5 mM 3‐fluoropyruvate, an inhibitor of PDH, at 25°C for 15 minutes. The change in absorbance/minute was taken in the linear range, which was from 5 to 15 minutes. The difference between the slopes/minute without and with inhibitor was taken as specific for PDH activity. All enzymatic measurements were performed in a Tecan Infinite M200 microplate reader and the final volume for all the reactions was 200 μL. The specific activities of TK and PDH were evaluated with and without the addition of a saturating amount of TPP. The specific activities were expressed as units/mg protein [where 1 unit = 1 nmol product × (minute)−1]. The saturating concentration of TPP and PDH for each brain tissue was obtained by adding TPP from 0.5 to 20 mM until the V max was obtained.
mtDNA copy number per cell and mtDNA deletions
Mitochondrial DNA copy number and deletions were evaluated as described before 70. Genomic DNA was extracted from 5–10 mg frozen tissue using the Gentra Puregene Cell and Tissue Kit (Qiagen #158388, Redwood City, CA, USA) following the manufacturer's recommendations. Concentration and purity of DNA was evaluated at 260 nm and 280 nm using the Tecan i‐control 1.6 software (v. 1.6.19.2) on a Tecan infinite M200 Nanoquant (Tecan, San Jose, CA, USA). A ratio of 1.8 to 2.0 was taken as “pure” DNA 98, otherwise a subsequent extraction was preformed. Average yield of DNA was 0.4–0.8 μg/mg of wet tissue weight. Following DNA extraction, changes in mtDNA copy number were evaluated by quantitative polymerase chain reaction (qPCR) using dual labeled probes. The gene copy number of CYTB, ND1 and ND4 were normalized to a single copy nuclear gene APP [amyloid beta (A4) precursor protein]. Because minor changes in the efficiency of the amplification of each gene can result in large changes in the ratio of mtDNA/nDNA, the mitochondrial primers were designed for regions of low polymorphisms (less than 1%). Species‐specific primers were selected using the Primer Express 3 software (Applied Biosystems, Carlsbad, CA, USA). Canine primers for APP were forward 5'‐ GGTGTTGTCATAGCAACAGTGATTG‐3’; reverse 5'‐ACCGTGATGAATGGACGTGTAC‐3’; primers for CYTB were: forward 5'‐GGACAAAGCAACCCTAACACGA‐3’; reverse 5'‐CTATTGCTAGAGCTGCGATGATG‐3’. Primers for ND1 were: forward 5'‐ CTTGGGAGTCCTATTCATACTAGCAA‐3’; reverse 5'‐GGGCGTATTTGGAGTTTGAGG‐3’; primers for ND4 were: forward 5'‐ TCTATGAGGCATAATCATAACAAGCTC‐3’; reverse 5'‐AACTGAGGAGTATGCAATTAGGGATT‐3’. The probes used were from Roche (Indianapolis, IN, USA) UPL library, Locked Nucleic Acids, short hydrolysis probes, labeled at the 5’ end with fluorescein and at the 3’ end with a dark quencher dye (#9 for APP, cat no: 04685075001; #88 for CYTB, cat no: 04689135001; #58 for ND1, cat no: 04688554001; #94 for ND4, cat no: 04692110001). PCR products encoding for CYTB, ND4, ND1 and APP were run on a gel and visualized using ethidium bromide. The experimental sizes were consistent with the expected ones [74 bp (CYTB), 79 bp (ND4), 89 bp (ND1), and 78 bp (APP); Supporting Information Figure S1]. Specificity of each primer pair was confirmed by sequencing all amplified PCR products (UC DNA Sequencing Facility, UC Davis, CA, USA; Supporting Information Table S3). The qPCR was performed on a Mastercycler EP Realplex thermocycler (Eppendorf, Westbury, NY, USA). qPCR was performed in a 96‐well PCR plate with Taqman Universal PCR Master Mix (Applied Biosystems, cat no. 4304437) with 400 nM of each primer, and 5 μL (3.13 ng) of template DNA per reaction. Putative dilution bias was tested by running the assay at six different dilutions (0.78, 1.56, 3.13, 6.25, 12.5 and 25 ng) without obtaining changes in the final outcome. Primer efficiencies for each gene were: 97% (ND4), 98% (ND1), 97% (CYTB) and 98% (APP). Amplification was performed using the following cycling conditions: 2 minutes at 50°C, 10 minutes at 95°C and 40 cycles of 15 s at 95°C and 60 s at 60°C. The mean cycle time, obtained by double derivatives (CalqPlex algorithm; Eppendorf, Westbury, NY, USA), was designated as Ct. Relative mtDNA/nDNA was assessed by the comparative Ct method using the following equation: mtDNA/nDNA = 2−ΔCt, where ΔCt = Ctmitochondrial‐ Ctnuclear. Each sample was analyzed in triplicate with an average coefficient of variation (CV) between 0.34% and 0.45%.
Detection of mtDNA large‐scale deletions by long‐range PCR
To detect for large‐scale deletions in mtDNA, the segment located between CYTB and ND1, covering for 11.7 kbp of the 16.7 kbp, was amplified with the following primers: forward 5'‐CTTGGGAGTCCTATTCATACTAGCAA‐3’ and reverse 5'‐CTATTGCTAGAGCTGCGATGATG‐3’. Long‐range PCR amplification was done using the Advantage 2 Polymerase Mix from Clontech (Mountain View, CA, USA) with Titanium Taq. Reaction mixture was constituted by 5 μL of 10× Advantage 2 Buffer, 2 μL of 10 mM dNTP mix (Sigma), 1 μL of 50x Advantage 2 polymerase Mix, 1 μL of 10 μM forward and reverse primers, 20 μL of sample with 50 ng total DNA, and 20 μL of nuclease‐free water. Cycling conditions were the following: 95°C for 1 minute, 30 cycles of 95°C for 30 s and 68°C for 12 minutes, final elongation at 68°C for 12 minutes and indefinite hold step at 4°C. Five μL of the PCR products and a 1 kb DNA ladder (New England Biolabs, cat #N3232L, Ipswich, MA, USA) were run on a 0.8% agarose gel and visualized with ethidium bromide (Supporting Information Figure S3).
Western blotting
All western blot procedures were performed essentially as described before 33, 65 with the modifications indicated below. Protein extracts from brain sample homogenates were concentrated and partly dilapidated by acetone precipitation, through the addition of four volumes of −20°C acetone to each homogenate. Acetone‐containing mixtures were vortexed and placed at −20°C for 24 h. Samples were then centrifuged at 16 000 × g for 10 minutes at 4°C. After pouring off the supernatant, the pellet was resuspended and washed two more times with −20°C acetone, spinning each wash at 16 000 × g for 10 minutes at 4°C. After removing the supernatant from the final wash, the samples were placed in the SpeedVac for 15 minutes to remove residual acetone. Samples were resuspended in RIPA buffer (25 mM MOPS, 150 mM NaCl, 1 mM EDTA, 1% NP‐40, 0.1% SDS, 1% DOC, pH 7.5) and the protein concentration was evaluated using a BCA Protein assay kit (Pierce #23227, Rockford, IL, USA). Proteins from brain were denatured in SDS‐PAGE sample buffer (BioRad, Hercules, CA, USA) plus 1.5% DTT at 100°C for 3 minutes. For protein normalization, increasing amounts of total cell protein (2–10 μg) were added to successive lanes in the SDS‐PAGE, transferred to membranes, and probed with specific antibodies to nitrotyrosine (Millipore, Bedford, MA, USA) and complex V F1 alpha‐ and beta‐subunits (BD Biosciences, San Jose, CA, USA). The loaded protein amounts were plotted against the densitometry readings to ensure that the ECL response was within a linear range of the protein range. All values were normalized to actin or VDAC1 as a loading control. Membranes were visualized with chemiluminescent reagents on a Kodak (Newark, NJ, USA) 2000MM Imager. Images were analyzed with the Kodak Imager 2000MM software provided by the manufacturer.
Protein determination
Protein evaluation in liver and brain samples was performed with the Pierce BCA protein assay (Thermo Scientific, Waltham, MA, USA).
Molecular modeling
The 3D structure of the thiamine transporter was obtained through modeling of the primary sequences of the WT and mutant transporter proteins 95, 120 as indicated before 38. Modeling of native and mutant protein structures for the transporter was performed with I‐TASSER 96. The 3D structure was further refined by using ChemDraw. All pdb files were visualized using PyMol 1.4.1 99.
Statistical analysis
Summary statistics were expressed as mean ± SEM (95% confidence intervals). Individual values are shown in the Supporting Information Table S2. Data were obtained from triplicates run on different days. Statistical analysis was performed by using the analysis of variance (ANOVA) followed by the Bonferroni's post‐test for multiple comparisons and considering P < 0.05 as statistically significant. A G‐power analysis has been computed for each outcome with the use of the G Power 3.1 software (http://gpower.software.informer.com/3.1/). For all the outcomes tested, the calculated power was ≥ 0.950.
Results
Thiamine transporter protein structure is significantly affected by mutation and truncation of primary sequence
Modeling of the primary sequence for the native protein resulted in a 3D structure consistent with the function of a transporter (∼12 transmembrane helices; Figure 1A,C). The novel SLC19A3.1 defect in AHE‐affected dogs included a 4‐base pair insertion and single nucleotide polymorphism in exon 2, predicted to result in a frame shift with premature peptide termination resulting in a truncation of 279 amino acids of the 498 amino acid present in the full‐length protein (c.624insTTGC, c.625C>A) 109. Modeling of the protein structure of the mutant transporter was significantly affected, with almost half of the helices lost because of the truncation (Figure 1B,D). However, the remaining helices did maintain some of the original structure suggesting that a limited binding/transport of thiamine might still be possible, probably with a lower affinity.
Figure 1.
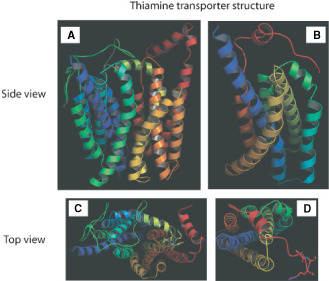
3D structure of thiamine transporter. The models were obtained by using I‐TASSER and further refinement by ChemDraw. The TM‐score was 0.51 ± 0.15 and RMSD was 11.4 ± 4.5 Å for WT transporter. Native (A and C) and mutant (B, D) conformation. A and B. Side view of the transporter. C and D: top view of the model with thiamine bound to them shown in sticks.
Thiamine deficiency in brain regions from AHE‐affected dogs
Based on the tertiary structure predictions, it was hypothesized that the defective SLC19A3.1 may lead to defective thiamine transport ensuing in thiamine deficiency. As thiamine deficiency reduces the activities of TPP‐dependent enzymes throughout the brain 16, 41 and, both, protein and gene expression of SLC19A3.1 are highest in CNS, the activity of two TPP‐dependent enzymes, namely (cytosolic) TK and (mitochondrial) PDH were evaluated, as functional markers of thiamine deficiency [see methods 29, 30], in cerebral cortex and thalamus of affected dogs and in cortex of control dogs. Because of the unavailability of thalamus from control dogs, and based on the similarities in biochemical and mitochondrial outcomes for thalamus and cortex reported for other species 28, 57, 118, comparisons were performed among these three groups.
The mean TK specific activity in thalamus of affected dogs was 83% of controls (Table 1). In cortex of affected dogs, TK activity was 31% and 30% of control values (P < 0.01), indicating a more profound effect in the cytosol of cortex vs. thalamus (∼3‐fold; Table 1). Mean specific activities of TK in both brain regions were lower in affected dogs relative to controls; however, they did not show an improvement in activity upon addition of saturating levels of TPP. This apparent discrepancy between the relatively negligible effect of TPP supplementation on enzymatic activity can be bridged considering that there is an increased breakdown of TK after conversion to the apoform 52 explaining the loss of reactivatable apoenzyme as it has been described in cases of chronic thiamine deficiency in vivo 83, 117.
Table 1.
TK and PDH activities in AHE‐affected dog brains.*
| Brain region | Enzymatic activity (expressed as mean ± SEM) nmol × (minute × mg protein)−1 | |||
|---|---|---|---|---|
| Transketolase | PDH | |||
| −TPP | +20 mM TPP | −TPP | +20 mM TPP | |
| Control (n = 4) | 142 ± 1 | 161 ± 6 | 42 ± 4 | 44 ± 4 |
| 95% CI | [140–145] | [149–172] | [34–50] | [36–52] |
| Affected thalamus (n = 2) | 118 ± 17 | 124 ± 10 | 15 ± 2 | 18 ± 2 |
| P‐value | — | <0.05 | <0.05 | <0.05 |
| Affected cortex (n = 2) | 44 ± 11 | 49 ± 9 | 23 ± 2 | 26 ± 3 |
| P‐value | <0.01 | <0.01 | <0.01 | — |
*Numbers in bold were < 95% CI (numbers between brackets represent control 95% CI). P‐values are reported for statistically significant differences between affected thalamus or cortex and controls and were obtained with the ANOVA followed by Bonferroni's post‐test for multiple comparisons.
Consistent with the results on TK activity, the mean PDH activity for the affected group in both cortex and thalamus was lower than controls regardless of TPP supplementation (Table 1). The activity of PDH in thalamus of affected dogs was 36% (without TPP) and 41% (with TPP) of control values (P < 0.05 in both cases). Similar deficits in PDH activity were observed in cortex of affected dogs (55% without TPP and 59% with TPP of control values). To ascertain whether the decreases in PDH activity were the result of lower specific activity or lower mitochondrial mass, citrate synthase activity was assessed 42, 69. The activity of citrate synthase, which is indicative of mitochondrial mass and integrity, was also significantly lower in both cortex and thalamus of affected cases (cortex: 67% and thalamus: 66%; Table 2). Our results indicated that while both brain regions from affected dogs presented lower mitochondrial mass, the decreases in PDH activity in cortex from affected dogs were ascribed to decreases in mitochondrial mass (55% to 59% of control PDH vs. 67% citrate synthase activity of controls), whereas the decrease in PDH activity in thalamus was the result of a combination of both lower specific activity and decreased mitochondrial mass (35% to 41% of control PDH vs. 66% of citrate synthase activity).
Table 2.
Mitochondrial outcomes in AHE‐affected dog brain.*
| Brain region | Mitochondrial activities (expressed as mean ± SEM) | ||||
|---|---|---|---|---|---|
| Complex I | Complex II–III | Complex IV | Complex V | Citrate synthase | |
| Control (n = 5) | 11 ± 2 | 14 ± 2 | 15 ± 1 | 48 ± 2 | 214 ± 8 |
| Affected Cortex (n = 3) | 9 ± 1 | 9 ± 3 | 8.7 ± 0.5 | 21 ± 3 | 143 ± 18 |
| P‐value | — | — | — | <0.01 | <0.05 |
| Affected Thalamus (n = 3) | 11 ± 1 | 10 ± 4 | 6.3 ± 0.8 | 24 ± 8 | 141 ± 35 |
| P‐value | — | — | <0.01 | <0.01 | <0.05 |
*Complex I, complex II–III, complex IV and complex V were expressed as nmol of reduced quinone produced × (minute × mg protein)−1, nmol of reduced cytochrome c × (minute × mg protein)−1, nmol cytochrome c oxidized × (minute × mg protein)−1, nmol ATP hydrolyzed × (minute × mg protein)−1, respectively. Complex II‐III activities were evaluated by the succinate‐cytochrome c reductase activity. Citrate synthase activity wasute expressed as nmol product × (minute × mg protein)−1. P‐values are reported for statistically significant differences between affected thalamus or cortex and controls and were obtained with the ANOVA followed by Bonferroni's post‐test for multiple comparisons.
Taken these results together, they indicate that in both brain regions of affected dogs, cortex and thalamus, PDH and TK activities were lower than controls suggesting a common mechanism. In thalamus of affected dogs, PDH activity (mitochondria) was ∼2‐fold more affected than TK (cytosol) suggesting mitochondria as a major target in this tissue. In cortex of affected dogs, while both PDH and TK activities were also significantly lower than controls, the decreases in TK activities were more marked than those observed in thalamus (∼2.6‐times lower). The PDH activity was less affected than TK activity within this tissue and also when compared with PDH activity from cortex of affected dogs (∼2‐fold; Table 1). Thus, cortex from affected dogs exhibited enzymatic deficits in cytosol and mitochondria, whereas thalamus seemed to be mainly affected at the mitochondrial level.
Deficiencies in mitochondrial activities in brain from AHE‐affected dogs
To test the effect of the presence of the mutated thiamine transporter on bioenergetics, activities of each individual complex of the electron transport chain were evaluated in thalamus and cortex of affected dogs and in cortex of control dogs (Table 2 and Supporting Information Table S2). The activities of cytochrome c oxidase (complex IV) and ATPase (complex V) in cortex from affected dogs were 58% and 44% of control values. In thalamus from affected dogs, the activities of complexes IV and V were 42% and 50% of control values, similar to those observed in cortex. No statistical differences were observed in the mean activities of complex I or II–III between affected cases and controls, although values for complex II–III in dog 1 (cortex) and dog 3 (cortex and thalamus) were outside of the 95% confidence interval (CI) calculated with control values. To differentiate between changes in mitochondrial mass vs. decline in specific respiratory chain Complexes, all activities were normalized by citrate synthase activity (Table 3). In cortex, complex V activity was 66% of controls whereas in thalamus both complexes V and IV were decreased (76% and 64% of controls, respectively; Table 3). Thus, brain of affected dogs showed lower specific activities of complexes IV (thalamus) and V (thalamus and cortex). However, based on complex IV activities (normalized by citrate synthase), thalamus seemed more compromised (1.4‐fold) than cortex in affected dogs. This finding is consistent with the PDH activities whose deficits were more pronounced in thalamus than cortex (vide supra). Of note, none of these complex deficits constituted a criteria for a mitochondrial respiratory chain disorder diagnosis for humans because they were above the threshold level [≤30% of control values 12].
Table 3.
Brain mitochondrial complexes normalized to citrate synthase in AHE‐affected dog brain.*
| Brain region | Activities normalized to citrate synthase (×1000) | |||
|---|---|---|---|---|
| Complex I | Complex II–III | Complex IV | Complex V | |
| Control (n = 5) | 51 ± 8 | 65 ± 8 | 70 ± 4 | 224 ± 10 |
| % CI | [35–67] | [49–81] | [62–78] | [204–244] |
| Affected cortex (n = 3) | 63 ± 9 | 63 ± 19 | 61 ± 7 | 147 ± 24 |
| Affected thalamus (n = 3) | 78 ± 18 | 71 ± 29 | 45 ± 11 | 170 ± 61 |
*Values taken from Table 2. Numbers are shown as mean ± SEM of the ratios between individual complexes and CS. Values in bold are <95% CI (numbers between brackets represent control 95% CI).
Increased oxidative/nitrative stress in brain from AHE‐affected dogs
Considering that TK is an enzyme of the pentose phosphate pathway, and one of the functions of this pathway is to provide NADPH to sustain antioxidant defenses, we tested whether increased oxidative/nitrative damage was observed in the brain regions of affected dogs. To this end, we evaluated tyrosine (Tyr) nitration in complex V in cortex and thalamus because nitration of Tyr345 and Tyr368 in the beta‐subunit of ATPase (ATPB) impairs significantly its activity 38, 47. The content of (nitrotyrosine)/(ATPB) in affected brain was 2.4‐fold that of control values (average of cortex and thalamus; Table 4). These results indicated that in affected brains, there is an increased protein nitration because of an increased oxidative/nitrative stress, not necessarily proportional to TK activities but still increased with TK deficits. It is likely that the decline in complex V activity in both brain regions is partly caused by increased ATPB Tyr nitration as observed before 38, 47. These results are also supported by the lack of changes in protein expression of the two most abundant subunits of complex V, namely the F1 alpha and ATPB of the ATPase (Figure 2 and Supporting Information Figure S2).
Table 4.
Nitrated ATPase and mtDNA deletions in AHE‐affected dog brain.*
| Brain region | Mitochondrial outcome (expressed as mean ± SEM) | ||
|---|---|---|---|
| Nitrotyrosine | mtDNA copy number | mtDNA deletions | |
| Control (n = 5) | 102 ± 30 | 1383 ± 75 | 1.00 ± 0.04 |
| Affected cortex (n = 3) | 220 ± 20 | 1496 ± 28 | 0.84 ± 0.06 |
| P‐value | — | — | — |
| Affected thalamus (n = 3) | 350 ± 40 | 991 ± 101 | 0.88 ± 0.14 |
| P‐value | <0.01 | 0.05 | — |
*The nitrotyrosine content of ATP5B was estimated as the optical density of the nitrated band normalized to that of ATP5B. The mtDNA copy number was estimated by using the mtDNA/nDNA gene copy ratios determined in genomic DNA extracted from each brain region of each patient. The mtDNA deletions shown in this Table correspond to those observed by qPCR in the segment encoding for ND4. Outcomes for each dog are provided under Supporting Information Table S2. For more experimental details, see Materials and Methods Section. P‐values are reported for statistically significant differences between affected thalamus or cortex and controls and were obtained with the ANOVA followed by Bonferroni's post‐test for multiple comparisons.
Figure 2.
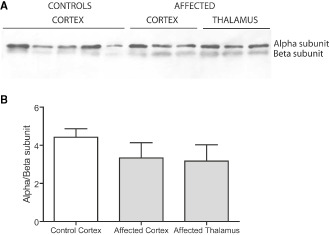
Expression level of ATPase alpha and beta‐subunits in brain. A. Protein samples from cortex controls (n = 5) and cortex and thalamus patients (n = 3) were run on a 12% SDS‐PAGE. The samples were blotted to membranes and probed for ATPase F 1 alpha and beta‐subunits. Representative, images of full membranes for both ATPase subunits are shown in Supporting Information Figure S2. B. The optical density for each band from A was determined using the software provided by the manufacturer of Kodak2000MM and densitometry was obtained with the use of the Carestream software. The ratios were obtained for both controls and patients, and the mean ± SEM were plotted as a bar graph. No statistical differences were found between each of the two analyzed brain region and controls.
Thalamus from AHE‐affected dogs presented a significant lower mtDNA copy number/cell (72% of controls; Table 4). The decreases in mtDNA copy number/cell (∼30%) were less pronounced than those observed for citrate synthase (∼2‐fold) suggesting that the decreases in mtDNA copy number were independent of the decreases in mitochondrial mass. Mitochondrial DNA microdeletions, marker for increased DNA oxidative damage, were detected in the segment encoding for ND4 in cortex and/or thalamus of the most severely affected dogs (2 and 3; Table 4 and Supporting Information Table S2), with no detectable deletions in the CYTB gene. Large‐scale single or multiple deletions of mtDNA in brain regions from affected dogs were excluded using long‐range PCR methodology 111 (Supporting Information Figure S3). Taken together, these results indicated that brain regions from affected dogs showed increased oxidative stress‐mediated damage probably resulting from a combination of lower antioxidant capacity (pentose phosphate shunt) and higher mitochondrial reactive oxygen species production by a defective electron transport chain.
Discussion
In this study, we analyzed the biochemical changes in brain bioenergetics of Alaskan Huskies affected with AHE. Dogs with AHE presented central nervous system deficits 109 including, but not limited to, central blindness, proprioceptive positioning deficits, ataxia and tetraparesis (Supporting Information Movies S1 and S2). Considering that the dogs developed clinical signs similar to thiamine deficiency and that after euthanasia their brains had severe enzymatic deficiencies in TPP‐dependent enzymes, it is likely that the progression of the neurological disease that culminated in death was caused by a localized thiamine deficiency originated by the presence a loss‐of‐function mutation in SLC19A3.1, gene encoding for a thiamine transporter.
Several studies have indicated a number of symptoms during sub‐lethal thiamine deficiency, including appetite loss or anorexia 25, memory and learning deficits 62, 63, 92, lethargy 34, immune suppression 34 and damage to the blood–brain barrier 20, 46. However, these early signs are not pathognomonic of thiamine deficiency and they may be overlooked when a well‐balanced diet is provided 25 without considering genetic susceptibilities to this deficiency 40, 78.
Thiamine is a water‐soluble vitamin with a 9‐ to 18‐day half‐life, so a regular dietary supply is important 66. In humans, the daily requirement for thiamine in infancy and childhood is relatively high and its body stores are limited. For its efficient extraction from foods, the vitamin is absorbed in the intestine and transported inside the cells by high‐affinity thiamine transporters encoded by the SLC19A2 and SLC19A3 genes. Within the cell, thiamine is converted to TPP by the cytoplasmic enzyme thiamine pyrophosphokinase (TPK1) and is transported to the mitochondria by a dedicated transporter, encoded by SLC25A19, in exchange for thiamine monophosphate. Thus, mitochondrial TPP content is dependent on the cytosolic availability of this vitamin, and according to the results presented in this study, brain mitochondria represent a very sensitive target for this deficiency (Figure 3).
Figure 3.
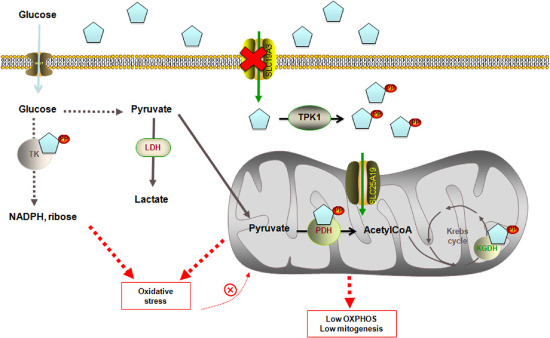
Molecular network linking a defective thiamine transporter 2 to increased ROS production and defective OXPHOS. Thiamine is absorbed in the intestine and transported by high‐affinity thiamine transporters encoded by the SLC19A2 and SLC19A3 genes inside the cell, where it is converted to thiamine pyrophosphate (TPP) by the cytoplasmic enzyme thiamine pyrophosphokinase (TPK1). Within the cytosol, TPP acts as a cofactor for transketolase (TK), enzyme of the pentose phosphate pathway providing reducing equivalents in the form of NADPH to sustain fatty acid synthesis and antioxidant defenses (such as glutathione peroxide‐reductase system) and ribose‐5P, essential precursor in the biosynthesis of nucleotides. TPP is also transported inside the mitochondria by a dedicated transporter, encoded by SLC25A19. Within the mitochondria, TPP acts as a coenzyme for both PDH, in the conversion of pyruvate into acetyl‐CoA, feeding the Krebs cycle, and for α‐ketoglutarate dehydrogenase (KGDH), a highly regulated enzyme that catalyzes the conversion of α‐ketoglutarate to succinyl‐CoA, producing NADH and providing electrons for OXPHOS and for branched‐chain amino acid dehydrogenase (not shown). Defective transport of thiamine inside the cells, caused by a mutation of SLC19A3.1, will eventually lead to (i) increased oxidative stress, caused by both decreased synthesis of NADPH (one of the major players involved in the protection against ROS toxicity) and defective ETC‐dependent increased ROS production; (ii) lower OXPHOS, caused by lower PDH activity, defective entry to Krebs cycle and decreased NADH levels; and (iii) lower mitochondrial mass, probably caused by increased autophagy/mitophagy (activated by increased oxidative stress, not accompanied by increased mitochondrial biogenesis) in an effort to clear damaged mitochondria.
Our findings are supported by previous studies on patients with Leigh's syndrome 40 and mitochondrial encephalopathy 78, both of which have shown to be linked to thiamine transporter‐2 defects and to be characterized by lesions in the cortex, basal ganglia and thalamus. Furthermore, thiamine treatment effectively alleviates the symptoms of individuals with Wernicke's‐like encephalopathy (MIM 606152), a syndrome caused by SLCA19A3 mutations and characterized by acute onset of epilepsy, ataxia, nystagmus and ophthalmoplegia in the second decade of life, a phenotype that resembles the affected dogs’ clinical presentation more so than the rodent model of thiamine deficiency (Table 5). Despite the behavioral similarities between AHE and Wernicke's encephalopathy and Korsakoff's psychosis (Table 5), several other symptoms (as well as affected brain areas; Table 6) seem different in AHE‐affected dogs (no signs of apnea, bradycardia, among others; Table 5), suggesting species‐specific differences or to the model of thiamine deficiency (organ‐specific thiamine deficiency in AHE vs. generalized as in the rodent and human models).
Table 5.
Behavioral symptoms of thiamine deficiency in AHE‐affected dogs, humans and murine model of thiamine deficiency.*
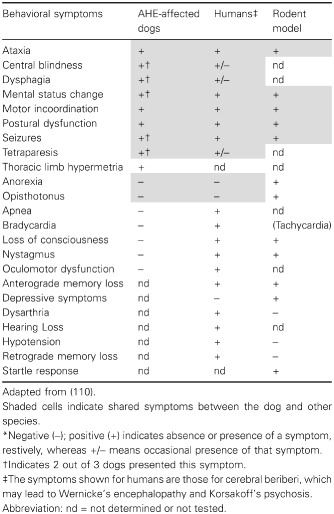
Table 6.
Comparison of brain pathology between AHE‐affected dogs and, human and murine models of thiamine deficiency.*
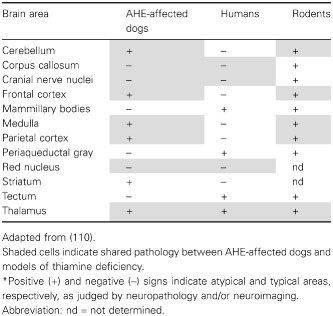
Although no thalamic tissue was available from controls dogs, the comparison between cortex and thalamus should still be valid because (i) no differences in PDHC activity or TK distribution were observed in frontal cortex and thalamus from humans or rodents 29, 57 and (ii) expression data on key mitochondrial proteins (ie, citrate synthase, index of mitochondrial mass, NADH dehydrogenase (ubiquinone) Fe‐S protein 4, cytochrome c oxidase subunit IV, ATP synthase beta‐subunit) from the gene portal BioGPS 118 reported no differences among these CNS areas. A second consideration is that, by using whole tissue lysates, the information on brain‐specific contributions of glia and neurons 4, 51 is no longer available. Although glia‐to‐neuron ratio of thalamus is different from that in cortex, at least in humans [1:1 for cortex and as high as 17:1 for thalamus, respectively; 4], with a higher glia‐to‐neuron ratio in larger animals’ brains 51, not much variation has been shown in the number of neurons per mm2 across species 51, possibly making the contribution of the glia less significant in smaller animals (ie, dogs). In the context of TD, both neurons and astrocytes have been identified as targets for this deficiency 44, 48, 115 thus de‐emphasizing a putative cell‐specific effect. Accordingly, the more severe outcomes observed in thalamus of affected dogs are likely to be ascribed to a tissue‐specific distribution of the SLC19A3.1 transporter rather than to the glia‐to‐neuron ratio.
The phenotype associated with AHE, mainly reflected as an encephalopathy, stems from the relatively high gene expression of canine SLC19A3.1 in cerebellum, spinal cord and cerebral cortex 109, pointing at a very specific and possibly unique function. In humans, high expression of SLC19A3 RNA in thalamus has been linked to the selective lesions in this tissue displayed by MRI of individuals with mutations in this gene 56, 119. However, other factors might contribute to the morbidity of this phenotype. Brain is more sensitive to thiamine deficiency than other organs (such as liver or muscle) where more thiamine reserves are normally present (thiamine content of brain to liver = 2–3‐fold 5, 9, 28; and even these reserves seem to last only 20 days 40; indeed, severe thiamine deficiency manifests as a phenotype more consistent with an encephalopathy rather than a liver disease 40, 75, 78, 91. In addition, recent advances in thiamine biochemistry indicate that TPP may not be the only active form of thiamine 13, 37, 72 explaining some of the tissue‐specific symptoms observed in thiamine deficiency (eg, anorexia). Finally, brain requires a continuous supply of thiamine because the blood–brain barrier transport of thiamine occurs mainly as a saturable process. Saturable uptake of thiamine occurs at a rate of 0.3 pg × (h × g brain tissue)−1 43, a rate similar to that calculated for thiamine turnover in brain 90 suggesting that a fully functioning thiamine transport may be just sufficient to maintain normal brain requirements. Thus, in front of a primary or secondary thiamine deficiency, the transport of this cofactor could be severely affected, and the ensuing metabolic changes will be more severe in brain regions such as thalamus (with high expression of SLC19A3) that are destined to manifest neuronal cell loss in thiamine deficiency 17, 45, 80, 107.
Given that the dog diet was supplemented with both vitamins and minerals, and as such, it had adequate amounts of thiamine, then the deficiency observed in TPP‐dependent enzymes is consistent with the genetic origin of this disorder identified in the transporter SLC19A3.1. Moreover, defects at the SLC19A2 (located mainly in the GI tract, resembling the tissue distribution of the other canine paralog transporter SLC19A3.2) result in megaloblastic anemia, diabetes mellitus and sensorineural deafness 74, symptoms not observed in AHE‐affected dogs. Considering that a mitochondrial enzyme (PDH) as well as a cytosolic one (TK) (both TPP‐dependent) presented decreased activities in the affected dogs, the defective mitochondrial thiamine transporter (SLC25A19) may have affected functionally SLC19A3 because of nonsaturating concentrations of cytosolic thiamine, resulting in a phenotype that resembles more a double KO model. While the biochemical outcomes observed in AHE suggest that deterioration of brain energy status [that particularly affects brain because of its high dependence on oxidative phosphorylation (OXPHOS) for their ATP supply 3, 23, 73, 86], and impaired de novo synthesis of Krebs cycle‐associated neurotransmitter amino acids [ie, glutamate, asparatate and GABA 18, 71] were likely to start the chain of detrimental events, other processes likely contributed to AHE morbidity. Among them are increased oxidative stress, decreased mitochondrial mass and mtDNA depletion. Increases in oxidative stress can be explained by a lower supply of NADPH resulting from lower TK activity [Figure 3; 25]. The increased oxidative/nitrative stress, evaluated as increases in nitrotyrosine and mtDNA deletions, would be expected to add to the progression of symptoms of AHE as observed in other cases of thiamine deficiency 19, 20, 25, by inactivating other targets such as aconitase 53. The lower mitochondrial mass (as judged by lower citrate synthase activity) might indicate an increased autophagy/mitophagy (activated by increased oxidative stress, not matched by increases in mitochondrial biogenesis) in an effort to clear damaged mitochondria 68. The lower mtDNA copy number observed in thalami of affected dogs could be the result of nucleotide pool imbalances between the cytosol (resulting from a defective pentose phosphate pathway) and mitochondria, which are critical for both mtDNA replication 1, 81 and synthesis of mtDNA‐encoded subunits. Indeed, brains of mutant mice with thymidine phosphorylase deficiency showed elevated mitochondrial dTTP and developed partial depletion of mtDNA, deficiencies of respiratory chain complexes and encephalopathy 61.
Conflict of Interest
The authors declare that they have no conflict of interest.
Supporting information
Figure S1. PCR Products from segments encoding for ND1, ND4, CYTB and APP. Genomic DNA was extracted from 5–10 mg frozen tissue. Details on tissue extraction, primers and running conditions are shown under Methods. PCR products encoding for CYTB, ND4, ND1 and APP were run on a gel and visualized using ethidium bromide. The experimental sizes were consistent with the expected ones [74 bp (CYTB), 79 bp (ND4), 89 bp (ND1) and 78 bp (APP)]. Specificity of each primer pair was confirmed by sequencing all amplified PCR products (Supporting Information Table S3).
Figure S2. Representative images of ATPase alpha‐ and beta‐subunits protein levels from cortex and thalamus of controls and affected dogs. Samples preparation and Western blotting conditions are described under Methods. Densitometry analysis results are shown in Figure 2.
Figure S3. Long‐range PCR of mtDNA to detect large‐scale deletions. Representative gel image showing the segment located between CYTB and ND1, covering for 11.7 kbp of the 16.7 kbp. Five μL of the PCR products and a 1 kb DNA ladder (New England Biolabs, cat # N3232L) were run on a 0.8% agarose gel and visualized with ethidium bromide. Details on reaction mixture, primers and cycling conditions are reported in the Methods section.
Table S1. Clinical characteristics of the AHE affected dogs analyzed in this study.a
Table S2. Individual brain mitochondrial outcomes in AHE‐affected dogs.a
Table S3. Primer sequencing results of ND1, ND4, CYTB and APP.
Movie S1. Neurological signs of a 6‐month‐old female entire Alaskan Huskies with AHE. This dog showed clinical signs of vestibular dysfunction as evidenced by leaning and falling. Crossing and scuffing of the thoracic limbs and a marked high stepping gait (“hypermetria”) in the thoracic limbs with a mild hypermetria in the pelvic limbs. Although this dog was not part of the current study, the neurological phenotype is representative of the disease. Clinical, histochemical and biochemical analysis relative to this dog have been published elsewhere [dog 4 in (1)].
Movie S2. Neurological signs of a 12‐month‐old female entire Alaskan Huskies with AHE (dog 2 in this study). This dog showed signs of severe ataxia. She crossed over her limbs while standing and walking. She presented hypermetric thoracic limb gait and was tetraparetic. This dog was dysphagic, had difficulty apprehending food, and moving the food bolus to the back of the throat. She had central blindness, and absent proprioceptive placing in all limbs.
Acknowledgments
We wish to express our gratitude to Dr. Jose Goin for editing the movies. The study was partially funded by NIEHS R01 ES012691.
References
- 1. Anderson DD, Quintero CM, Stover PJ (2011) Identification of a de novo thymidylate biosynthesis pathway in mammalian mitochondria. Proc Natl Acad Sci U S A 108:15163–15168. [DOI] [PMC free article] [PubMed] [Google Scholar]
- 2. Anderson SH, Nicol AD (1986) A fluorimetric method for measurement of erythrocyte transketolase activity. Ann Clin Biochem 23 (Pt 2):180–189. [DOI] [PubMed] [Google Scholar]
- 3. Attwell D, Laughlin SB (2001) An energy budget for signaling in the grey matter of the brain. J Cereb Blood Flow Metab 21:1133–1145. [DOI] [PubMed] [Google Scholar]
- 4. Azevedo FA, Carvalho LR, Grinberg LT, Farfel JM, Ferretti RE, Leite RE et al (2009) Equal numbers of neuronal and nonneuronal cells make the human brain an isometrically scaled‐up primate brain. J Comp Neurol 513:532–541. [DOI] [PubMed] [Google Scholar]
- 5. Balaghi M, Pearson WN (1966) Tissue and intracellular distribution of radioactive thiamine in normal and thiamine‐deficient rats. J Nutr 89:127–132. [DOI] [PubMed] [Google Scholar]
- 6. Balk L, Hagerroth PA, Akerman G, Hanson M, Tjarnlund U, Hansson T et al (2009) Wild birds of declining European species are dying from a thiamine deficiency syndrome. Proc Natl Acad Sci U S A 106:12001–12006. [DOI] [PMC free article] [PubMed] [Google Scholar]
- 7. Barnerias C, Saudubray JM, Touati G, De Lonlay P, Dulac O, Ponsot G et al (2010) Pyruvate dehydrogenase complex deficiency: four neurological phenotypes with differing pathogenesis. Dev Med Child Neurol 52:e1–e9. [DOI] [PubMed] [Google Scholar]
- 8. Bates CJ (1997) Vitamin analysis. Ann Clin Biochem 34 (Pt 6):599–626. [DOI] [PubMed] [Google Scholar]
- 9. Batifoulier F, Verny MA, Besson C, Demigne C, Remesy C (2005) Determination of thiamine and its phosphate esters in rat tissues analyzed as thiochromes on a RP‐amide C16 column. J Chromatogr B Analyt Technol Biomed Life Sci 816:67–72. [DOI] [PubMed] [Google Scholar]
- 10. Belyaeva EA, Korotkov SM, Saris NE (2011) In vitro modulation of heavy metal‐induced rat liver mitochondria dysfunction: a comparison of copper and mercury with cadmium. J Trace Elem Med Biol 25(Suppl. 1):S63–S73. [DOI] [PubMed] [Google Scholar]
- 11. Bender DA (1999) Optimum nutrition: thiamin, biotin and pantothenate. Proc Nutr Soc 58:427–433. [DOI] [PubMed] [Google Scholar]
- 12. Bernier FP, Boneh A, Dennett X, Chow CW, Cleary MA, Thorburn DR (2002) Diagnostic criteria for respiratory chain disorders in adults and children. Neurology 59:1406–1411. [DOI] [PubMed] [Google Scholar]
- 13. Bettendorff L, Wirtzfeld B, Makarchikov AF, Mazzucchelli G, Frederich M, Gigliobianco T et al (2007) Discovery of a natural thiamine adenine nucleotide. Nat Chem Biol 3:211–212. [DOI] [PubMed] [Google Scholar]
- 14. Brenner O, Wakshlag JJ, Summers BA, de Lahunta A (2000) Alaskan Husky encephalopathy—a canine neurodegenerative disorder resembling subacute necrotizing encephalomyelopathy (Leigh syndrome). Acta Neuropathol 100:50–62. [DOI] [PubMed] [Google Scholar]
- 15. Brown SB, Fitzsimons JD, Honeyfield DC, Tillitt DE (2005) Implications of thiamine deficiency in Great Lakes Salmonines. J Aquat Anim Health 17:113–124. [Google Scholar]
- 16. Butterworth RF (1986) Cerebral thiamine‐dependent enzyme changes in experimental Wernicke's encephalopathy. Metab Brain Dis 1:165–175. [DOI] [PubMed] [Google Scholar]
- 17. Butterworth RF, Hamel E, Landreville F, Barbeau A (1979) Amino acid changes in thiamine‐deficient encephalopathy: some implications for the pathogenesis of Friedreich's ataxia. Can J Neurol Sci 6:217–222. [DOI] [PubMed] [Google Scholar]
- 18. Butterworth RF, Heroux M (1989) Effect of pyrithiamine treatment and subsequent thiamine rehabilitation on regional cerebral amino acids and thiamine‐dependent enzymes. J Neurochem 52:1079–1084. [DOI] [PubMed] [Google Scholar]
- 19. Calingasan NY, Chun WJ, Park LC, Uchida K, Gibson GE (1999) Oxidative stress is associated with region‐specific neuronal death during thiamine deficiency. J Neuropathol Exp Neurol 58:946–958. [DOI] [PubMed] [Google Scholar]
- 20. Calingasan NY, Gibson GE (2000) Dietary restriction attenuates the neuronal loss, induction of heme oxygenase‐1 and blood‐brain barrier breakdown induced by impaired oxidative metabolism. Brain Res 885:62–69. [DOI] [PubMed] [Google Scholar]
- 21. Camilo ME, Morgan MY, Sherlock S (1981) Erythrocyte transketolase activity in alcoholic liver disease. Scand J Gastroenterol 16:273–279. [DOI] [PubMed] [Google Scholar]
- 22. Chen Q, Okada S, Okeda R (1997) Causality of parenchymal and vascular changes in rats with experimental thiamine deficiency encephalopathy. Pathol Int 47:748–756. [DOI] [PubMed] [Google Scholar]
- 23. Chow CW, Thorburn DR (2000) Morphological correlates of mitochondrial dysfunction in children. Hum Reprod 15(Suppl. 2):68–78. [DOI] [PubMed] [Google Scholar]
- 24. Cocheme HM, Murphy MP (2008) Complex I is the major site of mitochondrial superoxide production by paraquat. J Biol Chem 283:1786–1798. [DOI] [PubMed] [Google Scholar]
- 25. Croft L, Napoli E, Hung CK, Gearhart S, Heym K, Wong S et al (2013) Clinical and biochemical characterization of thiamine deficiency in Pacific harbor seals (Phoca vitulina) maintained at a zoological facility. J Am Vet Med Assoc 243:1179–1189. [DOI] [PubMed] [Google Scholar]
- 26. Depeint F, Bruce WR, Shangari N, Mehta R, O'Brien PJ (2006) Mitochondrial function and toxicity: role of the B vitamin family on mitochondrial energy metabolism. Chem Biol Interact 163:94–112. [DOI] [PubMed] [Google Scholar]
- 27. DiMauro S, Schon EA (2003) Mitochondrial respiratory‐chain diseases. N Engl J Med 348:2656–2668. [DOI] [PubMed] [Google Scholar]
- 28. Dreyfus PM (1959) The quantitative histochemical distribution of thiamine in normal rat brain. J Neurochem 4:183–190. [DOI] [PubMed] [Google Scholar]
- 29. Dreyfus PM (1965) The regional distribution of transketolase in the normal and the thiamine deficient nervous system. J Neuropathol Exp Neurol 24:119–129. [DOI] [PubMed] [Google Scholar]
- 30. Dreyfus PM, Hauser G (1965) The effect of thiamine deficiency on the pyruvate decarboxylase system of the central nervous system. Biochim Biophys Acta 104:78–84. [DOI] [PubMed] [Google Scholar]
- 31. Dror V, Eliash S, Rehavi M, Assaf Y, Biton IE, Fattal‐Valevski A (2010) Neurodegeneration in thiamine deficient rats‐A longitudinal MRI study. Brain Res 1308:176–184. [DOI] [PubMed] [Google Scholar]
- 32. Eisinger J, Bagneres D, Arroyo P, Plantamura A, Ayavou T (1994) Effects of magnesium, high energy phosphates, piracetam and thiamin on erythrocyte transketolase. Magnes Res 7:59–61. [PubMed] [Google Scholar]
- 33. Elfering SL, Haynes VL, Traaseth NJ, Ettl A, Giulivi C (2004) Aspects, mechanism, and biological relevance of mitochondrial protein nitration sustained by mitochondrial nitric oxide synthase. Am J Physiol Heart Circ Physiol 286:H22–H29. [DOI] [PubMed] [Google Scholar]
- 34. Fattal‐Valevski A, Kesler A, Sela BA, Nitzan‐Kaluski D, Rotstein M, Mesterman R et al (2005) Outbreak of life‐threatening thiamine deficiency in infants in Israel caused by a defective soy‐based formula. Pediatrics 115:e233–e238. [DOI] [PubMed] [Google Scholar]
- 35. Fennelly J, Frank O, Baker H, Leevy CM (1967) Red blood cell‐transketolase activity in malnourished alcoholics with cirrhosis. Am J Clin Nutr 20:946–949. [DOI] [PubMed] [Google Scholar]
- 36. Foulon V, Antonenkov VD, Croes K, Waelkens E, Mannaerts GP, Van Veldhoven PP, Casteels M (1999) Purification, molecular cloning, and expression of 2‐hydroxyphytanoyl‐CoA lyase, a peroxisomal thiamine pyrophosphate‐dependent enzyme that catalyzes the carbon‐carbon bond cleavage during alpha‐oxidation of 3‐methyl‐branched fatty acids. Proc Natl Acad Sci U S A 96:10039–10044. [DOI] [PMC free article] [PubMed] [Google Scholar]
- 37. Frederich M, Delvaux D, Gigliobianco T, Gangolf M, Dive G, Mazzucchelli G et al (2009) Thiaminylated adenine nucleotides. Chemical synthesis, structural characterization and natural occurrence. FEBS J 276:3256–3268. [DOI] [PubMed] [Google Scholar]
- 38. Fujisawa Y, Kato K, Giulivi C (2009) Nitration of tyrosine residues 368 and 345 in the beta ‐subunit elicits FoF1‐ATPase activity loss. Biochem J 423:219–231. [DOI] [PubMed] [Google Scholar]
- 39. Geraci JR (1981) Dietary disorders in marine mammals: synthesis and new findings. J Am Vet Med Assoc 179:1183–1191. [PubMed] [Google Scholar]
- 40. Gerards M, Kamps R, van Oevelen J, Boesten I, Jongen E, de Koning B et al (2013) Exome sequencing reveals a novel Moroccan founder mutation in SLC19A3 as a new cause of early‐childhood fatal Leigh syndrome. Brain 136:882–890. [DOI] [PubMed] [Google Scholar]
- 41. Gibson GE, Ksiezak‐Reding H, Sheu KF, Mykytyn V, Blass JP (1984) Correlation of enzymatic, metabolic, and behavioral deficits in thiamin deficiency and its reversal. Neurochem Res 9:803–814. [DOI] [PubMed] [Google Scholar]
- 42. Giulivi C, Zhang YF, Omanska‐Klusek A, Ross‐Inta C, Wong S, Hertz‐Picciotto I et al (2010) Mitochondrial dysfunction in autism. JAMA 304:2389–2396. [DOI] [PMC free article] [PubMed] [Google Scholar]
- 43. Greenwood J, Love ER, Pratt OE (1982) Kinetics of thiamine transport across the blood‐brain barrier in the rat. J Physiol 327:95–103. [DOI] [PMC free article] [PubMed] [Google Scholar]
- 44. Hamada S, Hirashima H, Imaeda M, Okamoto Y, Hamaguchi‐Hamada K, Kurumata‐Shigeto M (2013) Thiamine deficiency induces massive cell death in the olfactory bulbs of mice. J Neuropathol Exp Neurol 72:1193–1202. [DOI] [PubMed] [Google Scholar]
- 45. Hamel E, Butterworth RF, Barbeau A (1979) Effect of thiamine deficiency on levels of putative amino acid transmitters in affected regions of the rat brain. J Neurochem 33:575–577. [DOI] [PubMed] [Google Scholar]
- 46. Harata N, Iwasaki Y (1995) Evidence for early blood‐brain barrier breakdown in experimental thiamine deficiency in the mouse. Metab Brain Dis 10:159–174. [DOI] [PubMed] [Google Scholar]
- 47. Haynes V, Traaseth NJ, Elfering S, Fujisawa Y, Giulivi C (2010) Nitration of specific tyrosines in FoF1 ATP synthase and activity loss in aging. Am J Physiol Endocrinol Metab 298:978–987. [DOI] [PMC free article] [PubMed] [Google Scholar]
- 48. Hazell AS (2009) Astrocytes are a major target in thiamine deficiency and Wernicke's encephalopathy. Neurochem Int 55:129–135. [DOI] [PubMed] [Google Scholar]
- 49. Hinman LM, Blass JP (1981) An NADH‐linked spectrophotometric assay for pyruvate dehydrogenase complex in crude tissue homogenates. J Biol Chem 256:6583–6586. [PubMed] [Google Scholar]
- 50. Honeyfield DC, Hinterkopf JP, Fitzsimons JD, Tillitt DE, Zajicek JL, Brown SB (2005) Development of thiamine deficiencies and early mortality syndrome in lake trout by feeding experimental and feral fish diets containing thiaminase. J Aquat Anim Health 17:4–12. [Google Scholar]
- 51. Jehee JF, Murre JM (2008) The scalable mammalian brain: emergent distributions of glia and neurons. Biol Cybern 98:439–445. [DOI] [PMC free article] [PubMed] [Google Scholar]
- 52. Jeyasingham MD, Pratt OE, Thomson AD, Shaw GK (1986) Reduced stability of rat brain transketolase after conversion to the apo form. J Neurochem 47:278–281. [DOI] [PubMed] [Google Scholar]
- 53. Jones MK, Zhu E, Sarino EV, Padilla OR, Takahashi T, Shimizu T, Shirasawa T (2011) Loss of parietal cell superoxide dismutase leads to gastric oxidative stress and increased injury susceptibility in mice. Am J Physiol Gastrointest Liver Physiol 301:G537–G546. [DOI] [PubMed] [Google Scholar]
- 54. Jubb KV, Saunders LZ, Coates HV (1956) Thiamine deficiency encephalopathy in cats. J Comp Pathol Ther 66:217–227. [DOI] [PubMed] [Google Scholar]
- 55. Kaczmarek MJ, Nixon PF (1983) Variants of transketolase from human erythrocytes. Clin Chim Acta 130:349–356. [DOI] [PubMed] [Google Scholar]
- 56. Kono S, Miyajima H, Yoshida K, Togawa A, Shirakawa K, Suzuki H (2009) Mutations in a thiamine‐transporter gene and Wernicke's‐like encephalopathy. N Engl J Med 360:1792–1794. [DOI] [PubMed] [Google Scholar]
- 57. Lavoie J, Butterworth RF (1995) Reduced activities of thiamine‐dependent enzymes in brains of alcoholics in the absence of Wernicke's encephalopathy. Alcohol Clin Exp Res 19:1073–1077. [DOI] [PubMed] [Google Scholar]
- 58. Lemieux H, Hoppel CL (2009) Mitochondria in the human heart. J Bioenerg Biomembr 41:99–106. [DOI] [PubMed] [Google Scholar]
- 59. Li N, Ragheb K, Lawler G, Sturgis J, Rajwa B, Melendez JA, Robinson JP (2003) Mitochondrial complex I inhibitor rotenone induces apoptosis through enhancing mitochondrial reactive oxygen species production. J Biol Chem 278:8516–8525. [DOI] [PubMed] [Google Scholar]
- 60. Loew FM, Austin RJ (1975) Thiamine status of foxes with Chastek's paralysis. Can Vet J 16:50–52. [PMC free article] [PubMed] [Google Scholar]
- 61. Lopez LC, Akman HO, Garcia‐Cazorla A, Dorado B, Marti R, Nishino I et al (2009) Unbalanced deoxynucleotide pools cause mitochondrial DNA instability in thymidine phosphorylase‐deficient mice. Hum Mol Genet 18:714–722. [DOI] [PMC free article] [PubMed] [Google Scholar]
- 62. Mair RG, Knoth RL, Rabchenuk SA, Langlais PJ (1991) Impairment of olfactory, auditory, and spatial serial reversal learning in rats recovered from pyrithiamine‐induced thiamine deficiency. Behav Neurosci 105:360–374. [PubMed] [Google Scholar]
- 63. Mair RG, Otto TA, Knoth RL, Rabchenuk SA, Langlais PJ (1991) Analysis of aversively conditioned learning and memory in rats recovered from pyrithiamine‐induced thiamine deficiency. Behav Neurosci 105:351–359. [PubMed] [Google Scholar]
- 64. Mazurek S, Weisse G, Wust G, Schafer‐Schwebel A, Eigenbrodt E, Friis RR (1999) Energy metabolism in the involuting mammary gland. In Vivo 13:467–477. [PubMed] [Google Scholar]
- 65. Mazzanti R, Solazzo M, Fantappie O, Elfering S, Pantaleo P, Bechi P et al (2006) Differential expression proteomics of human colon cancer. Am J Physiol Gastrointest Liver Physiol 290:G1329–G1338. [DOI] [PubMed] [Google Scholar]
- 66. McKenna LA, Drummond RS, Drummond S, Talwar D, Lean ME (2013) Seeing double: the low carb diet. BMJ 346:f2563. [DOI] [PubMed] [Google Scholar]
- 67. Morris AA, Leonard JV, Brown GK, Bidouki SK, Bindoff LA, Woodward CE et al (1996) Deficiency of respiratory chain complex I is a common cause of Leigh disease. Ann Neurol 40:25–30. [DOI] [PubMed] [Google Scholar]
- 68. Muller M, Reichert AS (2011) Mitophagy, mitochondrial dynamics and the general stress response in yeast. Biochem Soc Trans 39:1514–1519. [DOI] [PubMed] [Google Scholar]
- 69. Napoli E, Hung C, Wong S, Giulivi C (2013) Toxicity of the flame‐retardant BDE‐49 on brain mitochondria and neuronal progenitor striatal cells enhanced by a PTEN‐deficient background. Toxicol Sci 132:196–210. [DOI] [PMC free article] [PubMed] [Google Scholar]
- 70. Napoli E, Wong S, Hung C, Ross‐Inta C, Bomdica P, Giulivi C (2013) Defective mitochondrial disulfide relay system, altered mitochondrial morphology and function in Huntington's disease. Hum Mol Genet 22:989–1004. [DOI] [PMC free article] [PubMed] [Google Scholar]
- 71. Navarro D, Zwingmann C, Butterworth RF (2008) Region‐selective alterations of glucose oxidation and amino acid synthesis in the thiamine‐deficient rat brain: a re‐evaluation using 1H/13C nuclear magnetic resonance spectroscopy. J Neurochem 106:603–612. [DOI] [PubMed] [Google Scholar]
- 72. Nghiem HO, Bettendorff L, Changeux JP (2000) Specific phosphorylation of Torpedo 43K rapsyn by endogenous kinase(s) with thiamine triphosphate as the phosphate donor. FASEB J 14:543–554. [DOI] [PubMed] [Google Scholar]
- 73. Nissenkorn A, Michelson M, Ben‐Zeev B, Lerman‐Sagie T (2001) Inborn errors of metabolism: a cause of abnormal brain development. Neurology 56:1265–1272. [DOI] [PubMed] [Google Scholar]
- 74. Oishi K, Hofmann S, Diaz GA, Brown T, Manwani D, Ng L et al (2002) Targeted disruption of Slc19a2, the gene encoding the high‐affinity thiamin transporter Thtr‐1, causes diabetes mellitus, sensorineural deafness and megaloblastosis in mice. Hum Mol Genet 11:2951–2960. [DOI] [PubMed] [Google Scholar]
- 75. Okada HM, Chihaya Y, Matsukawa K (1987) Thiamine deficiency encephalopathy in foxes and mink. Vet Pathol 24:180–182. [DOI] [PubMed] [Google Scholar]
- 76. Palus V, Penderis J, Jakovljevic S, Cherubini GB (2010) Thiamine deficiency in a cat: resolution of MRI abnormalities following thiamine supplementation. J Feline Med Surg 12:807–810. [DOI] [PMC free article] [PubMed] [Google Scholar]
- 77. Paparrigopoulos T, Tzavellas E, Karaiskos D, Kouzoupis A, Liappas I (2010) Complete recovery from undertreated Wernicke‐Korsakoff syndrome following aggressive thiamine treatment. In Vivo 24:231–233. [PubMed] [Google Scholar]
- 78. Perez‐Duenas B, Serrano M, Rebollo M, Muchart J, Gargallo E, Dupuits C, Artuch R (2013) Reversible lactic acidosis in a newborn with thiamine transporter‐2 deficiency. Pediatrics 131:e1670–e1675. [DOI] [PubMed] [Google Scholar]
- 79. Picard M, McEwen BS (2014) Mitochondria impact brain function and cognition. Proc Natl Acad Sci U S A 111:7–8. [DOI] [PMC free article] [PubMed] [Google Scholar]
- 80. Plaitakis A, Nicklas WJ, Berl S (1979) Alterations in uptake and metabolism of aspartate and glutamate in brain of thiamine deficient animals. Brain Res 171:489–502. [DOI] [PubMed] [Google Scholar]
- 81. Pontarin G, Ferraro P, Valentino ML, Hirano M, Reichard P, Bianchi V (2006) Mitochondrial DNA depletion and thymidine phosphate pool dynamics in a cellular model of mitochondrial neurogastrointestinal encephalomyopathy. J Biol Chem 281:22720–22728. [DOI] [PubMed] [Google Scholar]
- 82. Prinzo ZW, de Benoist B (2002) Meeting the challenges of micronutrient deficiencies in emergency‐affected populations. P Nutr Soc 61:251–257. [DOI] [PubMed] [Google Scholar]
- 83. Puxty JA, Haskew AE, Ratcliffe JG, McMurray J (1985) Changes in erythrocyte transketolase activity and the thiamine pyrophosphate effect during storage of blood. Ann Clin Biochem 22(Pt 4):423–427. [DOI] [PubMed] [Google Scholar]
- 84. Rachid MA, Filho EF, Carvalho AU, Vasconcelos AC, Ferreira PM (2011) Polioencephalomalacia in Cattle. Asian J Anim Vet Adv 6:126–131. [Google Scholar]
- 85. Rahman S, Blok RB, Dahl HH, Danks DM, Kirby DM, Chow CW et al (1996) Leigh syndrome: clinical features and biochemical and DNA abnormalities. Ann Neurol 39:343–351. [DOI] [PubMed] [Google Scholar]
- 86. Raichle ME, Gusnard DA (2002) Appraising the brain's energy budget. Proc Natl Acad Sci U S A 99:10237–10239. [DOI] [PMC free article] [PubMed] [Google Scholar]
- 87. Read DH, Jolly RD, Alley MR (1977) Polio encephalomalacia of dogs with thiamine deficiency. Vet Pathol 14:103–112. [DOI] [PubMed] [Google Scholar]
- 88. Rigdon RH, Drager GA (1955) Thiamine deficiency in sea lions (Otaria californiana) fed only frozen fish. J Am Vet Med Assoc 127:453–455. [PubMed] [Google Scholar]
- 89. Rindi G, Laforenza U (2000) Thiamine intestinal transport and related issues: recent aspects. Proc Soc Exp Biol Med 224:246–255. [DOI] [PubMed] [Google Scholar]
- 90. Rindi G, Patrini C, Comincioli V, Reggiani C (1980) Thiamine content and turnover rates of some rat nervous regions, using labeled thiamine as a tracer. Brain Res 181:369–380. [DOI] [PubMed] [Google Scholar]
- 91. Roberts GW, Boyd JW (1974) Cerebrocortical necrosis in ruminants. Occurrence of thiaminase in the gut of normal and affected animals and its effect on thiamine status. J Comp Pathol 84:365–374. [DOI] [PubMed] [Google Scholar]
- 92. Robinson JK, Mair RG (1992) MK‐801 prevents brain lesions and delayed‐nonmatching‐to‐sample deficits produced by pyrithiamine‐induced encephalopathy in rats. Behav Neurosci 106:623–633. [PubMed] [Google Scholar]
- 93. Rooprai HK, Pratt OE, Shaw GK, Thomson AD (1996) Thiamine pyrophosphate effect and normalized erythrocyte transketolase activity ratio in Wernicke‐Korsakoff patients and acute alcoholics undergoing detoxification. Alcohol Alcohol 31:493–501. [DOI] [PubMed] [Google Scholar]
- 94. Ros M, Lobato MF, Garcia‐Ruiz JP, Moreno FJ (1990) Integration of lipid metabolism in the mammary gland and adipose tissue by prolactin during lactation. Mol Cell Biochem 93:185–194. [DOI] [PubMed] [Google Scholar]
- 95. Roy A, Kucukural A, Zhang Y (2010) I‐TASSER: a unified platform for automated protein structure and function prediction. Nat Protoc 5:725–738. [DOI] [PMC free article] [PubMed] [Google Scholar]
- 96. Roy A, Xu D, Poisson J, Zhang Y (2011) A protocol for computer‐based protein structure and function prediction. J Vis Exp 3:e3259. [DOI] [PMC free article] [PubMed] [Google Scholar]
- 97. Saad L, Silva LF, Banzato CE, Dantas CR, Garcia C Jr (2010) Anorexia nervosa and Wernicke‐Korsakoff syndrome: a case report. J Med Case Rep 4:217. [DOI] [PMC free article] [PubMed] [Google Scholar]
- 98. Sambrook J, Russel DW (2001) Molecular Cloning: A Laboratory Manual, 3rd edn. Cold Spring Harbor Laboratory Press: Cold Spring Harbor, NY. [Google Scholar]
- 99. Schrodinger, LLC (2010) The PyMOL Molecular Graphics System, Version 1.3r1.
- 100. Schwab MA, Kolker S, van den Heuvel LP, Sauer S, Wolf NI, Rating D et al (2005) Optimized spectrophotometric assay for the completely activated pyruvate dehydrogenase complex in fibroblasts. Clin Chem 51:151–160. [DOI] [PubMed] [Google Scholar]
- 101. Shoubridge EA (2001) Nuclear genetic defects of oxidative phosphorylation. Hum Mol Genet 10:2277–2284. [DOI] [PubMed] [Google Scholar]
- 102. Singh M, Thompson M, Sullivan N, Child G (2005) Thiamine deficiency in dogs due to the feeding of sulphite preserved meat. Aust Vet J 83:412–417. [DOI] [PubMed] [Google Scholar]
- 103. Smith DC, Proutt LM (1944) Development of thiamine deficiency in the cat on a diet of raw fish. Proc Soc Exp Biol Med 56:1–3. [Google Scholar]
- 104. Suomalainen A, Kaukonen J (2001) Diseases caused by nuclear genes affecting mtDNA stability. Am J Med Genet 106:53–61. [DOI] [PubMed] [Google Scholar]
- 105. Talwar D, Davidson H, Cooney J, St JO'Reilly RD (2000) Vitamin B(1) status assessed by direct measurement of thiamin pyrophosphate in erythrocytes or whole blood by HPLC: comparison with erythrocyte transketolase activation assay. Clin Chem 46:704–710. [PubMed] [Google Scholar]
- 106. Tillitt DE, Riley SC, Evans AN, Nichols SJ, Zajicek JL, Rinchard J et al (2009) Dreissenid mussels from the Great Lakes contain elevated thiaminase activity. J Great Lakes Res 35:309–312. [Google Scholar]
- 107. Todd K, Butterworth RF (1999) Mechanisms of selective neuronal cell death due to thiamine deficiency. Ann N Y Acad Sci 893:404–411. [DOI] [PubMed] [Google Scholar]
- 108. Toman JEP, Everett GM, Oster RH, Smith DC (1945) Origin of cardiac disorders in thiamine‐deficient cats. Proc Soc Exp Biol Med 58:65–67. [Google Scholar]
- 109. Vernau KM, Runstadler JA, Brown EA, Cameron JM, Huson HJ, Higgins RJ et al (2013) Genome‐wide association analysis identifies a mutation in the thiamine transporter 2 (SLC19A3) gene associated with Alaskan Husky encephalopathy. PLoS ONE 8:e57195. [DOI] [PMC free article] [PubMed] [Google Scholar]
- 110. Vetreno RP, Ramos RL, Anzalone S, Savage LM (2012) Brain and behavioral pathology in an animal model of Wernicke's encephalopathy and Wernicke‐Korsakoff Syndrome. Brain Res 1436:178–192. [DOI] [PMC free article] [PubMed] [Google Scholar]
- 111. Vissing J, Ravn K, Danielsen ER, Duno M, Wibrand F, Wevers RA, Schwartz M (2002) Multiple mtDNA deletions with features of MNGIE. Neurology 59:926–929. [DOI] [PubMed] [Google Scholar]
- 112. Vognar L, Stoukides J (2009) The role of low plasma thiamin levels in cognitively impaired elderly patients presenting with acute behavioral disturbances. J Am Geriatr Soc 57:2166–2168. [DOI] [PubMed] [Google Scholar]
- 113. Vuilleumier JP, Keller HE, Fidanza F, Bitsch R, Schrijver J, Speek AJ (1991) Erythrocyte transketolase activity; total thiamin in whole blood by HPLC; thiamin in urine. In: Nutritional Status Assessment—A Manual for Population Studies. Fidanza F (ed.), pp. 228–244. Chapman & Hall: London. [Google Scholar]
- 114. Wakshlag JJ, de Lahunta A, Robinson T, Cooper BJ, Brenner O, O'Toole TD et al (1999) Subacute necrotising encephalopathy in an Alaskan husky. J Small Anim Pract 40:585–589. [DOI] [PubMed] [Google Scholar]
- 115. Wang D, Hazell AS (2010) Microglial activation is a major contributor to neurologic dysfunction in thiamine deficiency. Biochem Biophys Res Commun 402:123–128. [DOI] [PubMed] [Google Scholar]
- 116. Wohlsein P, Peters M, Geburek F, Seeliger F, Boer M (2003) Polioencephalomalacia in captive harbour seals (Phoca vitulina). J Vet Med A Physiol Pathol Clin Med 50:145–150. [DOI] [PubMed] [Google Scholar]
- 117. Wood B, Breen KJ, Penington DG (1977) Thiamine status in alcoholism. Aust N Z J Med 7:475–484. [DOI] [PubMed] [Google Scholar]
- 118. Wu C, Orozco C, Boyer J, Leglise M, Goodale J, Batalov S et al (2009) BioGPS: an extensible and customizable portal for querying and organizing gene annotation resources. Genome Biol 10:R130. [DOI] [PMC free article] [PubMed] [Google Scholar]
- 119. Yamada K, Miura K, Hara K, Suzuki M, Nakanishi K, Kumagai T et al (2010) A wide spectrum of clinical and brain MRI findings in patients with SLC19A3 mutations. BMC Med Genet 11:171. [DOI] [PMC free article] [PubMed] [Google Scholar]
- 120. Zhang Y (2008) I‐TASSER server for protein 3D structure prediction. BMC Bioinformatics 9:40. [DOI] [PMC free article] [PubMed] [Google Scholar]
Associated Data
This section collects any data citations, data availability statements, or supplementary materials included in this article.
Supplementary Materials
Figure S1. PCR Products from segments encoding for ND1, ND4, CYTB and APP. Genomic DNA was extracted from 5–10 mg frozen tissue. Details on tissue extraction, primers and running conditions are shown under Methods. PCR products encoding for CYTB, ND4, ND1 and APP were run on a gel and visualized using ethidium bromide. The experimental sizes were consistent with the expected ones [74 bp (CYTB), 79 bp (ND4), 89 bp (ND1) and 78 bp (APP)]. Specificity of each primer pair was confirmed by sequencing all amplified PCR products (Supporting Information Table S3).
Figure S2. Representative images of ATPase alpha‐ and beta‐subunits protein levels from cortex and thalamus of controls and affected dogs. Samples preparation and Western blotting conditions are described under Methods. Densitometry analysis results are shown in Figure 2.
Figure S3. Long‐range PCR of mtDNA to detect large‐scale deletions. Representative gel image showing the segment located between CYTB and ND1, covering for 11.7 kbp of the 16.7 kbp. Five μL of the PCR products and a 1 kb DNA ladder (New England Biolabs, cat # N3232L) were run on a 0.8% agarose gel and visualized with ethidium bromide. Details on reaction mixture, primers and cycling conditions are reported in the Methods section.
Table S1. Clinical characteristics of the AHE affected dogs analyzed in this study.a
Table S2. Individual brain mitochondrial outcomes in AHE‐affected dogs.a
Table S3. Primer sequencing results of ND1, ND4, CYTB and APP.
Movie S1. Neurological signs of a 6‐month‐old female entire Alaskan Huskies with AHE. This dog showed clinical signs of vestibular dysfunction as evidenced by leaning and falling. Crossing and scuffing of the thoracic limbs and a marked high stepping gait (“hypermetria”) in the thoracic limbs with a mild hypermetria in the pelvic limbs. Although this dog was not part of the current study, the neurological phenotype is representative of the disease. Clinical, histochemical and biochemical analysis relative to this dog have been published elsewhere [dog 4 in (1)].
Movie S2. Neurological signs of a 12‐month‐old female entire Alaskan Huskies with AHE (dog 2 in this study). This dog showed signs of severe ataxia. She crossed over her limbs while standing and walking. She presented hypermetric thoracic limb gait and was tetraparetic. This dog was dysphagic, had difficulty apprehending food, and moving the food bolus to the back of the throat. She had central blindness, and absent proprioceptive placing in all limbs.