

Background: Several anti-TNF biologicals are available to treat autoimmune diseases. However, selective TNFR1 inhibition is advisable, thereby reducing the pro-inflammatory TNF/TNFR1 signaling, while the good immunomodulatory TNF/TNFR2 signaling is preserved.
Results: We generated and characterized an anti-TNFR1 Nanobody, TNF Receptor-One Silencer (TROS).
Conclusion: TROS inhibits inflammation in vitro, ex vivo, and in vivo.
Significance: Anti-TNFR1 therapies are potential novel treatments against autoimmune diseases.
Keywords: Autoimmune Disease, Immunotherapy, Inflammation, Inflammatory Bowel Disease, Tumor Necrosis Factor (TNF), Inhibitor, Nanobody, TNF Receptor, TNFR1
Abstract
The cytokine TNF is a well known drug target for several inflammatory diseases such as Crohn disease. Despite the great success of TNF blockers, therapy could be improved because of high costs and side effects. Selective inhibition of TNF receptor (TNFR) 1 signaling holds the potential to greatly reduce the pro-inflammatory activity of TNF, thereby preserving the advantageous immunomodulatory signals mediated by TNFR2. We generated a selective human TNFR1 inhibitor based on Nanobody (Nb) technology. Two anti-human TNFR1 Nbs were linked with an anti-albumin Nb to generate Nb Alb-70-96 named “TNF Receptor-One Silencer” (TROS). TROS selectively binds and inhibits TNF/TNFR1 and lymphotoxin-α/TNFR1 signaling with good affinity and IC50 values, both of which are in the nanomolar range. Surface plasmon resonance analysis reveals that TROS competes with TNF for binding to human TNFR1. In HEK293T cells, TROS strongly reduces TNF-induced gene expression, like IL8 and TNF, in a dose-dependent manner; and in ex vivo cultured colon biopsies of CD patients, TROS inhibits inflammation. Finally, in liver chimeric humanized mice, TROS antagonizes inflammation in a model of acute TNF-induced liver inflammation, reflected in reduced human IL8 expression in liver and reduced IL6 levels in serum. These results demonstrate the considerable potential of TROS and justify the evaluation of TROS in relevant disease animal models of both acute and chronic inflammation and eventually in patients.
Introduction
Tumor necrosis factor (TNF) is a pleiotropic cytokine that exerts beneficial activities in immune regulation and host defense, as well as hazardous pro-inflammatory and cytotoxic functions during inflammation. It exists in both membrane-bound and -soluble forms (1). TNF signaling is mediated by its binding to one of two different cell-surface receptors as follows: TNF receptor (TNFR)3 1 (TNFR1 or p55) or TNF receptor 2 (TNFR2 or p75) (2). Although TNFR1 is ubiquitously expressed on most types of cells, TNFR2 expression is inducible and limited mainly to immune, endothelial, and neuronal cells (1). Both TNF receptors are homotrimeric transmembrane glycoproteins. The extracellular domains of both receptors are conserved and consist of a ligand-binding part composed of a pre-ligand assembly domain, four cysteine-rich domains, and a “TNF-α-converting enzyme”-substrate domain. In contrast, the intracellular domains of both receptors are unrelated and initiate different signaling cascades (3, 4). TNFR1 contains an intracellular death domain and induces pro-inflammatory cascades and apoptosis, whereas TNFR2 does not have a death domain and plays many roles in cell survival and proliferation (5). Furthermore, TNFR2 plays a role in immune regulation and in maintaining tissue homeostasis, for example by activating Tregs (3, 5).
The TNFR ligand is a well known drug target for several inflammatory diseases such as rheumatoid arthritis (RA) and Crohn disease (CD). Anti-TNF antibodies or antibody fragments such as infliximab, adalimumab, certolizumab, and etanercept are used to treat those diseases, and they are among the top 10 best-selling drugs in the world. Unfortunately, they have several disadvantages. They are expensive and induce many side effects, and a lot of patients do not respond or respond enough to initial treatment (6, 7). A second type of unresponsiveness can be identified in patients who initially benefited from treatment but lost their response during maintenance therapy. Other less frequent side effects of anti-TNF therapy include increased risk of serious infections, cardiovascular and neurologic complications, and onset of additional autoimmune diseases such as lupus, psoriasis, and diabetes (6, 8–15). An effect of TNF inhibitors on the incidence and/or manifestation of malignancy has also been suggested (16, 17).
Therefore, specific targeting of the pathogenic TNF signaling using selective inhibitors of TNFR1 has gained increasing attention as an alternative to inhibitors of the ligand. By targeting the TNF/TNFR1 pathway, TNF/TNFR2 signaling remains untouched, thereby preserving its beneficial immunomodulatory signals and its role in tissue homeostasis (3). This treatment strategy might prove to be safer than total TNF blockade.
Considering this, we generated a selective human TNFR1 inhibitor based on Nanobody (Nb) technology. Nbs are small antigen-binding fragments derived from camelid heavy-chain antibodies that are devoid of light chains (18). They have advantages over the classical monoclonal antibodies (Abs), such as their low molecular mass (15 kDa), low immunogenicity, high affinity, solubility, and stability. Additionally, they are encoded by a single gene (VHH), which makes them modular and allows high yield production in bacteria or yeasts (19, 20). We developed human TNFR1-specific Nbs, and by linking two anti-hTNFR1 Nbs with an anti-albumin Nb, we generated a TNFR1 inhibitory tool named TNF Receptor-One Silencer (TROS). We show that nanomolar amounts of TROS inhibit TNF/TNFR1 signaling in vitro and that TROS is a strong inhibitor of hTNFR1 in liver chimeric humanized mice in vivo and in inflamed colon tissues of patients with Crohn disease ex vivo. Our results demonstrate the considerable potential of TROS and justify the evaluation of TROS in relevant disease animal models of both acute and chronic inflammation and eventually in patients.
EXPERIMENTAL PROCEDURES
Construction of a VHH Library
An alpaca (Vicugna pacos) was injected subcutaneously on days 0, 7, 14, 21, 28, and 35 with 130 μg of soluble human TNFR1 (hTNFR1) (PeproTech, 210-07) per injection. On day 37, anticoagulated blood was collected for analysis of the immune response and preparation of lymphocytes. IgG subclasses were obtained by successive affinity chromatography on protein A and protein G columns. Serum IgG, subclasses IgG1, IgG2, and IgG3, was assayed by ELISA. The lymphocytes were used to construct a VHH library as described before (21, 22). In brief, total RNA isolated from peripheral blood lymphocytes was used as template for first strand cDNA synthesis using oligo(dT) primers. The cDNA was used as a template to amplify the VHH-encoding sequences by PCR. The amplified fragments were digested with PstI and NotI and cloned between the PstI and NotI sites of the phagemid vector pHEN4. A VHH library of about 108 independent transformants was obtained.
Isolation of hTNFR1-specific Nbs
To screen for the presence of human TNFR1-specific Nbs, four consecutive rounds of panning were performed on solid-phase coated hTNFR1 (100 μg/ml, 10 μg/well). The enrichment for antigen-specific phages after each round of panning was assessed by polyclonal phage ELISA. Enrichment was obtained after the 3rd and clearly after the 4th round of panning. We randomly selected 190 colonies after the 3rd round and 142 after the 4th and analyzed them by ELISA for the presence of antigen-specific VHHs in periplasmic extracts. Of 332 colonies, 34 scored positive in this assay (7/190 and 27/142 from 3rd and 4th rounds, respectively). The selected clones were analyzed, and their VHH genes were sequenced to identify the different Nbs.
Subcloning, Expression, and Purification
The vhh genes of the selected clones were subcloned from pHEN4 into the pHEN6c expression vector, in fusion with a C-terminal His6 tag, using PstI and BstEII (Promega) (23). The pHEN6c vector was transformed into WK6 Escherichia coli cells, and Nb expression was induced as described previously (Fig. 1B) (23). The expressed Nbs were extracted from the periplasm by osmotic shock (24) and purified using a nickel-Sepharose 6 FF column (GE Healthcare), equilibrated with 20 mm NaH2PO4, pH 7.5, 500 mm NaCl, 20 mm imidazole, and 1 mm PMSF. After loading, the column was washed with 20 column volumes of the same buffer in the presence of 0.1% empigen as detergent. Before elution, the column was equilibrated with 5 column volumes of equilibration buffer without detergent. The Nbs were first eluted with 20 mm NaH2PO4, pH 7.5, 20 mm NaCl, 50 mm imidazole, and 1 mm PMSF and then with 400 mm imidazole in the same buffer. The eluate was diluted 20 times with 25 mm sodium acetate, pH 5.5, and loaded on a Source 15S column (GE Healthcare) to remove LPS and other contaminants. After equilibration, the Nbs were eluted by a linear gradient over 20 column volumes of NaCl from 0 to 1000 mm in 25 mm sodium acetate, pH 5.5. Finally, the recombinant protein was injected on a Superdex 75 gel filtration column with PBS as running solution. The obtained fractions were analyzed with Coomassie-stained SDS-polyacrylamide gels and anti-His Western blots. Protein concentration was measured by the Micro-BCA assay (Pierce). LPS levels were determined using an EndoSafe-PTS assay (Charles River) that makes use of LAL reagents in a Food and Drug Administration-licensed disposable test cartridge with a handheld reader for real time endotoxin testing. The LPS concentration was <0.5 EU/ml.
FIGURE 1.
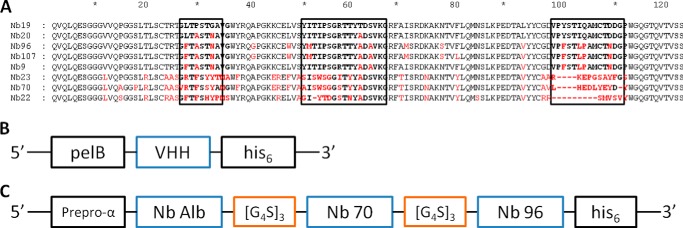
A–C, primary structure of eight different anti-hTNFR1 nanobodies, the gene construct in the pHEN6c vector of monovalent nanobodies, and the pAOXZalfa vector of TROS. A, amino acid sequences of the eight nanobodies. The CDRs are shown in boldface in boxes. Amino acids in red indicate the main differences between the different Nbs and Nb 19 (top sequence). They belonged to four different clonally unrelated B-cell clones. The amino acid sequences suggest that Nbs 19, 20, 96, 107, and 9 are from clonally related B-cells resulting from somatic hypermutations. Nb 23, 70, and 22 belong to unrelated B-cell clones. Gaps (dashes) are introduced to align sequences. B, this pHEN6c construct for the Nanobody was transformed in WK6 E. coli cells. The VHH gene of the Nb is preceded by the pelB leader signal sequence, which directs the expressed protein to the bacterial periplasm and ends with a sequence encoding a C-terminal His6 tag. C, in the gene construct of TROS, Nb Alb, Nb 70, and Nb 96 are linked to each other with the flexible (G4-S)3 linker. The TROS construct is preceded by the α-mating factor pre-pro signal sequence and is made for expression in the yeast P. pastoris.
Cloning and Expression of TROS
To generate the trivalent Nb “Alb-70-96” (TROS), an albumin-binding Nb (25) was linked to Nb 70 and Nb 96 by a (Gly4-Ser)3 sequence. First, we generated the bivalent Nb 70–96 construct. The Nb 70 VHH gene was amplified by PCR using a sense bivalent Nb primer (5′-GCCCAGCCGGCCATGGCCCAGKTGCAGCTACAGGAGTCNGGNGG-3′) and an antisense bivalent Nb primer, including the (Gly4-Ser)3 linker sequence (5′-GCCTGATTCCTGCAGCTGCACCTGACTACCGCCGCCTCCAGATCCACCTCCGCCACTACCGCCTCCGCCTGAGGAGACGGTGACCTGGGT-3′). The amplified Nb 70 gene and the pHEN6c vector containing Nb 96 were digested with PstI and NcoI (Promega). Next, we ligated Nb 70 into the pHEN6c vector containing Nb 96, and the ligation product was transformed into E. coli strain WK6. Positive colonies were screened by PCR and sequenced to validate the sequence of the bivalent Nb 70–96. To obtain a TROS-containing construct, this procedure was repeated by ligating Nb Alb VHH into the pHEN6c vector containing Nb 70–96.
To increase the expression yield of TROS, we used the eukaryotic yeast Pichia pastoris. The TROS-encoding sequence was cloned into the pAOXZalfa vector, a derivative of the pPICZα vector from Invitrogen. The expression vector contains the aox1 promoter fused to the α-mating factor pre-pro signal sequence followed by the gene coding for the Nb. The Nb contained a His6 tag at the C terminus comparable with the E. coli construct (Fig. 1C). First, the Nb gene was amplified by PCR using primers pAOXpelB (5′-TCTCTCGAGAAAAGGTTATTACTCGCGGCCCAGCCG-3′) and HISpAOX (5′-CAAGCTTAGATACTATTAGTGATGGTGATGGTGGTG-3′). The Nb gene was then digested with XhoI and HindIII (Promega), and the pAOXZalfa vector was digested with XhoI/XmaI followed by digestion with HindIII/XmaI (Promega). The Nb gene was then ligated in pAOXZalfa, using a three-point ligation. pAOXZalfa Nb Alb-70-96 vector was transformed in wild type GS115 P. pastoris. After selection of an appropriate expression clone, TROS was produced in 6 liters of culture medium in baffled shake flasks (26). The medium was isolated by centrifugation at 18,000 × g for 30 min at 4 °C and diafiltered against 20 mm NaH2PO4, pH 7.5, 500 mm NaCl, 20 mm imidazole, and 1 mm PMSF. The Nb in the diafiltrate was purified further as described for expression in E. coli.
ELISA
To determine the binding affinity of the purified Nbs, we performed hTNFR1 ELISA. Microtiter half-area plates (Nunc) were coated overnight at 4 °C with 50 ng of hTNFR1 (PeproTech, 210-07) in Tris-buffered saline (TBS) per well. Residual protein-binding sites were blocked for 1 h at room temperature with TBS supplemented with 0.05% Tween 20 (TBST) and 5% BSA. Next, Nbs were added to the wells at the indicated concentrations in TBST and 2.5% BSA and incubated for 1 h. A Nb with unrelated specificity was used as negative control: a trivalent Nb consisting of two cAbBcII10 Nbs, which is a control Nb targeting anti-β-lactamase (23), coupled to an anti-albumin Nb (25), called Nb “Alb-Ctrl-Ctrl.” An hTNFR1 antibody (Ab) (R&D Systems, MAB625) served as a positive control. Bound Nbs were detected with a mouse anti-His antibody (1:1000) (AbD SeroTec, MCA1396) followed by anti-mouse IgG1-HRP (1:2000) (GE Healthcare, NA931). Absorption at 450 nm was measured after adding the peroxidase substrate 3,30,5,50-tetramethylbenzidine (BD Biosciences OptEIATM) followed by stopping buffer (1 m H2SO4). The background signal at 595 nm was subtracted.
To determine the affinity of the Nbs to albumin, the ELISA microplates were coated with mouse albumin (Sigma). To check cross-reactivity with human TNFR2 (hTNFR2) or mouse TNFR1 (mTNFR1), the ELISA microplates were coated with hTNFR2 (R&D Systems, 1089-R2-025/CF) or mTNFR1 (R&D Systems, 425-R1-050/CF). GraphPad Prism 6.0 was used to determine Kd values based on a nonlinear regression model and a saturation binding equation.
HEK-2 Blue Assay
The HEK-2 blue assay is a colorimetric assay in which HEK-2 blue cells are engineered with multiple genes from the TLR2 pathway (Invitrogen). HEK-2 blue cells stably express optimized alkaline phosphatase under the control of an inducible promoter, and the enzyme is secreted upon induction of the transcription factors NF-κB. Reaction of the enzyme with the HEK-2 blue detection medium can be determined by colorimetry. HEK-2 blue cells in detection medium were seeded at 50,000 cells per well in a 96-well plate (Invitrogen). After 3 h, cells were incubated for 30 min with the indicated concentrations of Nbs at 37 °C. Next, 100 IU/ml hTNF was added and incubation continued for 18 h at 37 °C. Absorption of the culture medium was measured at 655 nm with a plate reader. Inhibition of LTa signaling through TNFR1 was determined using the same setup, but cells were stimulated with 125 ng/μl human LTa (R&D, 211-TB-010/CF). GraphPad Prism 6.0 was used to determine IC50 values based on a nonlinear regression model and a dose-response inhibition equation.
Surface Plasmon Resonance (SPR) Analysis
Nb affinity for hTNFR1 was determined by SPR analysis using BIAcore T200. Human soluble TNFR1 (PeproTech, 210-07) diluted in NaAc, pH 4, was chemically immobilized on a CM5 sensor chip using a mixture of N-hydroxysuccinimide and N-(3-dimetheylaminopropyl)-N′-ethylcarbodiimide hydrochloride until a response unit of 581 was obtained at 25 °C. Binding experiments were performed at 25 °C in HBS (10 mm Hepes, pH 7.5, 150 mm NaCl, 3.5 mm EDTA, and 0.005% Tween 20) at a flow rate of 20 μl/min, applying a 2-fold dilution series of Nb ranging from 500 to 1 nm and an hTNFR1 Ab dilution series from 250 to 1 nm as positive control. Between applying different Nb concentrations, the chip was regenerated during 300 s at a flow rate of 30 μl/min with 25 mm NaOH and 500 mm NaCl, without any detectable effect on the binding capacity of hTNFR1. A blank uncoated channel was used as an online reference during all injections. To analyze the results and determine the kinetics of association (ka) and dissociation (kd), the sensorgrams were fitted by subtracting the signal of the reference flow cell using BIAcore T200 software. Nb 70 and Nb 96 were fitted with a 1:1 binding model, whereas curves of Nb TROS were fitted with a bivalent binding model.
SPR was also used to perform competition assays and to determine whether Nb 70, Nb 96, and TNF bind the same epitope(s). hTNFR1 Ab was used as a positive control. The flow conditions as described above were used. First, a 450-s binding phase with either Nb or the hTNFR1 Ab at saturating concentrations (1 μm) was followed by a second 450-s binding phase with a mixture of Nb or hTNFR1 Ab and competitor (TNF), and vice versa. Curves were analyzed using evaluation software (BIAcore) and interpreted visually.
Docking Models
To predict Nb-hTNFR1 binding, homology modeling and docking were performed. A homology model of trimeric hTNFR1 was built with Modeler (27) using monomeric hTNFR1 (PDB code 1TNR) and trimeric hTNFR2 (PDB code 3ALQ) as templates. Homology models of all Nbs were also generated by Modeler using multiple templates from PDB, namely 4FZE, 4JVP, 3P0G, and 2KH2 (28). All models were validated by RAMPAGE (29), and the best models were used for docking by ClusPro (30) to predict binding of Nb 70 and Nb 96 to hTNFR1. Homology models and docking results were analyzed, and figures were rendered using PyMOL.
Serum Half-life
To determine the clearance of TROS after intravenous injection, 8-week-old female C57BL/6J mice (Janvier) were intravenously injected with 100 μg of TROS in a total volume of 300 μl of PBS. Blood samples of alternating mice were taken retro-orbitally after 1, 3, and 8 h, and then daily until day 8. Blood was stored overnight at 4 °C, and supernatant was collected from clotted blood and centrifuged at 14,000 × g for 15 min at 4 °C. Nb serum concentrations were determined by hTNFR1 ELISA as described above.
To determine the clearance of TROS after intraperitoneal injection, a mixture of ten-week-old male and female C57BL/6J mice (own breeding) were intraperitoneally injected with 200 μg of TROS in a total volume of 300 μl of PBS. Blood samples were taken retro-orbitally after 1, 3, 7, and 10 h and then daily until day 6. Blood was analyzed as described above.
Inhibition of NF-κB-dependent Genes and Cytokines Induced by TNF
HEK293T cells were seeded at 500,000 cells per well in a 6-well plate in Dulbecco's modified Eagle's medium (DMEM) supplemented with 10% fetal bovine serum, 2 mm l-glutamine, and 1 mm sodium pyruvate. The next day, cells were preincubated with 1 μm Nb (TROS or Nb Alb-Ctrl-Ctrl), 1 μm etanercept (ETA), or 0.2 μm hTNFR1 Ab as a positive control and dissolved in 100 μl of medium, for 30 min at 37 °C. Subsequently, 1000 IU/ml hTNF was added. To determine the therapeutic effect of TROS, the reversed situation was also performed. Here, cells were first incubated with hTNF for 30 min at 37 °C followed by addition of the Nbs or Abs. Six hours after TNF stimulation, RNA was isolated using TRIzol and the InviTrap Spin Universal RNA mini kit (Isogen Life Science). After 24 h, supernatant was collected to analyze secreted cytokines. cDNA was synthesized by the iScript cDNA synthesis kit (Bio-Rad). qPCR was performed on the Light Cycler 480 system (Roche Applied Science) using Sensifast Bioline Mix (Bio-Line). qPCR was used to determine the expression of TNF, A20 (TNFAIP3), IκBα, and IL8. Expression levels were normalized to the expression of the two most stable housekeeping genes, 36B4 and PPIA, which were determined using GeNorm (31). A multiplex approach (Bio-Plex Pro-assay Bio-Rad) was used to measure IL8 levels in supernatant, according to manufacturer's guidelines.
Ex Vivo Inhibition of Inflammation in Biopsies of Inflamed Human Colon
Biopsies were obtained from the acutely inflamed colon of three patients with Crohn disease. The biopsies were washed three times in 500 μl of RPMI 1640 medium supplemented with 200 μg/ml gentamycin (RPMI 1640 medium high) and then kept in 500 μl RPMI 1640 medium high for 1 h. They were weighed and incubated with 1 μm TROS or Nb Alb-Ctrl-Ctrl dissolved in 50 μl of RPMI 1640 medium supplemented with 50 μg/ml gentamycin (RPMI 1640 medium low). After 24 h, supernatant was collected, and biopsies were washed in PBS and transferred to RNA later (Ambion). RNA and cDNA were prepared as described above. qPCR for IL6, IL8, and TNF was performed as described above, and expression levels were normalized to reference genes GAPDH and ACTB, selected with GeNorm. Cytokine levels in supernatant were measured using a multiplex approach according to manufacturer's guidelines (Bio-Plex Pro-assay Bio-Rad).
In Vivo Inhibition of TNF-induced Liver Inflammation
To evaluate the in vivo inhibition capacity of TROS, we used human liver chimeric uPA+/+-SCID mice (males and females aged 10–25 weeks) (32). uPA+/+-SCID mice, affected by transgene-induced liver disease, were transplanted early after birth with primary human hepatocytes, which then colonize the mouse liver up to about 85% (32, 33). The degree of liver chimerism is determined by measuring human serum albumin levels (32). Mice with human albumin levels ranging from 1.8 to 2.8 mg/ml, which roughly corresponds to 40–60% liver chimerism (34), were pretreated with an intraperitoneal (i.p) injection of 200 μg of TROS (300 μl) or with 300 μl of PBS, followed 30 min later by an intraperitoneal injection with 10 μg of TNF. After 2 h, blood was taken retro-orbitally, and livers were isolated and stored in RNA later (Ambion). RNA was isolated using the InviTrap Spin Universal RNA mini kit, and cDNA was prepared as described above. qPCR was performed using primers for A20, ICAM (ICAM1), VCAM (VCAM1), and IL8, and expression levels were normalized to housekeeping genes UBC and 28S, selected with GeNorm. All primers were human-specific and do not cross-react with the murine equivalent. Serum was prepared from blood as described above and a human-specific IL6 ELISA (IL6 ready-set-go ELISA, eBioScience) was performed to measure human IL6 levels in serum.
Ethics Approval for Animal and Human Studies
All animal experiments were approved by the ethics committee of the Faculty of Science of Ghent University or the Faculty of Medicine and Health Sciences of Ghent University. Mice were housed in a specific pathogen-free animal facility with 12-h light and dark cycles and free access to food and water. The study on human colonic biopsies was approved by the ethics committee of Ghent University Hospital (permit number EC UZG 2004/242), and each participant provided a signed informed consent form.
Statistical Analysis
Data are presented as means ± S.E. Data were analyzed with an unpaired t test, unless mentioned differently. Significance levels were calculated for differences between TROS, vehicle, and Nb Alb-Ctrl-Ctrl, as indicated (*, 0.01 ≤ p < 0.05; **, 0.001 ≤ p < 0.01; ***, 0.001 ≤ p 0.0001; ****, p < 0.0001).
RESULTS
Generation of Anti-hTNFR1 Nbs
An alpaca (V. pacos) was immunized with recombinant human soluble TNFR1 protein, according to standard procedures. Next to conventional antibodies (IgG1 subclass), alpacas produce antibodies with only heavy chains (IgG2 and IgG3 subclasses) in response to the recombinant protein (18). The immunized alpaca generated an immune response in all IgG subclasses. The IgG2 and IgG3 responses were weaker than the IgG1 response. Among the heavy-chain-only antibodies, the IgG3 response was the strongest. Subsequently, a pHEN4 phagemid library was generated from blood B-lymphocytes isolated from the immunized alpaca (35) and transformed in E. coli TG1 cells. A library of about 108 independent transformants was obtained, and about 74% of them harbored the vector with the right insert size. Next, four consecutive rounds of panning with the phage-displayed Nbs on solid-phase coated hTNFR1 were performed. Enrichment was obtained after the 3rd and clearly after the 4th round, after which a total of 332 individual colonies (190 and 142 after 3rd and 4th rounds of panning, respectively) were randomly selected and analyzed by hTNFR1 ELISA for the presence of antigen-specific VHHs in their periplasmic extracts. Sequencing of VHH genes from 34 positive colonies resulted in eight different TNFR1-specific Nbs. Based on sequence homology in the complementarity determining region 3 (CDR3), they belong to four different clonally unrelated B-cell clones (Fig. 1A). Five of the Nbs, Nb 19, 20, 96, 107, and 9, show very high sequence similarities, which suggests that they are from clonally related B-cells as a result of somatic hypermutations. Moreover, Nb 23, 70, and 22 most likely belong to unrelated B-cell clones. Fig. 1A illustrates the amino acid sequences of the Nbs. More detailed analysis of the amino acid sequences revealed that Nb 70 and Nb 23 possess the typical hydrophilic KEREF motif in their sequence, indicative for a high stability. Nbs are characterized by three complementarity determining regions (CDRs), all contributing to antigen binding specificity (36). The most important differences between the different clones are mainly located in the CDRs and are framed in the boxes in Fig. 1A. We also predicted their putative tertiary structures by using a homology-modeling server, SWISS MODEL (37). Based on known template structures (PDB 3POG), three-dimensional models of each Nb could be constructed (data not shown). The typical β-sandwich immunoglobulin fold is conserved in Nbs, and Nb 70 is characterized by a long protruding CDR3 loop that might lead to good binding and inhibition capacities. Based on the three-dimensional structures, the different families could also be distinguished. Nb 9, Nb 19, Nb 20, Nb 96, and Nb 107 have similar structures, mainly in the CDRs, and thus belong to the same family (data not shown).
Cloning and Expression of the Anti-hTNFR1 Nanobodies
To express and purify the selected Nbs, they were subcloned from the pHEN4 plasmid into pHEN6c (23), which enables expression of a soluble fusion protein when transformed into WK6 E. coli. In the pHEN6c plasmid, the Nb gene is preceded by the pelB leader signal sequence, which directs the expressed protein to the bacterial periplasm, and ends with a sequence encoding a C-terminal His6 tag (Fig. 1B). The different Nbs were purified by immobilized metal-ion affinity chromatography followed by ion exchange and gel filtration chromatography. Next, purity was verified by Coomassie SDS-PAGE and Western blot detection using the His6 tag (data not shown). This showed that every Nb was present as a single band of about 14 kDa. Also, all Nbs were pure and free of contamination with other proteins or LPS.
Analysis of the hTNFR1 Binding and Inhibition of the Different Anti-TNFR1 Nbs
We determined the binding efficiency of the monovalent anti-hTNFR1 Nbs to hTNFR1 by ELISA, starting at a saturating concentration of 2.7 μm. This allowed us to identify the Nbs with the highest affinity (Fig. 2A). A hTNFR1 monoclonal antibody (Ab) was used as a positive control. cAbBcII10 (Nb Ctrl) is an irrelevant monovalent Nb that served as a negative control (23). Nb 96 and Nb 107 bound with the highest affinity to hTNFR1 (Kd 34.8 and 55.61 nm, respectively), followed by Nb 70. None of the other Nbs showed high binding affinity. As expected, the Nb Ctrl did not bind hTNFR1.
FIGURE 2.

A–D, binding of hTNFR1 and inhibition of TNF/hTNFR1 signaling by the monovalent nanobodies and surface plasmon resonance sensorgrams of Nb 96 and Nb 70 binding to immobilized hTNFR1. A, to determine the binding affinity, an hTNFR1 ELISA with the monovalent Nbs was performed. A serial 0.2 dilution was applied, starting at 2.7 μm. B, using a HEK-2 blue assay, the inhibition capacity of TNF/hTNFR1 signaling by the monovalent Nbs was determined. HEK-2 blue cells were preincubated with a 0.2 Nb dilution series starting at 2.7 μm and stimulated with 1000 IU/ml TNF. Nb 70 was identified as the only inhibiting Nb. C and D, SPR analysis of Nb 96 and Nb 70. The adjusted sensorgrams overlays show binding of Nb 96 or Nb 70 applied in a dilution series from 1.95 to 500 nm to immobilized hTNFR1. Dotted lines show global fitting of the binding data to a 1:1 interaction model. Both Nbs have good association constants (high ka), but show quick dissociation (kd). Nb Alb-Ctrl-Ctrl, an irrelevant control Nanobody; hTNFR1 Ab, a human TNFR1 antibody, positive control. Black dotted line, Nanobody concentration that binds 50% of hTNFR1 or albumin. The ELISA and HEK-2 blue assay were done in triplicate, and data are represented as mean ± S.E. Surface plasmon resonance analyses were done in duplicate.
Next, we used HEK-2 blue cells to determine the ability of Nbs to inhibit the TNFR1 signaling cascade. Here, TNF/TNFR1 signaling activates NF-κB (38), and this results in the transcription and secretion of the reporter protein alkaline phosphatase, which can be detected by purple/blue coloration of the HEK-2 blue detection medium. We used this system in the presence of increasing concentrations of the different Nbs. Fig. 2B shows that Nb 70 is the only Nb that inhibits TNF/TNFR1 signaling within the tested dose range.
We then studied the binding kinetics of Nb 96 and Nb 70 on immobilized hTNFR1 using SPR. SPR enables the analysis of direct biomolecular interactions with several advantages over traditional methods, such as speed, no need for labeling, real time, and use of micro-samples (39). SPR analysis revealed that both Nb 96 and Nb 70 bind with high affinity to immobilized hTNFR1 (Fig. 2, C and D). Their rapid binding to hTNFR1 is reflected in the high association constants (ka 6.09 × 10⁵ and 3.282 × 10⁶ m−1 s−1, respectively), but because they are monovalent, they also quickly dissociate from the receptor, reflected by a relatively high kd, namely 0.02357 and 0.03806 s−1, respectively. Nevertheless, as summarized in Table 1, their overall equilibrium affinities (KD) are in the low nanomolar range, 38.71 and 11.59 nm, for Nb 96 and Nb 70 respectively.
TABLE 1.
Association (ka), dissociation (kd), and equilibration (KD) constants of Nb 70, Nb 96, and TROS determined by surface plasmon resonance (SPR),1Kd determined by ELISA2 on hTNFR1 and albumin, and competition with TNF determined by SPR3 on hTNFR1
NA means not applicable.

Epitope Mapping of Monomeric Nb-Binding Sites and in Vitro Competition with TNF
We used SPR to identify the hTNFR1-binding epitopes of Nb 70 and Nb 96. Nb 70 was added to the immobilized hTNFR1 at saturating concentrations followed by Nb 96, and vice versa. This enabled us to study competition between the Nbs for binding to hTNFR1. Fig. 3A illustrates that Nb 70 and Nb 96 can bind simultaneously to hTNFR1, as the signal obtained by binding of a mixture of the two is the sum of the signals obtained from each Nb individually. This means that they recognize and bind different hTNFR1 epitopes. Next, we determined whether the Nbs compete with TNF binding. First, either Nb 70 or Nb 96 was added, followed by TNF, and vice versa. The sensorgrams in Fig. 3B indicate that Nb 70 and TNF compete for binding to hTNFR1, but Nb 96 and TNF do not compete. This suggests that Nb 70 and TNF share the same hTNFR1 epitope, although Nb 96 does not (Fig. 3C). This shows that the binding sites of Nb 70 and TNF for hTNFR1 overlap or are identical and explains the inhibitory, competitive activity of Nb 70, in contrast to Nb 96.
FIGURE 3.

A–C, competition between Nb 70 and Nb 96 and between Nb 70 or Nb 96 and TNF for binding to immobilized hTNFR1. A, adjusted SPR sensorgrams of Nb 70 and/or Nb 96 for binding to hTNFR1. B and C, adjusted SPR competition sensorgrams for Nb 70 (B) and Nb 96 (C), and TNF for binding to hTNFR1. Nbs and TNF were applied in equal amounts at saturating concentrations (1 μm). Competition between two components occurs when the signal obtained by binding of a mixture of the two is lower than the sum of the signals obtained by each component individually. Nb 70 and Nb 96 do not compete with each other for binding to hTNFR1, nor do Nb 96 and TNF. This is in contrast to Nb 70, which binds the same epitope in hTNFR1 as TNF or overlaps it. The arrows indicate when the two components are applied together.
Docking Models of Nb 70 and Nb 96 to Trimerized hTNFR1
To gain insight into the binding of Nb 96 and Nb 70 to trimeric hTNFR1, homology and docking modeling were conducted. Based on known template structures of monomeric hTNFR1 (PDB code 1TNR) and trimeric hTNFR2 (PDB code 3ALQ), a homology model for trimeric hTNFR1 was designed. Homology models of Nb 70 and Nb 96 were also generated using multiple templates (PDB code 4FZE, 4JVP, 3P0G, and 2KH2). Based on these models, prediction of Nb binding to trimeric hTNFR1, interacting with trimerized TNF, was made. The model of Nb 70 docking to hTNFR1 (Fig. 4A) predicts that Nb 70 binds between two chains of the extracellular domain of trimeric hTNFR1 and interferes with the binding of trimerized TNF to hTNFR1. In contrast, modeling predicts that Nb 96 binds to hTNFR1 near the region that interacts with the cell membrane and so it does not disturb TNF/TNFR1 binding (Fig. 4B). Those predictions are consistent with the SPR competition assays. Additionally, Fig. 4, A and B, shows that the closest contacts between Nb 70 or Nb 96 and trimeric hTNFR1 are through the CDR3 loop of the Nbs.
FIGURE 4.
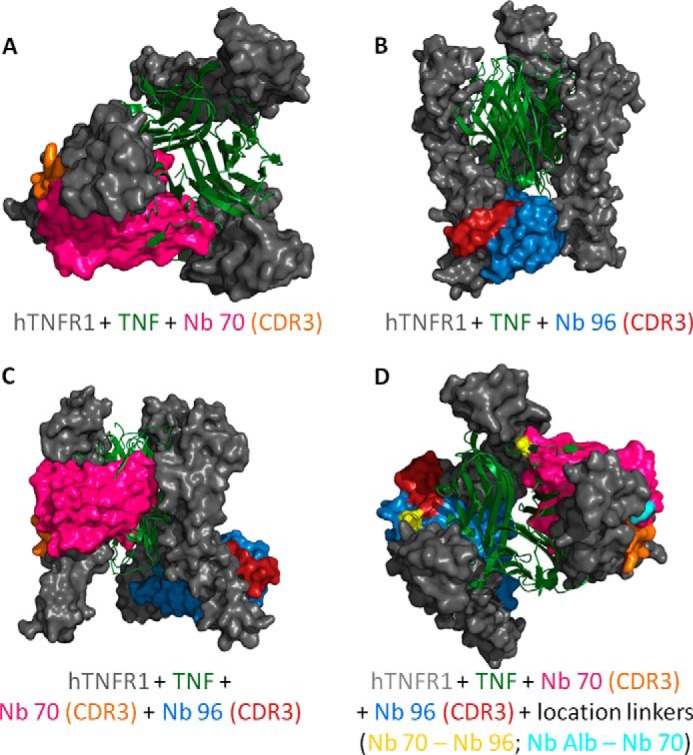
A–D, docking prediction models of trimeric hTNFR1 interacting with TNF, Nb 70, and Nb 96. A and B, Nb 70 competes with TNF (top view), whereas Nb 96 does not (frontal view). Their CDR3 binds into smaller clefts of the receptor and is important for the high affinity. C, prediction model of Nb 70 and Nb 96 interacting simultaneously with hTNFR1. They interact with the three-dimensional structure of hTNFR1, as their binding with the different chains of trimeric hTNFR1 is not interchangeable. D, generation of a trivalent Nanobody by linking the C-terminal end of an anti-albumin Nb to the N-terminal end of Nb 70 and its C-terminal end to the N-terminal end of Nb 96 might increase the inhibitory capacity of the Nb. The anti-albumin Nb does not disturb the binding of Nb 70 or Nb 96 to hTNFR1, as this linker is located on the outside (start linker light blue), although the flexible linker between Nb 70 and Nb 96 (start/end linker yellow) goes through the different chains of trimeric hTNFR1, thereby disturbing its interaction with TNF even more. All models were validated by RAMPAGE (29), and the best models were used for docking by ClusPro (30) to predict binding of Nb 70 and Nb 96 to hTNFR1. Homology models and docking results were analyzed and figures rendered using PyMOL.
SPR analysis of competition between Nb 70 and Nb 96 showed that the two Nbs do not compete for hTNFR1 binding because they bind different epitopes. Hence, we generated a prediction model in which both Nb 70 and Nb 96 were docked to trimeric hTNFR1 simultaneously (Fig. 4C). As expected, the two Nbs bind hTNFR1 differently. Moreover, they not only bind different regions of the trimeric hTNFR1, but also interact with different TNFR1 chains as follows: Nb 70 binds chains A and B, and Nb 96 binds chains B and C, and no interchange is possible.
Generation of Multivalent Nbs Expressed in P. pastoris
We generated Nb Alb-70-96 (TROS) consisting of Nb 70 (the only inhibitor of TNF/hTNFR1 signaling), Nb 96 (Nb with highest affinity). and an anti-albumin Nb, linked to each other with flexible (G4-S)3 linkers. As shown in Fig. 4D, linking the C-terminal end of an anti-albumin Nb to the N-terminal end of Nb 70 and its C-terminal end to the N-terminal end of Nb 96 might increase the inhibitory activity of the resulting TROS Nb. Based on the docking model, the flexible linker between Nb 70 and Nb 96 goes through the different chains of trimeric hTNFR1, disturbing its interaction with TNF even more, which might lead to a Nb with better inhibition capacities. Also, the docking model predicts that the anti-albumin Nb would not disturb the binding of the two other Nbs to hTNFR1 because, based on the location of the linkers in the docking models, it is directed away from the receptor.
To construct TROS, the different VHH building blocks were cloned in the pHEN6c vector, with the anti-albumin VHH gene at the N-terminal end and the His6 tag at the C-terminal end (Fig. 1C). Next, because of the low yield of TROS in the prokaryotic WK6 E. coli system, we switched to the yeast P. pastoris (Strain GS115), which expresses correctly folded proteins and has a higher yield (40). To obtain expression in P. pastoris, TROS was subcloned into the pAOXZalfa vector using a three-point ligation. Expression of TROS in P. pastoris indeed resulted in a higher yield (43 mg starting from 6 liters of culture) compared with expression in E. coli (105 μg starting from 10 liters of culture). Similarly, the P. pastoris expression system was also used to express a trivalent control Nb, Nb Alb-Ctrl-Ctrl, which combines the anti-albumin binding Nb with two cAbBcII10 Nbs connected by the flexible (G4-S)3 linker.
In Vitro Characterization of Binding and Inhibition Properties of TROS
The avidity of the trivalent TROS is higher than that of the monovalent Nbs, which might lead to increased affinity. Additionally, changing the expression system from E. coli to P. pastoris might alter the affinity due to changes in protein folding, which thus can lead to altered protein characteristics. Therefore, we characterized TROS affinity by ELISA and SPR. In parallel, we studied the albumin binding properties of TROS and Nb Alb-Ctrl-Ctrl to confirm the functionality of the anti-albumin Nb module after combining it with two other Nbs. As depicted in Fig. 5A, TROS binds to hTNFR1 with a nanomolar affinity (Kd 0.1151 nm), which is strongly increased in the multivalent format compared with the monovalent Nbs ((G4-S)3 Nb 70 7.709 nm and Kd Nb 96 4.158 nm) (Table 1). Fig. 5B confirms the albumin binding capacity of the anti-albumin Nb in TROS and Nb Alb-Ctrl-Ctrl (Kd TROS 0.6147 nm and Kd Nb Alb-Ctrl-Ctrl 0.1015 nm versus Kd Nb Alb 0.1225 nm).
FIGURE 5.

A–D, binding affinity of nanobodies to hTNFR1 and albumin, cross-reactivity to mTNFR1, and hTNFR2 determined with ELISA. In all ELISAs, a 0.2 serial dilution of Nb was applied starting from 1 μm (and 850 nm in hTNFR2 ELISA). A, TROS and hTNFR1 Ab bind with equal affinities to hTNFR1, and affinities of Nb 96 and Nb 70 for hTNFR1 are lower. Generation of a multivalent Nb increased the affinity significantly. B, albumin binding was preserved in TROS and Nb Alb-Ctrl-Ctrl in comparison with Nb Alb. C–D, no cross-reactivity to mTNFR1 (C) or hTNFR2 (D) was observed for TROS, whereas hTNFR1 Ab did to mTNFR1 and hTNFR2. Nb Alb-Ctrl-Ctrl, an irrelevant control Nanobody; hTNFR1 Ab, a human TNFR1 antibody, positive control. 50%, Nanobody concentration that binds 50% of hTNFR1 or albumin. All ELISAs were done in triplicate, and data are represented as mean ± S.E.
We conducted a new SPR experiment to confirm the increased affinity of TROS relative to the monomeric Nbs. As shown in Fig. 6A, TROS shows rapid kinetics of association (ka) to immobilized hTNFR1, which is consistent with the results obtained with monovalent Nb 70 and Nb 96. Additionally, although Nb 70 and Nb 96 have high dissociation rates (kd), the trivalent Nb had a greatly improved kd value, which enhances the overall equilibrium constant (KD). The KD of TROS is two times lower than that of Nb 96 and more than six times lower compared with Nb 70 (Table 1). SPR was conducted with hTNFR1 Ab as a positive control, which has higher avidity and therefore a very low KD (data not shown).
FIGURE 6.

A–D, surface plasmon resonance affinity measurement and competition studies with TROS on immobilized hTNFR1 and inhibition of TNF/TNFR1 and LTa/TNFR1 signaling in HEK-2 blue cells. A, surface plasmon resonance sensorgram of TROS on immobilized hTNFR1. The adjusted sensorgram overlays show binding of TROS applied in a dilution series ranging from 500 to 1.95 nm to immobilized hTNFR1, and dotted lines show global fitting of the binding data to a bivalent fitting model. TROS has a low KD value and therefore a high affinity. B, competition assays performed by SPR between TROS and TNF, applied in equal amounts (1 μm), show that TROS and TNF compete and therefore bind the same epitope of hTNFR1. The arrow indicates when the two components are applied together. C and D, HEK-2 blue inhibition assay with TROS and monovalent equivalents, in which cells were preincubated with a serial Nb dilution starting at 5000 nm. TROS inhibits TNF signaling through TNFR1 more strongly than the monovalent Nbs (C). TROS also inhibits LTa signaling through TNFR1, but hTNFR1 Ab does not (D). Nb Alb-Ctrl-Ctrl, an irrelevant control Nanobody; hTNFR1 Ab, a human TNFR1 antibody, positive control; 50%, Nanobody concentration by which 50% of the maximal TNFR1 activity is inhibited. Surface plasmon resonance analyses were performed in duplicate. The HEK-2 blue assays were performed in triplicate; data represent means ± S.E.
Next, we studied the inhibitory activity of TROS. HEK-2 blue cells were incubated with TROS and subsequently triggered with TNF. TROS strongly inhibited TNF/TNFR1 signaling (Fig. 6C), resulting in an IC50 of 0.3235 μm, which is 12-fold higher than the IC50 of Nb 70 (4.144 μm) (summarized in Table 2).
TABLE 2.
IC50 value of TROS and Nb 70, after incubation of HEK-2 blue cells with TNF or LTa, and IC50 value of TROS for inhibition of TNF-induced NF-κB-related genes and chemokines in HEK293T-cells
ND means not determined.
| HEK-2 blue inhibition |
Inhibition of TNF-induced expression HEKT293T cells |
Inhibition of TNF-induced chemokine secretion HEK293T cells, IL8 | |||||
|---|---|---|---|---|---|---|---|
| TNF | LTa | A20 | IL8 | TNF | IκBα | ||
| nm | nm | nm | nm | nm | nm | nm | |
| Nb 70 | 4144 | 220 | ND | ND | ND | ND | ND |
| TROS | 323.5 | 150 | 196.7 | 130.1 | 204.5 | 199.3 | 176.1 |
Not only TNF but also LTa binds TNFR1 and signal through it. Therefore, we tested the effect of TROS on LTa/TNFR1 signaling using the HEK-2 blue assay. Interestingly, preincubation with TROS or Nb 70 inhibited the LTa/TNFR1 signaling, in contrast to the hTNFR1 Ab (Fig. 6D). Finally, in agreement with the known high specificity of Nbs, we excluded by ELISA any cross-reactivity with mouse TNFR1 (mTNFR1) and human TNFR2 (hTNFR2). As shown in Fig. 5, C and D, TROS does not cross-react with mTNFR1 or hTNFR2, in contrast to the hTNFR1 Ab, which also binds to hTNFR2 and mTNFR1.
Competition between TROS and TNF
Assays of competition between TNF and the monovalent Nbs using SPR revealed that Nb 70 competes with TNF for binding to hTNFR1. Because TROS is three times larger than the monovalent Nbs, steric hindrance might increase or decrease this competition. So we examined by SPR analysis whether this competition was maintained after the generation of TROS. TROS and TNF were added consecutively and in reverse order at saturating concentrations (1 μm), and competition between the two molecules for binding to hTNFR1 was assessed. The sensorgram in Fig. 6B confirms that TROS competes with TNF for binding to hTNFR1. A hTNFR1 Ab used as a positive control also competes with TNF for hTNFR1 binding (data not shown).
Analysis of the Serum Half-life of TROS
Serum half-life of TROS was determined after a single intravenous (i.v.) injection of 100 μg and a single intraperitoneal (i.p.) injection of 200 μg of TROS in wild type C57BL/6J mice. Blood was taken at various time points for 8 consecutive days, and serum concentrations of TROS were determined using hTNFR1 ELISA. After i.v. injection, TROS shows a biphasic elimination, starting with a distribution and elimination phase that quickly decreases serum TROS concentration, followed by slower elimination from the circulation. Because of the presence of the anti-albumin binding Nb, the serum half-life of TROS is about 24 h, which is significantly longer than the serum half-life of monovalent Nbs (about 1.5 h) (Fig. 7A) (41). After intraperitoneal injection, TROS is absorbed through the peritoneum into the bloodstream (absorption phase), and TROS serum levels reach a maximal concentration (Cmax) of 92 μg/ml after 10 h (Fig. 7B). Once Cmax is reached, TROS shows similar elimination kinetics compared with i.v.-injected TROS, starting with a quick decrease in serum concentrations followed by a more slower elimination. The serum half-life of TROS after intraperitoneal injection is ∼30 h.
FIGURE 7.
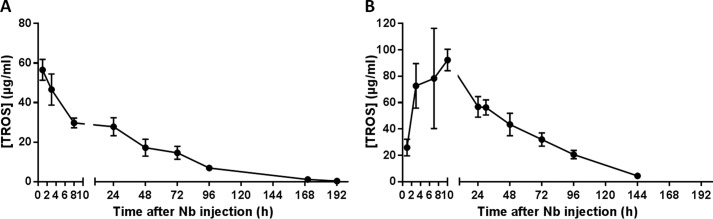
A and B, serum half-life of TROS. A, serum half-life of TROS was determined after a single i.v. injection of 100 μg of TROS in wild type C57BL/6J mice (n = 8). Serum concentrations were determined by ELISA. TROS has a Cmax of ∼60 μg/ml and has a biphasic elimination. The half-life of TROS (t½) is ∼24 h. B, serum half-life of TROS was determined after a single intraperitoneal injection of 200 μg of TROS in wild type C57BL/6J mice (n = 8). Serum concentrations were determined by ELISA. TROS first shows an absorption phase and after 10 h reaches a Cmax of ∼92 μg/ml. Next, TROS is eliminated from the circulation and has a biphasic elimination. The t½ is ∼30 h. Data represent mean ± S.E.
In Vitro Antagonistic Activity of TROS in HEK293T Cells
We further investigated the inhibitory effect of TROS in HEK293T cells by determining the TNF-induced expression of IL8, A20 (TNFAIP3), IκBα, and TNF and IL8 secretion in the presence or absence of 1 μm TROS, and we compared it with the effects of ETA. Incubation with 1000 IU/ml TNF strongly induced gene expression of all tested genes after 6 h and resulted in high IL8 levels in the cell supernatant after 24 h, reaching levels of about 120 pg/ml (data not shown). Preincubation with 1 μm TROS or ETA significantly prevented the up-regulation of all genes tested and resulted in a large reduction of IL8 in the supernatant of HEK293T cells relative to Nb Alb-Ctrl-Ctrl (data not shown). Interestingly, the addition of 1 μm TROS or ETA, 30 min after TNF was applied, could significantly reduce the IL8 and TNF up-regulation as shown in Fig. 8, A and B (other data not shown). In this experimental setup, the efficacy of TROS did not differ significantly with the efficacy of ETA. Preincubation of HEK293T cells with different concentrations of TROS (Figs. 8C and 9D, and other data not shown) showed that this inhibition was dose-dependent with IC50 values of 130.1 nm for inhibition of IL8 gene expression up-regulation and 176.1 nm for inhibition of IL8 secretion. Table 2 summarizes the IC50 values for the other genes tested.
FIGURE 8.

A–D, inhibition of TNF-induced inflammation in HEK293T cells by TROS. A and B, inhibition of TNF-induced up-regulation of IL8 and TNF by TROS and ETA in HEK293T cells relative to Nb Alb-Ctrl-Ctrl. HEK293T cells were first stimulated with hTNF (1000 IU/ml) and after 30 min incubated with 1 μm TROS or ETA for 6 h. C and D, to determine the IC50 value of TROS, a dose-response experiment was performed with TROS concentrations ranging from 0.01 to 1 μm. TROS was preincubated for 30 min, and subsequently 1000 IU/ml TNF was applied. IL8 and TNF expression after 6 h was determined by qPCR, and IL8 levels in supernatant were determined with Bio-Plex after 24 h. Ctrl, Nb Alb-Ctrl-Ctrl, an irrelevant control Nanobody. *, 0.01 ≤ p < 0.05; **, 0.001 ≤ p < 0.01; ***, 0.001 ≤ p 0.0001; ****, p < 0.0001. The experiment was done in triplicate and data represent mean ± S.E. qPCR data were normalized to stable housekeeping genes.
FIGURE 9.

A–F, inhibition of inflammation in human inflamed colonic biopsies. Inflamed colonic biopsies were obtained from patients suffering from active Crohn disease. Incubation with TROS for 24 h reduced the initial inflammatory expression of IL6 (A), IL8 (B), and TNF (C), in comparison with Nb Alb-Ctrl-Ctrl. This was also reflected in the supernatant, resulting in reduced IL6 (D), IL8 (E), and TNF (F) secretion. Nb Alb-Ctrl-Ctrl, an irrelevant control Nanobody. qPCR data were normalized to stable housekeeping genes. The connected lines represent data from the same patient. Data were analyzed using a paired t test.
Ex Vivo Inhibition of Inflammation in Biopsies of Inflamed Human Colon
Two biopsies were isolated from the same inflamed region of the colon from patients having acute Crohn disease. The biopsies were cultured ex vivo, one with TROS and the other with Nb Alb-Ctrl-Ctrl followed by mRNA and supernatant isolation. Biopsies from inflamed regions already showed an inflammatory signature, reflected in high IL8, IL6, and TNF expression and IL8, IL6, and TNF secretion. Incubation with TROS resulted in a substantial decrease in IL8, IL6, and TNF mRNA expression compared with incubation with Nb Alb-Ctrl-Ctrl (Fig. 9, A–C). This was also reflected in decreased secretion of these mediators in the supernatant (Fig. 9, D–F).
In Vivo Inhibition of TNF-induced Liver Inflammation in Mice
Finally, we analyzed the efficacy of TROS in an in vivo mouse model of acute TNF-induced liver toxicity (42). TROS binds and inhibits only human TNFR1 without cross-reacting with mouse TNFR1, so we used transgenic uPA+/+-SCID mice of which the liver is repopulated with primary human hepatocytes (humanized mice) (32). Because the mice used in this study displayed ∼40–60% of liver humanization, we generated qPCR primers that specifically amplify the human genes but not their mouse equivalents. Humanized mice were injected with TNF (6.7 mg/kg) in the presence or absence of TROS pretreatment (200 μg TROS, 30 min before TNF injection), and livers were isolated 2 h later. TNF injection resulted in increased expression of human IL8, ICAM, VCAM, and A20 in the liver and up-regulation of serum IL6 levels (Fig. 10, A and B, and other data not shown). Pretreatment with TROS (13.35 mg/kg, injected intraperitoneally) significantly reduced both liver inflammation (reflected by a decrease in IL8, ICAM, VCAM, and A20 mRNA expression) and systemic inflammation (reflected in a TROS-dependent reduction in TNF-induced human IL6 in serum) (Fig. 10, A and B, and other data not shown).
FIGURE 10.
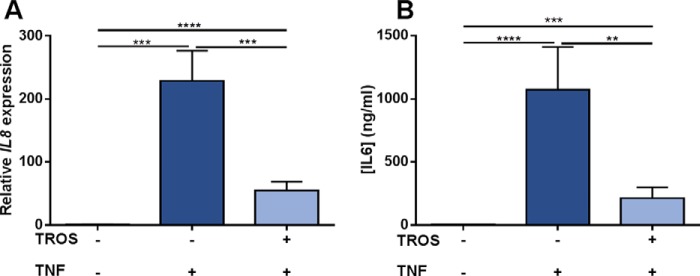
A and B, inhibition of acute TNF-induced liver inflammation by TROS in humanized transgenic mice. TNF (6.7 mg/kg) was injected in uPA+/+-SCID mice with partially humanized liver (n = 9) pretreated with vehicle. This resulted in a significant increase of human IL8 expression in liver (A) and human IL6 levels (B) in serum after 2 h compared with mice injected with vehicle only (n = 6). Pretreatment with TROS (13.35 mg/ml) (n = 10) significantly antagonized inflammation in liver and serum. Data represent mean ± S.E., and statistical significances were calculated using an unpaired t test, comparing differences between vehicle only versus vehicle/TNF versus TROS/TNF. qPCR data were normalized to stable housekeeping genes.
DISCUSSION
Current TNF inhibitors, including the biologicals IFX, ADA, certolizumab pegol, and ETA, are extensively used to treat diseases such as inflammatory bowel disease, psoriasis, and RA, and they are very useful for patients with active disease failing to respond to conventional therapy. Unfortunately, these biologicals are very expensive, and some patients suffer from side effects. Additionally, despite their efficacy for RA and inflammatory bowel disease, a major issue in treatment with TNF inhibitors is the lack of (enough) primary response in both diseases (43). Clinical studies on the use of IFX, ADA, and certolizumab pegol for inflammatory bowel disease reported a response rate of about 70% of the patients to initial treatment, but only about 30% of them achieved clinical remission (44). This highlights the urgent need for new therapies with better outcome and response rates. In light of this, specific TNFR1 targeting might be a better approach than complete TNF inhibition (3).
Here, we describe the development of TROS, a TNFR1 antagonist based on Nb technology. Nbs consist of only one single variable domain (VHH), derived from heavy-chain-only antibodies of Camelidae, in which they can be easily generated by immunization. These small recombinant molecules of 15 kDa offer many advantages over the generally used antibodies (Abs) or antibody fragments (Fab fragments) (20). To generate hTNFR1-specific Nbs, we immunized alpacas with hTNFR1 and subsequently identified eight different Nbs. These Nbs were produced in large quantities in the economical E. coli and P. pastoris expression systems (19). This stresses another important advantage of Nbs compared with the available anti-TNF therapies, which are mainly expensive biologicals that impose a heavy financial burden (45). Binding and inhibition experiments revealed that Nb 96 and Nb 70 have strong affinity for hTNFR1, but only Nb 70 effectively inhibited hTNFR1. Nb 96 and Nb 70 have different binding epitopes because only Nb 70 competed with TNF for hTNFR1 binding. This was confirmed with a predictive docking model, which showed that the epitope region of Nb 70 at least partially overlaps with the TNF-binding site, located mainly in CRD2 and CRD3 (46). Finally, when the two Nbs were simultaneously docked to hTNFR1, they bound different chains of the trimeric hTNFR1 without disturbing each other.
Nbs, encoded by a single exon, are very modular and can be combined to form multispecific and multivalent proteins (47). Consequently, we linked Nb 70 to Nb 96 with a flexible (G4-S)3 linker. Remarkably, modeling the binding of Nb 70 and Nb 96 to hTNFR1 revealed that the (G4-S)3 linker passes through the three chains of hTNFR1, which might hinder the interaction of TNF with TNFR1, and increases TNFR1 inhibition. Indeed, we demonstrated that the generation of TROS resulted in a 13-fold higher inhibitory capacity compared with the monovalent Nb 70. In vitro, we further showed that TROS effectively inhibits TNF-induced gene expression of IL8, IκBα, and TNF as well as IL8 secretion in both a prophylactic as a therapeutic setup and in a dose-dependent manner with an IC50 of about 200 nm. Interestingly, TROS inhibited TNF-induced inflammation to the same extent as Etanercept. The generation of this trivalent Nb also improved binding kinetics because TROS had higher affinities than its monovalent equivalents.
The large size of conventional Abs (about 150 kDa) limits tissue penetration and binding to small receptor pockets, whereas Nbs show good tissue penetration. Conversely, the small size of mono- and bivalent Nbs limits their half-life to about 1.5 h (47). To overcome this limitation, we linked Nb 96 and Nb 70 to a Nb that binds serum albumin (48) to generate Nb Alb-70-96 (TROS). This extended the half-life to 24 and 30 h after i.v. and i.p. injection, respectively, which correlates with the half-life of murine serum albumin (1.07–1.6 days). Translation of the Nb in humans will further extend its half-life to about 19 days (49). The presence of the anti-albumin Nb could have another advantage, it might direct the Nb to regions of inflammation because albumin tends to accumulate there (50, 51).
Nbs are known to be very specific, and in vitro analysis excluded cross-reactivity with human TNFR2 and mouse TNFR1 because their extracellular parts share 28 and 71% sequence homology with that of human TNFR1 (2, 53). This might be a strong advantage of TROS compared with the available anti-TNF biological, which inhibits both TNFR1 and TNFR2 signaling. Indeed, it has been shown in the collagen-induced arthritis murine model of RA that disease severity is reduced in TNFR1-deficient mice (54), whereas TNF-driven arthritis is aggravated in TNFR2-deficient mice (55, 56). Selective TNFR1 inhibition blocks inflammation by enabling Tregs to suppress IL17 production, and it promotes Treg activity via TNFR2 signaling (57, 58). Also in CD, murine and human data point to an important role for Tregs, the suppressive functions of which are attributed to TNFR2 (59, 60). Indeed, in mice Tregs are critical for maintaining intestinal tolerance to luminal antigens and for preventing intestinal inflammation (61). Moreover, untreated CD patients have fewer or dysfunctional Tregs at the site of inflammation (61–63). Selective TNFR1 inhibition could ignore specific TNF/TNFR2 signaling to boost Treg responses, and this might prove to be an effective new approach for patients not responding to anti-TNF treatment.
Interestingly, a HEK-2 blue cell assay revealed that TROS inhibits not only TNF/TNFR1 signaling but also LTa/TNFR1 signaling, whereas a commercially available hTNFR1 Ab does not. This property is again an advantage over the current anti-TNF therapies, because none of them, except Etanercept, bind LTa and block its signaling (64, 65). Additionally, papers suggest that LTa inhibition has value in the treatment of autoimmune diseases because LTa/TNFR1 signaling may lead to inflammation (66). The pro-inflammatory role of LTa has been shown in animal models of RA and multiple sclerosis (67, 68). For example, an RA patient was unresponsive to IFX anti-TNF therapy but switching to ETA, which also inhibits LTa, resulted in clinical remission, suggesting that in patients who are anti-TNF-resistant, it is not TNF but LTa signaling through TNFR1 that is the predominant cytokine (67).
In a more clinically relevant approach, acutely inflamed colon biopsies obtained from CD patients were cultured ex vivo and incubated with TROS. This led to reduction of the inflammatory signature compared with incubation with Nb Alb-Ctrl-Ctrl, as reflected in reduced expression of IL8, IL6, and TNF, which are known mediators of CD and are also considered as inflammation biomarkers. Interestingly, TNF is also considered the major inducer of IL8 and IL6 in RA, so TROS might be a valuable alternative to the available TNF antagonists (69, 70). Finally, we demonstrated in vivo the functionality of TROS during acute TNF toxicity in the human liver chimeric uPA+/+-SCID mouse model (32). We showed that intraperitoneal administration of TROS selectively antagonized the effects of TNF, as reflected in reduced expression of human IL8, ICAM, and VCAM. In agreement with this, human IL6 serum levels were also significantly reduced in the presence of TROS, further proving the inhibitory activity of TROS. In the long term, it will be important to compare the effects of TROS with the effects of other commercial and clinically used TNF antagonists, such as IFX, ADA, and ETA in vivo using humanized mouse models.
Importantly, even if TROS were to be less effective than or equally effective to the available TNF antagonists, it might overcome another of their disadvantages. Indeed, several CD or RA patients become unresponsive over time (6, 16, 71, 72) as follows: between 23 and 46% for IFX and ADA in CD patients and ∼50% of RA patients receiving IFX (43, 73). In both diseases, secondary unresponsiveness is often associated with the development of anti-drug antibodies, because biological drugs may elicit immune reactions. Those anti-drug antibodies can nullify the therapeutic effect by neutralizing the drug or enhancing its clearance (74, 75). They might also cause fatal hypersensitivity reactions (76). Nbs can overcome this serious problem because they are suspected of being less immunogenic than conventional Abs, due to their high sequence homology with the human conventional VH framework regions (80–90%) and high conformational stability. By making a few amino acid substitutions in the framework region, they can be humanized even further (47, 77, 78).
Finally, a TNFR1-specific antagonist might also be useful for diseases in which anti-TNF treatment is ineffective or even exacerbates the disease, such as multiple sclerosis (79, 80). In a multiple sclerosis mouse model (experimental autoimmune encephalomyelitis), disease development was delayed in TNFR1 knock-out (KO) mice, in contrast to TNFR2 KO mice that developed a more severe and chronic disease (81, 82). Thus, again, TNFR1 was found to be responsible for the detrimental signals, although TNFR2 was essential for resolving inflammation and initiating repair (82). Furthermore, TNFR1 neutralization may indirectly stimulate TNF/TNFR2 signaling in the experimental autoimmune encephalomyelitis lesions, which subsequently promotes remyelination in chemically induced demyelination (83). In addition, type I diabetes and systemic lupus erythematosus might also depend on the immunomodulating TNF/TNFR2 signaling for protection or recovery (52, 84). Other diseases that can benefit from exclusive TNFR1 inhibition have been reviewed (3).
In conclusion, we describe for the first time the development of a trivalent Nanobody (Nb Alb-70-96, named TROS) that selectively binds and inhibits the TNF/TNFR1 signaling pathway. TROS is strongly expressed in the economical P. pastoris expression system, has an acceptable half-life in mice, and has Kd and IC50 values in the nanomolar range. We show the robust inhibitory actions of TROS in vitro, ex vivo, and in vivo. In vitro, TROS reduced TNF-induced NF-κB gene expression in a dose-dependent manner. In ex vivo human colon biopsies, TROS reduced colon inflammation, and in an in vivo system of transgenic humanized mice, TROS antagonized inflammation in a model of acute TNF-induced shock.
Acknowledgments
We thank the VIB Nanobody Service Facility for the generation of the nanobodies; Joke Vanden Berghe and Lieven Verhoye for technical assistance related to breeding and generation of the mice; and Dr. Amin Bredan for editing the manuscript.
This work was supported by the Agency for Innovation by Science and Technology in Flanders, the Research Council of Ghent University, the Research Foundation Flanders (FWO Vlaanderen), and Interuniversity Attraction Poles Program of the Belgian Science Policy Grants IAP-VI-18 and IAP-VII-47.
- TNFR
- TNF receptor
- Nb
- Nanobody
- CDR
- complementarity determining region
- CD
- Crohn disease
- RA
- rheumatoid arthritis
- LTa
- lymphotoxin-α
- PDB
- Protein Data Bank
- IFX
- infliximab
- ETA
- etanercept
- ADA
- adalimumab
- SPR
- surface plasmon resonance
- hTNFR
- human TNFR
- mTNFR
- mouse TNFR
- Ab
- antibody
- qPCR
- quantitative PCR.
REFERENCES
- 1. Wajant H., Pfizenmaier K., Scheurich P. (2003) Tumor necrosis factor signaling. Cell Death Differ. 10, 45–65 [DOI] [PubMed] [Google Scholar]
- 2. MacEwan D. J. (2002) TNF ligands and receptors–a matter of life and death. Br. J. Pharmacol. 135, 855–875 [DOI] [PMC free article] [PubMed] [Google Scholar]
- 3. Van Hauwermeiren F., Vandenbroucke R. E., Libert C. (2011) Treatment of TNF mediated diseases by selective inhibition of soluble TNF or TNFR1. Cytokine Growth Factor Rev. 22, 311–319 [DOI] [PubMed] [Google Scholar]
- 4. Aggarwal B. B. (2003) Signalling pathways of the TNF superfamily: a double-edged sword. Nat. Rev. Immunol. 3, 745–756 [DOI] [PubMed] [Google Scholar]
- 5. Faustman D., Davis M. (2010) TNF receptor 2 pathway: drug target for autoimmune diseases. Nat. Rev. Drug Discov. 9, 482–493 [DOI] [PubMed] [Google Scholar]
- 6. Verweij C. L. (2009) Predicting the future of anti-tumor necrosis factor therapy. Arthritis Res. Ther. 11, 115. [DOI] [PMC free article] [PubMed] [Google Scholar]
- 7. Esters N., Vermeire S., Joossens S., Noman M., Louis E., Belaiche J., De Vos M., Van Gossum A., Pescatore P., Fiasse R., Pelckmans P., Reynaert H., Poulain D., Bossuyt X., Rutgeerts P., and Belgian Group of Infliximab Expanded Access Program in Crohn's, Disease. (2002) Serological markers for prediction of response to anti-tumor necrosis factor treatment in Crohn's disease. Am. J. Gastroenterol. 97, 1458–1462 [DOI] [PubMed] [Google Scholar]
- 8. Kim S. Y., Solomon D. H. (2010) Tumor necrosis factor blockade and the risk of viral infection. Nat. Rev. Rheumatol. 6, 165–174 [DOI] [PMC free article] [PubMed] [Google Scholar]
- 9. Cleynen I., Vermeire S. (2012) Paradoxical inflammation induced by anti-TNF agents in patients with IBD. Nat. Rev. Gastroenterol. Hepatol. 9, 496–503 [DOI] [PubMed] [Google Scholar]
- 10. Fellermann K. (2013) Adverse events of tumor necrosis factor inhibitors. Dig. Dis. 31, 374–378 [DOI] [PubMed] [Google Scholar]
- 11. Kary S., Worm M., Audring H., Huscher D., Renelt M., Sörensen H., Ständer E., Maass U., Lee H., Sterry W., Burmester G. R. (2006) New onset or exacerbation of psoriatic skin lesions in patients with definite rheumatoid arthritis receiving tumour necrosis factor α antagonists. Ann. Rheum. Dis. 65, 405–407 [DOI] [PMC free article] [PubMed] [Google Scholar]
- 12. Vermeire S., Noman M., Van Assche G., Baert F., Van Steen K., Esters N., Joossens S., Bossuyt X., Rutgeerts P. (2003) Autoimmunity associated with anti-tumor necrosis factor α treatment in Crohn's disease: a prospective cohort study. Gastroenterology 125, 32–39 [DOI] [PubMed] [Google Scholar]
- 13. Katikireddi V. S., Whittle S. L., Hill C. L. (2010) Tumour necrosis factor inhibitors and risk of serious infection in rheumatoid arthritis. Int. J. Rheum. Dis. 13, 12–26 [DOI] [PubMed] [Google Scholar]
- 14. Chung E. S., Packer M., Lo K. H., Fasanmade A. A., Willerson J. T., and Anti-TNF Therapy Against Congestive Heart Failure Investigators (2003) Randomized, double-blind, placebo-controlled, pilot trial of infliximab, a chimeric monoclonal antibody to tumor necrosis factor-α, in patients with moderate-to-severe heart failure: results of the anti-TNF Therapy Against Congestive Heart Failure (ATTACH) trial. Circulation 107, 3133–3140 [DOI] [PubMed] [Google Scholar]
- 15. Cohen M., Baldin B., Thomas P., Lebrun C. (2012) Neurological adverse events under anti-TNF α therapy. Revue Neurologique 168, 33–39 [DOI] [PubMed] [Google Scholar]
- 16. Atzeni F., Talotta R., Salaffi F., Cassinotti A., Varisco V., Battellino M., Ardizzone S., Pace F., Sarzi-Puttini P. (2013) Immunogenicity and autoimmunity during anti-TNF therapy. Autoimmun. Rev. 12, 703–708 [DOI] [PubMed] [Google Scholar]
- 17. Rosenblum H., Amital H. (2011) Anti-TNF therapy: safety aspects of taking the risk. Autoimmun. Rev. 10, 563–568 [DOI] [PubMed] [Google Scholar]
- 18. Hamers-Casterman C., Atarhouch T., Muyldermans S., Robinson G., Hamers C., Songa E. B., Bendahman N., Hamers R. (1993) Naturally occurring antibodies devoid of light chains. Nature 363, 446–448 [DOI] [PubMed] [Google Scholar]
- 19. Muyldermans S. (2013) Nanobodies: natural single-domain antibodies. Annu. Rev. Biochem. 82, 775–797 [DOI] [PubMed] [Google Scholar]
- 20. Siontorou C. G. (2013) Nanobodies as novel agents for disease diagnosis and therapy. Int. J. Nanomedicine 8, 4215–4227 [DOI] [PMC free article] [PubMed] [Google Scholar]
- 21. Els Conrath K., Lauwereys M., Wyns L., Muyldermans S. (2001) Camel single-domain antibodies as modular building units in bispecific and bivalent antibody constructs. J. Biol. Chem. 276, 7346–7350 [DOI] [PubMed] [Google Scholar]
- 22. Saerens D., Kinne J., Bosmans E., Wernery U., Muyldermans S., Conrath K. (2004) Single domain antibodies derived from dromedary lymph node and peripheral blood lymphocytes sensing conformational variants of prostate-specific antigen. J. Biol. Chem. 279, 51965–51972 [DOI] [PubMed] [Google Scholar]
- 23. Conrath K. E., Lauwereys M., Galleni M., Matagne A., Frère J. M., Kinne J., Wyns L., Muyldermans S. (2001) β-Lactamase inhibitors derived from single-domain antibody fragments elicited in the camelidae. Antimicrob. Agents Chemother. 45, 2807–2812 [DOI] [PMC free article] [PubMed] [Google Scholar]
- 24. Skerra A., Plückthun A. (1988) Assembly of a functional immunoglobulin Fv fragment in Escherichia coli. Science 240, 1038–1041 [DOI] [PubMed] [Google Scholar]
- 25. Ablynx (September 7, 2007) WO Patent 2008/028977 A2
- 26. Schoonooghe S., Leoen J., Haustraete J. (2012) Production of antibody derivatives in the methylotrophic yeast Pichia pastoris. Methods Mol. Biol. 907, 325–340 [DOI] [PubMed] [Google Scholar]
- 27. Sali A., Blundell T. L. (1993) Comparative protein modelling by satisfaction of spatial restraints. J. Mol. Biol. 234, 779–815 [DOI] [PubMed] [Google Scholar]
- 28. Larsson P., Wallner B., Lindahl E., Elofsson A. (2008) Using multiple templates to improve quality of homology models in automated homology modeling. Protein Sci. 17, 990–1002 [DOI] [PMC free article] [PubMed] [Google Scholar]
- 29. Lovell S. C., Davis I. W., Arendall W. B., 3rd, de Bakker P. I., Word J. M., Prisant M. G., Richardson J. S., Richardson D. C. (2003) Structure validation by Cα geometry: φ,ψ and Cβ deviation. Proteins 50, 437–450 [DOI] [PubMed] [Google Scholar]
- 30. Kozakov D., Beglov D., Bohnuud T., Mottarella S. E., Xia B., Hall D. R., Vajda S. (2013) How good is automated protein docking? Proteins 81, 2159–2166 [DOI] [PMC free article] [PubMed] [Google Scholar]
- 31. Vandesompele J., De Preter K., Pattyn F., Poppe B., Van Roy N., De Paepe A., Speleman F. (2002) Accurate normalization of real-time quantitative RT-PCR data by geometric averaging of multiple internal control genes. Genome Biol. 3, RESEARCH0034. [DOI] [PMC free article] [PubMed] [Google Scholar]
- 32. Meuleman P., Leroux-Roels G. (2008) The human liver-uPA-SCID mouse: a model for the evaluation of antiviral compounds against HBV and HCV. Antiviral Res. 80, 231–238 [DOI] [PubMed] [Google Scholar]
- 33. Vandesompele J., De Preter K., Pattyn F., Poppe B., Van Roy N., De Paepe A., Speleman F. (2002) Accurate normalization of real-time quantitative RT-PCR data by geometric averaging of multiple internal control genes. Genome Biol. 3, RESEARCH0034. [DOI] [PMC free article] [PubMed] [Google Scholar]
- 34. Tateno C., Yoshizane Y., Saito N., Kataoka M., Utoh R., Yamasaki C., Tachibana A., Soeno Y., Asahina K., Hino H., Asahara T., Yokoi T., Furukawa T., Yoshizato K. (2004) Near completely humanized liver in mice shows human-type metabolic responses to drugs. Am. J. Pathol. 165, 901–912 [DOI] [PMC free article] [PubMed] [Google Scholar]
- 35. Arbabi Ghahroudi M., Desmyter A., Wyns L., Hamers R., Muyldermans S. (1997) Selection and identification of single domain antibody fragments from camel heavy-chain antibodies. FEBS Lett. 414, 521–526 [DOI] [PubMed] [Google Scholar]
- 36. Desmyter A., Transue T. R., Ghahroudi M. A., Thi M. H., Poortmans F., Hamers R., Muyldermans S., Wyns L. (1996) Crystal structure of a camel single-domain VH antibody fragment in complex with lysozyme. Nat. Struct. Biol. 3, 803–811 [DOI] [PubMed] [Google Scholar]
- 37. Arnold K., Bordoli L., Kopp J., Schwede T. (2006) The SWISS-MODEL workspace: a web-based environment for protein structure homology modelling. Bioinformatics 22, 195–201 [DOI] [PubMed] [Google Scholar]
- 38. Wajant H., Scheurich P. (2011) TNFR1-induced activation of the classical NF-κB pathway. FEBS J. 278, 862–876 [DOI] [PubMed] [Google Scholar]
- 39. Chuang V. T., Maruyama T., Otagiri M. (2009) Updates on contemporary protein binding techniques. Drug Metab. Pharmacokinet. 24, 358–364 [DOI] [PubMed] [Google Scholar]
- 40. Cregg J. M., Cereghino J. L., Shi J., Higgins D. R. (2000) Recombinant protein expression in Pichia pastoris. Mol. Biotechnol. 16, 23–52 [DOI] [PubMed] [Google Scholar]
- 41. Cortez-Retamozo V., Lauwereys M., Hassanzadeh Gh G., Gobert M., Conrath K., Muyldermans S., De Baetselier P., Revets H. (2002) Efficient tumor targeting by single-domain antibody fragments of camels. Int. J. Cancer 98, 456–462 [DOI] [PubMed] [Google Scholar]
- 42. Heyninck K., Wullaert A., Beyaert R. (2003) Nuclear factor-κB plays a central role in tumour necrosis factor-mediated liver disease. Biochem. Pharmacol. 66, 1409–1415 [DOI] [PubMed] [Google Scholar]
- 43. Ben-Horin S., Chowers Y. (2011) Review article: loss of response to anti-TNF treatments in Crohn's disease. Aliment. Pharmacol. Ther. 33, 987–995 [DOI] [PubMed] [Google Scholar]
- 44. Panés J., Ghosh S. (2007) The classics in perspective. Gut 56, 1184–1186 [DOI] [PMC free article] [PubMed] [Google Scholar]
- 45. Schabert V. F., Watson C., Joseph G. J., Iversen P., Burudpakdee C., Harrison D. J. (2013) Costs of tumor necrosis factor blockers per treated patient using real-world drug data in a managed care population. J. Manag. Care Pharm. 19, 621–630 [DOI] [PMC free article] [PubMed] [Google Scholar]
- 46. Banner D. W., D'Arcy A., Janes W., Gentz R., Schoenfeld H. J., Broger C., Loetscher H., Lesslauer W. (1993) Crystal structure of the soluble human 55 kd TNF receptor-human TNF β complex: implications for TNF receptor activation. Cell 73, 431–445 [DOI] [PubMed] [Google Scholar]
- 47. Coppieters K., Dreier T., Silence K., de Haard H., Lauwereys M., Casteels P., Beirnaert E., Jonckheere H., Van de Wiele C., Staelens L., Hostens J., Revets H., Remaut E., Elewaut D., Rottiers P. (2006) Formatted anti-tumor necrosis factor α VHH proteins derived from camelids show superior potency and targeting to inflamed joints in a murine model of collagen-induced arthritis. Arthritis Rheum. 54, 1856–1866 [DOI] [PubMed] [Google Scholar]
- 48. Dennis M. S., Zhang M., Meng Y. G., Kadkhodayan M., Kirchhofer D., Combs D., Damico L. A. (2002) Albumin binding as a general strategy for improving the pharmacokinetics of proteins. J. Biol. Chem. 277, 35035–35043 [DOI] [PubMed] [Google Scholar]
- 49. Dixon F. J., Maurer P. H., Deichmiller M. P. (1953) Half-lives of homologous serum albumins in several species. Proc. Soc. Exp. Biol. Med. 83, 287–288 [DOI] [PubMed] [Google Scholar]
- 50. Liu M., Huang Y., Hu L., Liu G., Hu X., Liu D., Yang X. (2012) Selective delivery of interleukine-1 receptor antagonist to inflamed joint by albumin fusion. BMC Biotechnol. 12, 68. [DOI] [PMC free article] [PubMed] [Google Scholar]
- 51. Wunder A., Müller-Ladner U., Stelzer E. H., Funk J., Neumann E., Stehle G., Pap T., Sinn H., Gay S., Fiehn C. (2003) Albumin-based drug delivery as novel therapeutic approach for rheumatoid arthritis. J. Immunol. 170, 4793–4801 [DOI] [PubMed] [Google Scholar]
- 52. Deng G. M., Liu L., Kyttaris V. C., Tsokos G. C. (2010) Lupus serum IgG induces skin inflammation through the TNFR1 signaling pathway. J. Immunol. 184, 7154–7161 [DOI] [PMC free article] [PubMed] [Google Scholar]
- 53. Milatovich A., Song K., Heller R. A., Francke U. (1991) Tumor necrosis factor receptor genes, TNFR1 and TNFR2, on human chromosomes 12 and 1. Somat. Cell Mol. Genet. 17, 519–523 [DOI] [PubMed] [Google Scholar]
- 54. Tada Y., Ho A., Koarada S., Morito F., Ushiyama O., Suzuki N., Kikuchi Y., Ohta A., Mak T. W., Nagasawa K. (2001) Collagen-induced arthritis in TNF receptor-1-deficient mice: TNF receptor-2 can modulate arthritis in the absence of TNF receptor-1. Clin. Immunol. 99, 325–333 [DOI] [PubMed] [Google Scholar]
- 55. Blüml S., Binder N. B., Niederreiter B., Polzer K., Hayer S., Tauber S., Schett G., Scheinecker C., Kollias G., Selzer E., Bilban M., Smolen J. S., Superti-Furga G., Redlich K. (2010) Antiinflammatory effects of tumor necrosis factor on hematopoietic cells in a murine model of erosive arthritis. Arthritis Rheum. 62, 1608–1619 [DOI] [PubMed] [Google Scholar]
- 56. Abu-Amer Y., Erdmann J., Alexopoulou L., Kollias G., Ross F. P., Teitelbaum S. L. (2000) Tumor necrosis factor receptors types 1 and 2 differentially regulate osteoclastogenesis. J. Biol. Chem. 275, 27307–27310 [DOI] [PubMed] [Google Scholar]
- 57. Aggarwal B. B. (2014) Balancing TNFR1 and TNFR2 jointly for joint inflammation. Arthritis Rheumatol. 66, 2657–2660 [DOI] [PubMed] [Google Scholar]
- 58. McCann F. E., Perocheau D. P., Ruspi G., Blazek K., Davies M. L., Feldmann M., Dean J. L., Stoop A. A., Williams R. O. (2014) Selective TNFR1 blockade is anti-inflammatory and reveals an immunoregulatory role for TNFR2. Arthritis Rheumatol. 66, 2728–2738 [DOI] [PubMed] [Google Scholar]
- 59. Housley W. J., Adams C. O., Nichols F. C., Puddington L., Lingenheld E. G., Zhu L., Rajan T. V., Clark R. B. (2011) Natural but not inducible regulatory T cells require TNF-α signaling for in vivo function. J. Immunol. 186, 6779–6787 [DOI] [PubMed] [Google Scholar]
- 60. Chen X., Wu X., Zhou Q., Howard O. M., Netea M. G., Oppenheim J. J. (2013) TNFR2 is critical for the stabilization of the CD4+Foxp3+ regulatory T. cell phenotype in the inflammatory environment. J. Immunol. 190, 1076–1084 [DOI] [PMC free article] [PubMed] [Google Scholar]
- 61. Boden E. K., Snapper S. B. (2008) Regulatory T cells in inflammatory bowel disease. Curr. Opin. Gastroenterol. 24, 733–741 [DOI] [PubMed] [Google Scholar]
- 62. Ricciardelli I., Lindley K. J., Londei M., Quaratino S. (2008) Anti-tumour necrosis α therapy increases the number of FOXP3+ regulatory T cells in children affected by Crohn's disease. Immunology 125, 178–183 [DOI] [PMC free article] [PubMed] [Google Scholar]
- 63. Ishikawa D., Okazawa A., Corridoni D., Jia L. G., Wang X. M., Guanzon M., Xin W., Arseneau K. O., Pizarro T. T., Cominelli F. (2013) Tregs are dysfunctional in vivo in a spontaneous murine model of Crohn's disease. Mucosal Immunol. 6, 267–275 [DOI] [PMC free article] [PubMed] [Google Scholar]
- 64. Neregård P., Krishnamurthy A., Revu S., Engström M., af Klint E., Catrina A. I. (2014) Etanercept decreases synovial expression of tumour necrosis factor-α and lymphotoxin-α in rheumatoid arthritis. Scand. J. Rheumatol. 43, 85–90 [DOI] [PubMed] [Google Scholar]
- 65. Mohler K. M., Torrance D. S., Smith C. A., Goodwin R. G., Stremler K. E., Fung V. P., Madani H., Widmer M. B. (1993) Soluble tumor necrosis factor (TNF) receptors are effective therapeutic agents in lethal endotoxemia and function simultaneously as both TNF carriers and TNF antagonists. J. Immunol. 151, 1548–1561 [PubMed] [Google Scholar]
- 66. Browning J. L. (2008) Inhibition of the lymphotoxin pathway as a therapy for autoimmune disease. Immunol. Rev. 223, 202–220 [DOI] [PubMed] [Google Scholar]
- 67. Calmon-Hamaty F., Combe B., Hahne M., Morel J. (2011) Lymphotoxin á revisited: general features and implications in rheumatoid arthritis. Arthritis Res. Ther. 13, 232. [DOI] [PMC free article] [PubMed] [Google Scholar]
- 68. Chiang E. Y., Kolumam G. A., Yu X., Francesco M., Ivelja S., Peng I., Gribling P., Shu J., Lee W. P., Refino C. J., Balazs M., Paler-Martinez A., Nguyen A., Young J., Barck K. H., Carano R. A., Ferrando R., Diehl L., Chatterjea D., Grogan J. L. (2009) Targeted depletion of lymphotoxin-α-expressing TH1 and TH17 cells inhibits autoimmune disease. Nat. Med. 15, 766–773 [DOI] [PubMed] [Google Scholar]
- 69. Nielsen O. H., Vainer B., Madsen S. M., Seidelin J. B., Heegaard N. H. (2000) Established and emerging biological activity markers of inflammatory bowel disease. Am. J. Gastroenterol. 95, 359–367 [DOI] [PubMed] [Google Scholar]
- 70. Hwang S. Y., Kim J. Y., Kim K. W., Park M. K., Moon Y., Kim W. U., Kim H. Y. (2004) IL-17 induces production of IL-6 and IL-8 in rheumatoid arthritis synovial fibroblasts via NF-κB- and PI3-kinase/Akt-dependent pathways. Arthritis Res. Ther. 6, R120–R128 [DOI] [PMC free article] [PubMed] [Google Scholar]
- 71. Emi Aikawa N., de Carvalho J. F., Artur Almeida Silva C., Bonfá E. (2010) Immunogenicity of Anti-TNF-α agents in autoimmune diseases. Clin. Rev. Allergy Immunol. 38, 82–89 [DOI] [PubMed] [Google Scholar]
- 72. Panaccione R., Ghosh S. (2010) Optimal use of biologics in the management of Crohn's disease. Therap. Adv. Gastroenterol. 3, 179–189 [DOI] [PMC free article] [PubMed] [Google Scholar]
- 73. Emery P. (2012) Optimizing outcomes in patients with rheumatoid arthritis and an inadequate response to anti-TNF treatment. Rheumatology 51, v22–v30 [DOI] [PubMed] [Google Scholar]
- 74. Reinisch W. (2010) How to manage loss of response to anti-TNF in Crohn's disease? Curr. Drug Targets 11, 152–155 [DOI] [PubMed] [Google Scholar]
- 75. Ben-Horin S., Chowers Y. (2014) Tailoring anti-TNF therapy in IBD: drug levels and disease activity. Nat. Rev. Gastroenterol. Hepatol. 11, 243–255 [DOI] [PubMed] [Google Scholar]
- 76. Yarur A. J., Abreu M. T., Deshpande A. R., Kerman D. H., Sussman D. A. (2014) Therapeutic drug monitoring in patients with inflammatory bowel disease. World J. Gastroenterol. 20, 3475–3484 [DOI] [PMC free article] [PubMed] [Google Scholar]
- 77. Deffar K., Shi H. L., Li L., Wang X. Z., Zhu X. J. (2009) Nanobodies–the new concept in antibody engineering. Afr. J. Biotechnol. 8, 2645–2652 [Google Scholar]
- 78. Ablynx (2013) Favourable immunogenicity profile of ALX0171, a potent anti-RSV Nanobody, following pulmonary administration. POSTER [Google Scholar]
- 79. Almoallim H., Al-Ghamdi Y., Almaghrabi H., Alyasi O. (2012) Anti-tumor necrosis factor-α induced systemic lupus erythematosus. Open Rheumatol. J. 6, 315–319 [DOI] [PMC free article] [PubMed] [Google Scholar]
- 80. Tack C. J., Kleijwegt F. S., Van Riel P. L., Roep B. O. (2009) Development of type 1 diabetes in a patient treated with anti-TNF-α therapy for active rheumatoid arthritis. Diabetologia 52, 1442–1444 [DOI] [PMC free article] [PubMed] [Google Scholar]
- 81. Eugster H. P., Frei K., Bachmann R., Bluethmann H., Lassmann H., Fontana A. (1999) Severity of symptoms and demyelination in MOG-induced EAE depends on TNFR1. Eur. J. Immunol. 29, 626–632 [DOI] [PubMed] [Google Scholar]
- 82. Suvannavejh G. C., Lee H. O., Padilla J., Dal Canto M. C., Barrett T. A., Miller S. D. (2000) Divergent roles for p55 and p75 tumor necrosis factor receptors in the pathogenesis of MOG(35–55)-induced experimental autoimmune encephalomyelitis. Cell. Immunol. 205, 24–33 [DOI] [PubMed] [Google Scholar]
- 83. Fischer R., Maier O., Siegemund M., Wajant H., Scheurich P., Pfizenmaier K. (2011) A TNF receptor 2 selective agonist rescues human neurons from oxidative stress-induced cell death. PLoS ONE 6, e27621. [DOI] [PMC free article] [PubMed] [Google Scholar]
- 84. Kägi D., Ho A., Odermatt B., Zakarian A., Ohashi P. S., Mak T. W. (1999) TNF receptor 1-dependent β cell toxicity as an effector pathway in autoimmune diabetes. J. Immunol. 162, 4598–4605 [PubMed] [Google Scholar]