

Abstract
Microglia cells are essential for brain homeostasis and have essential roles in neurodegenerative diseases. Aging is the main risk factor for most neurodegenerative diseases, and age-related changes in microglia may contribute to the susceptibility of the aging brain to dysfunction and neurodegeneration. We have analyzed morphology and dynamic behavior of neocortical microglia in their physiological environment in young adult (3-month-old), adult (11- to 12-month-old), and aged (26- to 27-month-old) C57BL/6J-Iba1-eGFP mice using in vivo 2-photon microscopy. Results show that surveying microglial cells in the neocortex exhibit age-related soma volume increase, shortening of processes, and loss of homogeneous tissue distribution. Furthermore, microglial process speed significantly decreased with age. While only a small population of microglia showed soma movement in adult mice, the microglia population with soma movement was increased in aged mice. However, in response to tissue injury, the dynamic microglial response was age-dependently diminished. These results provide novel insights into microglial behavior and indicate that microglial dysfunction in the aging brain may contribute to age-related cognitive decline and neurodegenerative diseases.
Keywords: aging, in vivo imaging, microglia, neocortex, neurodegeneration
Introduction
Microglia are the resident macrophages of the brain. They provide the first line of defense against any invading pathogen and are essential for brain homeostasis (Nimmerjahn et al., 2005; Kettenmann et al., 2011; Czirr & Wyss-Coray, 2012). Under physiological conditions in the healthy brain, microglia present with highly ramified processes, which they use to continuously scan their environment. These so-called surveying microglial cells allow the neural parenchyma to be monitored completely every few hours (Davalos et al., 2005; Nimmerjahn et al., 2005). This mobile baseline behavior also allows microglia to respond rapidly to any type of injury by altering their morphology and behavior to a highly mobile, migratory phenotype (Nimmerjahn et al., 2005; Venneti et al., 2008; Kettenmann et al., 2011; Czirr & Wyss-Coray, 2012). The functional implications of the different morphological states and dynamic changes are still not completely understood; they include clearance of apoptotic cells (Petersen & Dailey, 2004; Davalos et al., 2005) and phagocytosis of cellular debris (Nimmerjahn et al., 2005). Furthermore, it has recently been shown that microglial cells in the healthy brain also contact dendritic spines and axon terminals in an activity-dependent manner (Wake et al., 2009; Tremblay et al., 2010) and contribute to synapse maintenance and elimination (Tremblay et al., 2010; Paolicelli et al., 2011; Kettenmann et al., 2013), as well as the remodeling of neural circuits (Schafer et al., 2012).
Given these fundamental tasks, microglial cells are of principal importance for normal function of the central nervous system, and their dysfunction has been linked to a number of neurodegenerative diseases (Graeber & Streit, 2009; Czirr & Wyss-Coray, 2012; Merlini et al., 2012; Zhang et al., 2013). One of the major risk factors for neurodegenerative diseases is age, and age-dependent changes in microglial morphology and/or behavior have been implicated to be part of the pathogenic process (Conde & Streit, 2006). Furthermore, it has been reported that age-related alterations of microglia are accompanied by an increased expression of inflammatory activation markers and changes in cytokine production (Perry et al., 1993; Sierra et al., 2007). Possible consequences of these microglial alterations with aging might be a dysregulated response to injuries, changes in neuroprotective functions, and an increase in neurotoxic inflammatory responses (Flanary et al., 2007; Kaneko et al., 2008; Streit et al., 2008; Luo et al., 2010).
As outlined above, microglial dynamics may be of key importance to different physiological functions. Thus, investigating age-related changes of neocortical microglial baseline and injury responses in vivo and in their physiological environment may shed light on pathogenic mechanisms of neurodegenerative diseases and age-related dysfunction. However, besides a recent study examining microglia in the retina (Damani et al., 2010), age-related alterations of surveying as well as activated microglial cells have so far not been studied in vivo. In this work, we have analyzed microglial morphology and dynamic behavior in vivo, in three different age groups of C57BL/6J-Iba1-eGFP mice (3-month-old young adult, 11- to 12-month-old adult, and 27- to 28-month-old aged) with the age of the oldest group corresponding to the mean lifespan of this mouse strain (Jucker & Ingram, 1997).
Results
Process shortening and soma enlargement of microglia with age
Microglia display a distinct ramified phenotype in their resting state and are known to have both very motile processes as well as the potential to move their cell soma (Nimmerjahn et al., 2005). Three different age groups (n = 5/group) were imaged to assess microglia motility and in vivo morphology in the somatosensory cortex. A coordinate system with a custom-made head fixation system was used, allowing automatic and highly precise relocation to previously marked positions even in the absence of rhodamine dextran labeling of the vasculature as a landmark (Hefendehl et al., 2012). The latter was only used for illustrative purposes in the figures.
Microglial morphology was analyzed using surface detection and filament reconstruction algorithms (Imaris 7.0, Bitplane, Zurich, Switzerland). Representative images of in vivo microglial morphology in the three age groups are shown in Figure 1A–C. Microglia displayed a significant and robust increase in soma volume with age (Fig. 1D). In contrast, filament length (calculated as the mean of the longest filaments present within one complete process branch) was reduced with age, showing a significant change between the young adult and aged mice (Fig. 1E). Despite the shortening of processes, no significant differences with aging were found in the complexity of the branching pattern of the microglia processes (number of branch points per process) and/or number of processes per cell (Fig. 1F,G).
Figure 1.
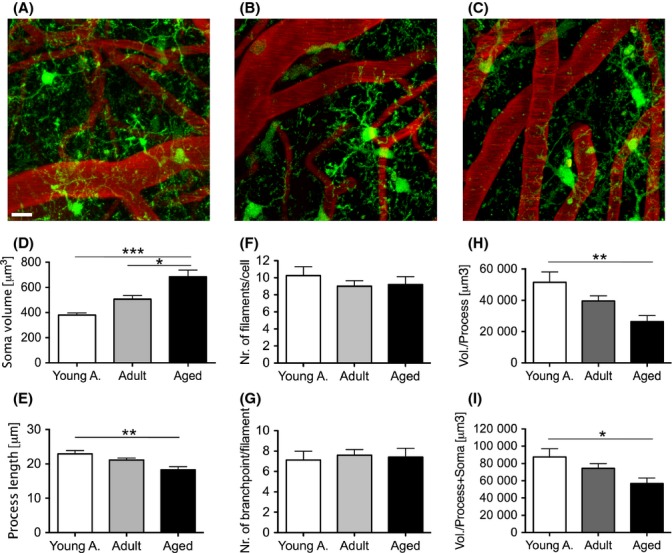
Age-related changes in microglia morphology assessed by in vivo imaging. Young adult (3 months), adult (11–12 months), and aged (26–27 months) Iba-1-EGFP transgenic mice (5 animals/group) received cranial window surgery and were imaged using 2-photon microscopy. (A–C) Representative maximum z-projection of imaged neocortical volumes of a young adult (A), adult (B), and aged (C) animal. Microglia express EGFP (green) and blood vessels were labeled by i.v. injection of Texas Red dextran (red). Scale bar is 10 μm. (D–I) Quantitative morphological changes of microglia were assessed using 3D in vivo data. Soma volume (D) was calculated by surface reconstruction (at least 15 cells were analyzed per mouse). A significant increase in soma volume with age was found (one-way ANOVA, F2,12 = 17.56, P = 0.0003; Tukey’s multiple comparison * P < 0.05, *** P < 0.001; 95% confidence interval (CI) young adult = 332.2–426.7; adult = 422.9–587.4; aged = 536.3–830.7). Process length (E), calculated for the longest primary filaments originating from the microglia soma (at least 100 processes were analyzed per animal) revealed an age-related reduction (one-way ANOVA, F2,12 = 7.553, P = 0.075; Tukey’s multiple comparison ** P < 0.01; 95%CI young adult = 20.75–25.65; adult = 9.40–22.76; aged = 15.74–20.80). The complexity of processes was assessed by measuring the total number of primary filaments per cell (F) and the number of branchpoints per primary filament (G). Both measures did not show any significant age-related changes (at least 100 processes were analyzed per animal; one-way ANOVA F2,12 = 0.58 and F2,12 = 0.09, P > 0.05). As both the primary filament length and the soma volume change with age, the overall change in brain volume covered by either just the processes (H) or the soma and the processes (I) was calculated. The processes showed a significant reduction in volume coverage with age (one-way ANOVA, F2,12 = 6.826, P = 0.001; Tukey’s multiple comparison ** P < 0.01; 95%CI young adult = 33172–69830, adult = 30671–48584, aged = 15244–37359). The combination of soma radius and process length showed a reduction in volume coverage per cell (one-way ANOVA, F2,12 = 4.452, P = 0.035; Tukey’s multiple comparison * P < 0.05; 95%CI young a = 61493–113440, adult = 58925–89754, aged = 38975–74623). Error bars indicate SEM.
Given the increase in soma volume and process shortening with aging, the theoretical brain volume a microglial cell could cover (survey) was calculated for the different age groups. In a first analysis, the theoretical brain volume that could be occupied by the processes with regard to their length was calculated. As expected from the reduced process length, the theoretical volume covered by the processes decreased with age (Fig. 1H). In a second analysis, the process length was combined with the radius of the microglial somata to test whether the increase in soma size may compensate for the shortening of the processes. Although some compensation was noted, results revealed still smaller volumes being covered by microglia in aged animals (Fig. 1I).
The homogeneous distribution of microglial cells is compromised in the aged brain
The reduction of the theoretical brain volume covered by individual microglia in the aged brain may lead to an incomplete surveillance of the brain parenchyma unless a higher number of microglia cells are present in the aging brain. To determine possible changes in microglial densities with age, we performed unbiased stereological estimates of the total number of microglia cells in the neocortex on postmortem histological sections. The same age groups were again used (Fig. 2A). Stereological analysis revealed a ~14% increase in the number of Iba-1 stained microglia in the aged group compared to the young adults (Fig. 2B) that may indeed at least partially compensate for the reduced theoretical surveillance volume of individual microglia cells. Consistent with previous work (Tremblay et al., 2012), we noticed that microglia in the aging brain appear no longer as homogenously distributed throughout the neuropil as seen in young adult mice (Fig. 2A,B). To assess this observation quantitatively, a cluster and nearest neighbor analysis was performed using confocal z-stacks (Fig. 2C,E). The three-dimensional, spatial distribution of microglial cells was analyzed within spheres of different set radii (20–100 μm) around individual microglia. The number of microglia clusters of three or more cells was significantly higher in the aged animals within all set radii (Fig. 2C,D). Accordingly, the aged animals demonstrated a significantly increased number of microglia in close proximity to each other, that is, within a radius of 20 μm (Fig. 2E). Thus, changes in microglial distribution lead to the loss of the homogeneous arrangement of cells that can be seen in the nonaged group. Thus, the microglial homogenous spatial distribution exhibited by the nonaged group is compromised, as illustrated by the clustering of the cells observed in the aged animals. This discrepancy in microglia arrangement between aged and nonaged animals was further investigated, using a logistic regression model, to assess the association between microglial nearest neighbor and the animals’ age. The disparity between spatial patterns was indeed so striking, that the model can be used to reliably predict whether an animal is aged or not, solely based on the spatial arrangement of microglial cells (Fig. 2F).
Figure 2.

Homogeneous distribution of microglial cells is lost in the aged brain. Histological sections (40 μm) were taken from young adult (3 months), adult (11–12 months), and aged (26–27 months) Iba-1-EGFP transgenic mice (7–8 animals/group). (A) Representative Iba-1 immunostained sections are shown for each age group. Scale bar is 50 μm and 20 μm for insert. (B) Stereological analysis showed a ~14% increase in Iba-1 stained microglia in the aged animals compared to the young adults (one-way ANOVA F2,18 = 1.395, P = 0.2733). Error bars indicate SEM. (C) Microglial distribution was analyzed by laser scanning confocal microscopy, performed on 40–μm-thick Iba-1 immunostained sections. Representative max. projections are shown for each age group. Scale bar is 50 μm. White circles show exemplary radii (20 μm, 40 μm, and 60 μm) used for each microglia to compute nearest neighbors and clusters. (D) Spatial distribution of microglial cells was analyzed by calculating local cell distribution patterns. A clustered cell was defined as having at least 3 microglial cells within the set radii. The comparison of clustered microglia across age groups revealed significant differences in their clustering pattern, with an increased number of microglia in close proximity to each other in the aged mice (*P < 0.05; 40 μm radius 95%CI young adult = 1.29–4.51, aged=1.87–81.32; 60 μm 95%CI young adult = 52.37–74.30, aged = 86.12–99.13; 80 μm radius 95%CI young adult = 90.20–96.41, aged = 98.29–100.14). (E) To further determine differences in distribution patterns, the total number of microglia was counted in set radii. This comparison showed a significant increase in the percentage of microglia in close proximity (0–20 μm) in aged animals vs. young adults and adults (Mann–Whitney U-test P < 0.05). Correspondingly, the number of cells present in a distance >60 μm decreased in aged animals (Mann–Whitney U-test P < 0.05). (F) Logistic regression analysis was used to model the probability of correctly predicting an animal’s respective age group by examining the distance to its nearest neighbor. The probability of an animal being aged significantly increases as the distance to the nearest neighbor decreases, when considering a distinction between young adult and aged groups (continuous line), and between adult and aged groups (dotted line) (Wald tests: young adults vs. aged P < 0.001 for up to 60 μm neighbors and P < 0.05 for up to 80 μm; adults vs. aged animals P < 0.001 for up to 60 μm neighbors and P < 0.01 for up to 80 μm; young adults vs. adult animals no significant difference). A clear trend is depicted, showing that the aged group can always be predicted in comparison with the other groups. Considering the probability of aging from young adult to adult group (dashed line), there is no effect of the distance to the nearest neighbor, suggesting a high spatial similarity in the microglia distribution of nonaged animals. Error bars are 95% confidence intervals.
Baseline process motility of microglia decreases with age
Resting microglial cells constantly move their processes. Thus, how effectively microglia can scan their surrounding brain tissue is not only determined by the theoretical volume they cover with their processes but also by the dynamics of their process movement. Therefore, the movement of surveying microglial processes in the somatosensory cortex was imaged for a 20-min time period with an interval of 2 min in the three age groups (Fig. 3A). Furthermore, to test for a possible change in the directional movement of the cell processes, the movement was separated into extension and retraction components. While the values of extension and retraction displacement did not differ between age groups (confirming that our analysis included only baseline, surveying activity rather than a directional movement toward any site of disturbance or injury) (Fig. 3B), the overall process movements revealed a significant decrease with age (Fig. 3C). To further analyze this motility difference between groups, the process movement speeds were binned. In accordance with the initial analysis, a shift to slower process speeds with aging was again found (Fig. 3D–F).
Figure 3.
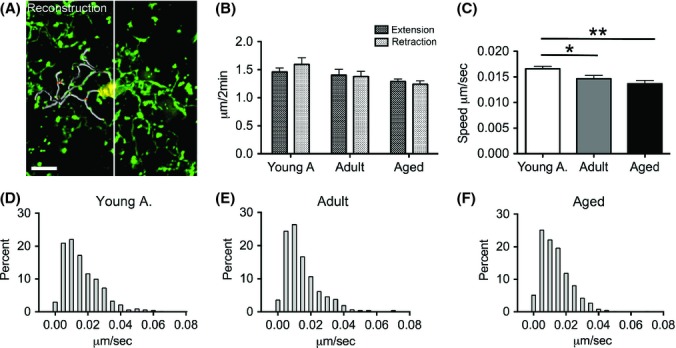
Age-related changes in microglia process motility. Microglia cells were imaged over 20 min with intervals of 2 min to track process movements (at least 130 process endpoints from 5 cells were tracked per animal). The same 5 mice per group as in Figure 1 were used. (A) A representative z-stack shows a surveying microglia; superimposed are reconstructed soma (yellow, left side) and processes (gray, left side). The green endpoints on each process were tracked over time. Scale bar is 5 μm. (B) Extension or retraction of processes was assessed by measuring changes in process length between consecutive imaging time points. No difference was detected between extension and retraction in the process movements (t-test within age groups). (C) The speed of the process endpoints was reduced significantly with age (one-way ANOVA, F2,12 = 5.896, P = 0.004; Tukey’s multiple comparison, * P < 0.05; ** P < 0.01; 95%CI young adult = 0.01555–0.01760, adult = 0.01325–0.01604, aged = 0.01226–0.01503). Error bars indicate SEM. (D–F) Frequency distributions of the process endpoints were tested for differences. The distribution of binned speeds changes significantly with age (‘young adult’ to ‘adult’ P = 0.003; ’young adult’ to ‘aged’ P = 0.002, for statistical details see Experimental procedures section).
Microglial soma movement increases with age
Microglial cells are known to be capable of moving their cell soma within the brain parenchyma, although only a small proportion of cells show any soma translocation in healthy adult animals (Nimmerjahn et al., 2005). Soma movement of microglia cells in the somatosensory cortex was imaged at three time points with an interval of 1 week (Fig. 4A). Comparison of the average soma movements among the different age groups showed a significant increase in microglial movement with age (Fig. 4B). Interestingly, we observed that the majority of the cell population showed minor movement, and only a very small proportion of cells were observed to display directional movement, especially in the ‘young adult’ and ‘adult’ age group (Fig. 4C–E).
Figure 4.

Microglial soma movement increases with age. (A) A representative neocortical region of interest is shown at three time points with 1-week interval. Color-bars beneath the images indicate imaging time points. Soma movement was tracked using centroid displacement (blue spheres in microglia soma). Movement of an individual microglial cells (green) is indicated by the colored dragontail; blood vessels are made visible by i.v. injection of Texas Red dextran (red). The same 5 mice per group as in Figure 1 were used. (B) To quantitatively assess microglial soma movement, five regions of interest per animal were imaged at three time points with an interval of one week (a minimum of 8 cells/animal were tracked and the mean was taken). Soma movement significantly increased with age (one-way ANOVA, F2,12 = 4.023, P = 0.046; Tukey’s multiple comparison * P < 0.05; 95%CI young adult = 3.350–6.694, adult = 4.914–8.483, aged = 6.156–9.906). Error bars indicate SEM. (C–E) Frequency distributions of the detected soma movements of individual cells were used to test for intergroup differences. The distribution of binned cell movements changes significantly from the ‘young adult’ animal age group to the ‘aged’ animal group (P = 0.031, for statistical details see Experimental procedures section).
To further analyze the difference in distribution of soma movement, speeds were binned. In the ‘young adult’ and ‘adult’ age group, the majority of cells moved an average of 4 μm/2 weeks. Only 6% of the detected cells displayed movement of more than 10 μm/2 weeks in the ‘young adult’ group (Fig. 4C). The distribution changed slightly in the ‘adult’ age group with 14% of the detected cell population moving more than 10 μm/2 weeks (Fig. 4D). However, a significant distribution change was found in the ‘aged’ age group, where 23% of cells displayed a movement of more than 10 μm/2 weeks (Fig. 4E).
Microglial injury responses diminish with age
Microglial cells are known to be highly reactive upon injury. To test and compare the injury response of microglia in the different age groups, a micro-laser lesion of a small capillary (diameter <4 μm) was performed on a different set of animals (n = 5/group) of the same age groups (Fig. 5A). The comparison of the microglial reaction in the neocortex (as measured by the speed of microglial processes approaching the lesion site) showed no difference between the ‘young adult’ and the ‘adult’ age group. However, a significant reduction in reaction speed of the ‘aged’ group compared to the ‘young adult’ and ‘adult’ age groups was found (Fig. 5B).
Figure 5.

Microglial response to laser lesion diminishes with age. To assess microglial response to brain injury, micro-laser lesions to small blood vessels were performed in young adult (3 months), adult (11–12 months), and aged (26–27 months) Iba-1-EGFP transgenic mice (5 animals/group). The response was imaged for a time period of 20 min with an interval of 2 min. (A) Representative region of interest before (t = 0 min) and following laser lesion (t = 2–18 min; white arrowhead indicates lesion site) displays microglial (green) reaction to blood vessel (red) injury. (B) The microglial reaction to injury was assessed by analyzing the movement of microglia processes toward the lesion site. Two lesions/animal (one on each brain hemisphere) were done. Injury-evoked process movement was slower in the aged compared to the adult mice (one-way ANOVA F2,12 = 9.718, P = 0.0031; Tukey’s multiple comparison, * P < 0.05; 95%CI young adult = 0.883–1.078, adult = 0.712–1.411, aged = 0.299–0.777). Error bars indicate SEM. (C) The instant reaction to the laser lesion was assessed by quantification of the thickness (in 3D) of microglial processes. Local thickness was computed at time point 0 (before the lesion) and time point 3 (4 min after the lesion, see Experimental procedures section for details). Color-coding represents maximum local diameter (μm) to visualize the morphological transformation processes undergo upon lesion. The change in local thickness is apparent when comparing microglial reactions in the young adult and adult group with the color code shifting from small (red) to middle (blue). Such a change is not apparent in the aged group. Scale bar is 10 μm. (D) Changes in local thickness between t = 0 min and t = 4 min were normalized to pixel values (from 0 to 255) and binned to compare microglial process responses across age groups. Morphological transformation upon injury was significantly different in the young adult group in comparison with the adult and aged animal (Mann–Whitney U-test ‘young adult’ animal age group to ‘adult’ animal group P = 0.015; ‘young adult’ animal age group to ‘aged’ animal group P = 0.029). Circles in the graph indicate outliers.
We further used the 3D information to quantify the local thickness of the microglial structures before and after lesioning (4 min) to analyze the acute morphological changes upon injury (Fig. 5C). Consistent with the reduced responses in aged animals, rapid changes in local thickness of microglial structures observed in the young adult and adult mice were significantly smaller in the aged animals (Fig. 5D). This response delay of neocortical microglia in aged mice to a laser-induced lesion may generally affect the pathological outcome after brain injury in aged animals.
Discussion
In the current study, we examined microglia in vivo in the context of advancing age. Recent studies indicate that the microglial population is maintained without peripheral, bone marrow-derived influences (Ajami et al., 2007). In addition, microglial cells have a low proliferative rate (Saijo & Glass, 2011). Taken together, it is very likely that the majority of the microglial cell population is long-lived and hence susceptible to aging effects occurring over the animal’s lifespan. Therefore, microglia may exhibit age-related loss of function that in turn contributes to the development of brain disease (Conde & Streit, 2006).
Age-dependent morphology of microglial cells
Three different age groups of transgenic iba-1-EGFP mice (Davalos et al., 2005; Hirasawa et al., 2005; Nimmerjahn et al., 2005) were used to study microglia aging in vivo using 2-photon microscopy. We observed age-related alterations in resting microglial morphology in the somatosensory cortex in the absence of additional stimuli. These alterations included the enlargement of the cell soma as well as a shortening of the cell processes. Both of these morphological features indicate that the cells are shifting toward an altered phenotype over time. This particular phenotype is reminiscent of microglia in an activated state, which can be appreciated upon injury (Nimmerjahn et al., 2005; Haynes et al., 2006; Venneti et al., 2008).
However, it remains unclear whether aging microglia are truly activated or whether this phenotype represents a separate functional or even dysfunctional state. Although we detected pronounced morphological heterogeneity in the branching patterns of aged animals, overall we could not find evidence for a simplification of the branching pattern or a reduction of processes per cell soma. Thus, even though microglia show significant age-related morphological alterations, the complexity of process branching patterns does not seem to change significantly.
One of the major functions of ramified microglial cells is to scan surrounding brain tissue continuously as part of immune surveillance (Davalos et al., 2005; Nimmerjahn et al., 2005). This function presumably depends on the microglial cell distribution, process length, and complexity as well as speed of process movement. Given our observations that the radius of the cell soma increases with age but the processes shorten, we calculated the overall brain volume that can be covered by a microglial cell. Indeed, smaller theoretical brain volumes being covered by individual microglia in aged animals were found. As microglial cells cover the entire brain parenchyma in healthy adult animals, a potential reduction in volume coverage per cell in aged animals may imply that either the immune surveillance is incomplete or that a higher number of microglia needs to be present to cover the elderly brain. In accordance with the latter hypothesis, stereological assessment of neocortical microglial numbers revealed a ~14% increase in the total microglial number in the cortex. This finding was further consolidated by a nearest neighbor analysis, which showed a significantly higher number of microglia in close proximity to each other in the aged animal group. Furthermore, we calculated the probability of microglial clusters within the different age groups. The result showed a significant change from a homogenous cell distribution in the young adults to a loss of equal distribution due to clustering in the aged animals. Whether this clustering occurs as a result of microglia responding to microinjury in the aging brain or due to dysfunction of microglial cells remains unclear.
Process and soma movement of surveying microglial cells
The permanent scanning of the surrounding brain tissue was thought to serve immune surveillance exclusively. However, recent findings suggest that microglial cells might also have a role in neuronal signaling as they directly contact synaptic structures during process movement (Wake et al., 2009; Tremblay et al., 2010). The normal aging process includes a decline in neural function that is most likely caused by molecular and cellular alterations of the brain that are different from those associated with neurodegenerative diseases. It has been convincingly shown that a widespread central loss of neurons is not the underlying cause for age-related cognitive decline (Rapp & Gallagher, 1996) but that neural dysfunction is likely to be mediated by region-specific remodeling of synapses (Uemura, 1985; Hof & Morrison, 2004; Burke & Barnes, 2006). Thus, it can be speculated that such age-related changes in neuronal networks may be connected to the alterations in neocortical microglial cells described in our study. We found that the motility of microglial processes is significantly reduced in aged animals. Thus, immunological responses as well as homeostatic glia to neuron signaling processes may be impaired due to age-related microglial dysfunction.
Surprisingly, however, we also found that the overall soma movement of the neocortical microglial population increases with age. Up to 12 months of age, we only observed significant soma movement in a small proportion of the microglial population (6%). However, a significant proportion of microglia showed soma movement in the aged group (23%). This higher rate of soma movement might account for the more patchy and heterogeneous cell distribution throughout the brain parenchyma. Of note, Nimmerjahn et al. (Nimmerjahn et al., 2005) reported similar in vivo results using multiphoton microscopy. The authors showed that the majority of microglial somata remained stable but that 5% of microglia showed some movement of 1–2 μm/hour. These observations match our ‘young adult’ group where we found soma translocation in ~6% of the cells. Although Nimmerjahn et al. (2005) used mice between 1.5 and 15 month of age and did not distinguish between age groups, their observation supports our data that a subpopulation of microglial cells have an increased capability of whole cell movements.
Our observations complement previous studies in the retina (Damani et al., 2010) and the primary visual and auditory cortex (Tremblay et al., 2012). Taking the morphological changes of soma volume enlargement and process shortening into account, combined with the trend toward higher soma motility, these findings may indicate a shift toward a cell state resembling activated microglial cells, possibly due to microglial responses to microinjury in the aged brain. It may also be possible that this subpopulation represents invading monocytes from the periphery with high motility. However, recent data indicate that monocyte invasion is virtually absent in the healthy brain (Ajami et al., 2007), but whether this may occur during aging remains unexplored. Nevertheless, it appears unlikely that ~23% of the microglial population that showed soma movement in the aged brain would all derive from invading monocytes.
Microglial response to laser-induced tissue injury
It has been demonstrated that microglial responses to tissue injury are mediated by various extracellular signals (Graeber & Streit, 2009; Ransohoff & Perry, 2009). Models of CNS injury or disease have been used to show that aged microglia respond with a more severe and longer lasting pro-inflammatory activation, which is associated with increased neuronal death and a delayed functional recovery. These age-related changes have been shown mostly by molecular analysis, that is, expression of activation markers and inflammatory cytokines associated with activation (Perry et al., 1993; Sierra et al., 2007; Njie et al., 2012).
Furthermore, in situ analysis of the microglial response upon ATP application in the retina of aged animals showed a decrease in process motility and a less ramified cell morphology (Damani et al., 2010). Accordingly, we found an altered age-related microglia response to tissue injury in the cerebral cortex. We used micro-laser lesion to breach the blood–brain barrier (BBB), which is known to evoke a rapid microglial response (Nimmerjahn et al., 2005). All three age groups showed a polarized movement response of the microglial processes toward the lesion site, with retraction of processes facing away from the lesion. However, analysis of the reaction speed within the three age groups showed a drastic decrease in the mean response speed of the microglial processes in the aged group. These differences suggest a generally slower, less dynamic response to injury in aged microglia, whereas young adult microglia rapidly increased their process motility in response to laser injury. Although it is possible that peripheral monocytes will eventually invade the brain after blood–brain barrier break down, we are confident that only resident microglia were imaged, because the lesion site was imaged immediately after the lesion and then every 2 min. During this imaging, we could not detect any additional Iba-1-positive cells entering the microscopic field, and the total number of microglia remained constant.
Our analysis of acute morphological changes in neocortical microglial processes and termini also demonstrated age-dependent differences. While the young adults and adult animals showed an increase in local diameters of the observed structures, the aged animals displayed significantly less morphological changes upon lesioning. This might be the result of an already present altered state of activation within the aged brain resulting in a different response when brain injury is detected.
It has been proposed that the microglial reaction serves as a protective shield, encapsulating the injured tissue from its surroundings, and that process movements may serve to restore tissue homeostasis by clearance of cell debris and released intracellular products (Nimmerjahn et al., 2005; Shaked et al., 2005). Hence, the observed age-dependent decrease in microglial process motility might result in a diminished ability to restore and maintain tissue homeostasis.
In summary, we found various age-related alterations in neocortical microglial cells in vivo. These alterations include changes in cell morphology and the dynamic behavior of soma and process movement. Furthermore, these changes were evident in both ramified surveying microglial cells and in response to laser-induced tissue injury. The former indicates a decrease in the capacity to scan surrounding brain parenchyma, which may also be an essential part of glial-to-neuron communication. However, this may at least partially be compensated for by the increase in total cell number and the measured increase in soma movement in the aged animals. The latter indicates an age-related dysfunction in the injury response, which is less prominent and rapid in the acute phase of injury. Our data confirm previously reported ex vivo results concerning changes in microglia morphology during aging and provide new data on the dynamics of the individual cells. However, it remains unclear whether the observed alterations are due to the aging process of the microglial cells themselves or whether they reflect the cells’ response to changes of their immediate microenvironment due to aging.
Taken together, these alterations in neocortical microglial behavior provide insight into age-related changes of the microglia phenotype. In addition to previous reports on enhanced inflammatory responses in the aging brain, our data provide evidence that aged microglial cells may contribute to age−related dysfunction as well as neurodegenerative diseases.
Experimental procedures
Mice
Hemizygous Iba-1-EGFP mice (Hirasawa et al., 2005) were generated and maintained on a C57BL/6J background. Three different age groups of Iba-1-EGFP transgenic animals were used as follows: young adult 3-month-old mice, adult 11- to 12-month-old mice, and aged 27- to 28-month-old mice. The latter age corresponds to the mean lifespan of C57BL/6J mice (Jucker & Ingram, 1997). Groups of n = 5 mice of mixed gender (male n = 2, female, n = 3) were used in all in vivo experiments. For postmortem histological analysis, n = 6–8 mice per group (male n = 2, female n = 4–6) were used. Mice were group-housed until surgery, and single-housed thereafter. At all times, the mice were kept under specific pathogen-free conditions. The experimental procedures were undertaken in accordance with the veterinary office regulations of Baden-Württemberg (Germany) and approved by the local animal care and use committees.
Surgery
A round cranial window (4 mm diameter) was installed under general anesthesia (fentanyl, 0.05 mg/kg; midazolam, 5 mg/kg; medetomidine, 0.50 mg/kg) as previously described (Hefendehl et al., 2011, 2012). Of note, this surgery procedure does not induce any gliosis in the underlying brain tissue (Hefendehl et al., 2011). After surgery, the animals were allowed to recover for 1 week before starting the imaging process.
Imaging
Before each imaging session, mice were anesthetized with isoflurane (induction at 3%, subsequently reduced and held constant at 1–1.5%). Texas Red dextran (70 000 Da molecular weight; 12.5 mg/mL in sterile PBS; Invitrogen, Darmstadt, Germany) was injected intravenously, providing a fluorescent angiogram (Spires et al., 2005) that served demonstration purposes in shown images. The cranial window was cleaned with ddH2O, and the mouse was secured under the microscope by fitting the titanium ring in a custom-built head fixation apparatus connected to a motorized XY stage (Luigs & Neumann). The head fixation system in combination with the ‘Mark and Find’ function in the Leica confocal software allowed for locating the previously imaged locations with a precision of a few micrometers (Hefendehl et al., 2012). If necessary, fine tuning was performed manually with respect to the characteristic three-dimensional cell pattern.
All images were acquired using a 40xHCX APO water-immersion objective (0.8 numerical aperture; Leica Microsystems, Wetzlar, Germany). The Leica SP2 confocal microscope was equipped with a Spectra Physics Mai-Tai laser (tunable 710–990 nm), which provided multiphoton excitation at 910 nm for GFP and Texas Red simultaneously. Signals were detected via nondescanned detectors and the following filters BP 515/30 for GFP, and BP 590/60 for Texas Red. Settings were optimized for the first imaging session and kept constant for each xyz location.
Long-term Imaging
For each mouse (n = 5/age group), six different xyz locations were chosen from the somatosensory cortex, which were imaged for 3 weeks on a weekly basis. Analysis of cell morphology was always performed on the images acquired during the first session. At each xyz location, z-stacks of 150–180 μm were taken, starting at a depth of ~ 20 μm from the cortical surface at a z-spacing of 1.0033 μm. Our previously published head fixation system allows for precise automated relocation of previously chosen regions of interest (Hefendehl et al., 2012). This method of data acquisition is invariant of head rotational changes, enabling us to concentrate exclusively on possible translational changes in the alignment process when relocating an imaging position. To ensure that we imaged the same region of interest including the previously imaged microglia, we additionally labeled blood vessels (i.v. injection of Texas Red). We used the vessels as reference points in the alignment process.
Short-term Imaging
Short-term imaging was done in the same mice prior to the long-term imaging sessions. For each mouse, five different xyz locations were chosen, which were not used in the long-term sessions. Each region of interest was imaged for 20 min with an interval of 2 min. Microglia process movement was assessed in regions of interest. At each xyz location, z-stacks of 50–80 μm were taken, starting at a depth of ~ 20 μm from the cortical surface at a z-spacing of 0.6 μm.
Laser-induced lesion
A new set of mice was used (again 3, 11–12, and 27–28 months of age, n = 5/group). For each mouse, one lesion was performed in each hemisphere using a wavelength of 910 nm with a laser power of ~ 80 mW for 15 s in a point scan mode. A z-stack of the region of interest prior to the lesion was obtained, and the microglia cells were counted within the imaged volume. The first z-stack of the volume was obtained directly after the lesioning was completed. The subsequent images were taken at 2-min intervals during the subsequent 20 min. The microglia that were present in the image prior to the lesion were still the same in number after the lesion. At each xyz location, z-stacks of 50–80 μm were taken, starting at a depth of ~ 20 μm from the cortical surface at a z-spacing of 0.6 μm.
Local thickness of microglia processes
The local thickness value of microglial processes and termini at a specific point (or pixel) is defined as the diameter of the largest sphere that fits within the three-dimensional space and contains the point (Hildebrand & Rüegsegger, 1997). It is mathematically defined by equation 1:
where τ is the local thickness value of the point p (x,y,z), x (x,y,z) is the center of the sphere, r is the radius of the sphere, and Ω denotes the space occupied by the object, as a subspace of the three-dimensional Euclidean space. Implementation of the local thickness computation was performed in ImageJ (v1.47), using a plugin optimized for fast computation of the local thickness (Hildebrand & Rüegsegger, 1997). The threshold in each image was computed automatically using Li’s minimum cross-entropy thresholding method (Li & Tam, 2011). The resulting threshold value was additionally used to reconstruct the 3D volumes of the stacks, using VolumeJ (Abràmoff, 2002).
The local thickness algorithm accepts an input z-stack, calculates the local thickness for each voxel according to equation 1, and outputs the results in an equivalent z-stack. The output stack pixel values then correspond to local thicknesses, reported as diameters using a 32-bit number representation, effectively providing a map that illustrates the localized thickness of the structures in the original 3D stack. Measurements of the diameters are obtained directly from the image histogram of the output stack. To quantify the changes in the diameter of the processes, the local thickness values were normalized for all animals by converting the output stacks to 8-bit, effectively normalizing the thickness ranges between the values 0 and 255.
The changes were visualized in 3D using VolumeJ. The classifier threshold was set to the one calculated by Li’s algorithm for the original z-stack. The normalized local thickness map was used as reference coloring. Accordingly, the color scale in the rendered images represents different values of thickness in diameter, for visual assessment of the change in thickness of the processes and their termini before and after a laser micro-lesion was performed.
Data analysis of in vivo imaging
Before additional processing, images were deblurred using Huygens software. Stacks of different time points were registered for subsequent analysis using customized algorithms in Amira (Amira 4.1.1; Mercury Computer Systems, Mérignac Cedex, France). The final analysis was done in Imaris (Imaris 7.0; Bitplane, Zurich, Switzerland) using surface detection and tracking. For the cell soma analysis, the surfaces of individual cells were automatically tracked over a 3-week period. The soma volume was measured at the first time point using the implemented surface reconstruction algorithm in Imaris 7.0. Care was taken to only include cells that did not extend over the edges of the imaged volume. All detected cells were double-checked manually after automatic tracking. The process length was assessed by automated filament detection, and only the longest and thus primary process of each branch was subjected to analysis. The process movement over time was tracked using a filament-tracking algorithm provided in the Imaris software. The endpoint of each filament was automatically tracked over 20 min. Care was taken to only include filaments that did not extend over the edges of the imaged volume and could be tracked trough all time points. All detected processes were double-checked manually after automatic tracking and were retraced manually if necessary. For the lesion-induced microglia reaction, a maximum projection served to measure the distance between the site of lesion and the microglia processes every other minute using Imaris.
Statistical analysis of in vivo imaging results
Statistical analysis was performed using GraphPad Prism (San Diego, CA, USA). For the comparison across the three age groups, a one-way ANOVA was used unless otherwise stated. Where appropriate Tukey’s multiple comparison post hoc test was performed for pairwise comparisons. The distinctiveness of process speed and soma movement distributions was tested using the Kolmogorov–Smirnov (K-S) test. These comparisons were made across age groups. To compare changes in local thickness and microglial distribution among age groups, Kruskal–Wallis test was used, and where appropriate followed by Mann–Whitney U-test for pairwise comparisons. Statistical comparison of the nearest neighbor and clustered cell estimated probabilities was performed using Wald tests, computed in Stata. Wald tests are parametric statistical tests suitable to evaluate the differences in the parameters of estimated models, such as the logistic regression that was used in this work.
Stereological assessment of microglia in postmortem tissue
A new set of mice was used (again 3, 11–12, and 27–28 months of age, n = 6–8/group). Animals were perfused with PBS followed by 4% paraformaldehyde (PFA) under deep ketamine/xylazine (ketamine 100 mg/kg; xylazine 10 mg/kg) anesthesia. Brains were removed and fixed in 4% paraformaldehyde for 24 h. Subsequently, brains were immersed in 30% sucrose, frozen in 2-methylbutane, and sliced in 40-μm-thick coronal sections. Immunohistochemical stainings were done using the Vectostain Elite ABC Kits (Vector Laboratories; Burlingame, CA, USA) using polyclonal antibody to ionized calcium-binding adapter molecule 1 (Iba-1; Wako, Richmond, VA, USA). Iba-1-positive cells were assessed on random sets of every 12th systematically sampled 40-μm-thick, Iba-1-immunostained sections through the entire neocortex typically yielding 8–10 sections/mouse. Analysis was performed on one hemisphere with the aid of the Stereologer software (Stereo Investigator 6; MBF Bioscience, Williston, VT, USA) and a motorized x–y–z stage coupled to a video-microscopy system (Microfiber color microscope camera; Optronics, Goleta, CA, USA). The optical fractionator technique was used with 3D dissectors (area, 550 × 550 μm2; height, 15 μm; guard height, 2 μm; counting frame, 75 × 75 μm2). Iba-1-positive cells with complete soma within the dissector volume were counted, and the total number of neocortical microglia cells (per hemisphere) was estimated according to previously described unbiased stereological methods (Grathwohl et al., 2009).
Nearest neighbor and cluster computation of microglia in postmortem tissue
A second random set of every 12th systematically sampled 40-μm-thick sections was immunohistochemically stained for Iba-1, using an Alexa 488 conjugated secondary antibody (Lot: 828814; Invitrogen). Two areas per section (8–10 sections/mouse) were selected for optical sectioning from layer 2/3 of the somatosensory cortex, ensuring a uniformly covered field of view of microglia on the cortex and similar areas used in the 2-photon images. Optical sectioning was performed on a Zeiss LSM 510META, using a 488-nm argon laser line and a high numerical aperture ×20 magnification objective (Carl Zeiss, ×20/0.8NA). Sectioning frequency was set to every 1 μm; optical section thickness is >1.6 μm.
Confocal z-stacks were inserted in Imaris (Imaris 7.0; Bitplane) to reconstruct 3D volumes imaged. Spot recognition was used to determine the center of mass for each microglia soma volume. Care was exercised to capture all available microglia somas and that each would only be represented by one spot. Three-dimensional spatial coordinates of the points were exported into a text file.
The spatial coordinates were used to calculate pairwise distances between each microglia cell and all the others on the same volume, using formula 1 for Euclidean distances.
where dij denotes the distance of the centers of mass between two microglia cells, i and j; the coordinates of the soma center of mass of microglia i is (xi,yi,zi) and of microglia j is (xj,yj,zj). All calculations were computed by a custom-made Fortran program (GNU compiler v3.4 for Fortran 77), set to read through all the text files containing the xyz coordinates, produced for each z-stack by Imaris. Additionally, the program stores the set of pair distances of any microglia and computes the nearest microglia to it (the neighbor that has the minimum distance dmin), as well as the number of microglia within a set distance from its center. Any microglia was assigned as belonging to a cluster if there are at least three neighboring microglia within set distances. The nearest neighbor and cluster information for each microglia, for each z-stack is written to an output text file by the Fortran program and can then be imported to statistical software for analysis.
Statistical comparison of the nearest neighbor and clustered cell estimated probabilities was performed using Wald tests, computed in Stata. Wald tests are parametric statistical tests suitable to evaluate the differences in the parameters of estimated models, such as the logistic regression that was used in this work.
Logistic regression model
A logistic regression model fit was used to model the probability of occurrence of an event, given a set of factor variables, implemented using stata 10 for the Macintosh (Stata corporation, College Station, TX, USA). Stata estimates a logistic regression model using the logit function, which reports the regression coefficients, measured in logged odds. The adjust command was used to obtain the predicted probabilities. Robust standard errors were used to determine 95% confidence intervals and significance levels. Logistic regression does not yield confidence intervals if the observed proportion is 0 or 1. The events modeled by the logistic regression are always binary, that is, occurring or not occurring. For the cluster analysis (Fig. 2D), the event assigned to each microglia was ‘clustered cell’ (at least 3 neighbor cells within the respective radius) or ‘nonclustered cell’. The factor variable was the age group that the cell belongs to. For the age prediction (Fig. 2E), the event assigned to each microglia was ‘belonging to a specific age group’ (e.g., Aged, as conveyed by the different line types in the graph of Fig. 2E) or ‘not belonging to that group’. The factor variable for each of the cells was the distance bin that its nearest neighbor belongs to.
Acknowledgments
We would like to thank M. Calhoun (Silver Springs, MD), H. Kettenman (Berlin, Germany), and S.K. Fritschi for comments to this manuscript and all the members of our department for experimental help and advice. This work was supported by a PhD grant (JKH) and a Roman Herzog Postdoctoral Fellowship (JJN) from the charitable Hertie Foundation.
References
- Abràmoff MD. Computation and visualization of three-dimensional soft tissue motion in the orbit. IEEE Trans. Med. Imag. 2002;21:1–18. doi: 10.1109/TMI.2002.1000254. M. A. Viergever, ed. [DOI] [PubMed] [Google Scholar]
- Ajami B, Bennett JL, Krieger C, Tetzlaff W, Rossi FMV. Local self-renewal can sustain CNS microglia maintenance and function throughout adult life. Nat. Neurosci. 2007;10:1538–1543. doi: 10.1038/nn2014. [DOI] [PubMed] [Google Scholar]
- Burke SN, Barnes CA. Neural plasticity in the ageing brain. Nat. Rev. Neurosci. 2006;7:30–40. doi: 10.1038/nrn1809. [DOI] [PubMed] [Google Scholar]
- Conde JR, Streit WJ. Microglia in the aging brain. J. Neuropathol. Exp. Neurol. 2006;65:199–203. doi: 10.1097/01.jnen.0000202887.22082.63. [DOI] [PubMed] [Google Scholar]
- Czirr E, Wyss-Coray T. The immunology of neurodegeneration. J. Clin. Invest. 2012;122:1156–1163. doi: 10.1172/JCI58656. [DOI] [PMC free article] [PubMed] [Google Scholar]
- Damani MR, Zhao L, Fontainhas AM, Amaral J, Fariss RN, Wong WT. Age-related alterations in the dynamic behavior of microglia. Aging Cell. 2010;10:263–276. doi: 10.1111/j.1474-9726.2010.00660.x. [DOI] [PMC free article] [PubMed] [Google Scholar]
- Davalos D, Grutzendler J, Yang G, Kim JV, Zuo Y, Jung S, Littman DR, Dustin ML, Gan W-B. ATP mediates rapid microglial response to local brain injury in vivo. Nat. Neurosci. 2005;8:752–758. doi: 10.1038/nn1472. [DOI] [PubMed] [Google Scholar]
- Flanary BE, Sammons NW, Nguyen C, Walker D, Streit WJ. Evidence that aging and amyloid promote microglial cell senescence. Rejuvenation Res. 2007;10:61–74. doi: 10.1089/rej.2006.9096. [DOI] [PubMed] [Google Scholar]
- Graeber MB, Streit WJ. Microglia: biology and pathology. Acta Neuropathol. 2009;119:89–105. doi: 10.1007/s00401-009-0622-0. [DOI] [PubMed] [Google Scholar]
- Grathwohl SA, Kälin RE, Bolmont T, Prokop S, Winkelmann G, Kaeser SA, Odenthal J, Radde R, Eldh T, Gandy S, Aguzzi A, Staufenbiel M, Mathews PM, Wolburg H, Heppner FL, Jucker M. Formation and maintenance of Alzheimer’s disease β-amyloid plaques in the absence of microglia. Nat. Neurosci. 2009;12:1361–1363. doi: 10.1038/nn.2432. [DOI] [PMC free article] [PubMed] [Google Scholar]
- Haynes SE, Hollopeter G, Yang G, Kurpius D, Dailey ME, Gan W-B, Julius D. The P2Y12 receptor regulates microglial activation by extracellular nucleotides. Nat. Neurosci. 2006;9:1512–1519. doi: 10.1038/nn1805. [DOI] [PubMed] [Google Scholar]
- Hefendehl JK, Wegenast-Braun BM, Liebig C, Eicke D, Milford D, Calhoun ME, Kohsaka S, Eichner M, Jucker M. Long-term in vivo imaging of β-amyloid plaque appearance and growth in a mouse model of cerebral β-amyloidosis. J. Neurosci. 2011;31:624–629. doi: 10.1523/JNEUROSCI.5147-10.2011. [DOI] [PMC free article] [PubMed] [Google Scholar]
- Hefendehl JK, Milford D, Eicke D, Wegenast-Braun BM, Calhoun ME, Grathwohl SA, Jucker M, Liebig C. Repeatable target localization for long-term in vivo imaging of mice with 2-photon microscopy. J. Neurosci. Methods. 2012;205:357–363. doi: 10.1016/j.jneumeth.2011.10.029. [DOI] [PubMed] [Google Scholar]
- Hildebrand T, Rüegsegger P. A new method for the model-independent assessment of thickness in three-dimensional images. J. Microsc. 1997;185:67–75. [Google Scholar]
- Hirasawa T, Ohsawa K, Imai Y, Ondo Y, Akazawa C, Uchino S, Kohsaka S. Visualization of microglia in living tissues using Iba1-EGFP transgenic mice. J. Neurosci. Res. 2005;81:357–362. doi: 10.1002/jnr.20480. [DOI] [PubMed] [Google Scholar]
- Hof PR, Morrison JH. The aging brain: morphomolecular senescence of cortical circuits. Trends Neurosci. 2004;27:607–613. doi: 10.1016/j.tins.2004.07.013. [DOI] [PubMed] [Google Scholar]
- Jucker M, Ingram DK. Murine models of brain aging and age-related neurodegenerative diseases. Behav. Brain Res. 1997;85:1–26. doi: 10.1016/s0166-4328(96)02243-7. [DOI] [PubMed] [Google Scholar]
- Kaneko H, Nishiguchi KM, Nakamura M, Kachi S, Terasaki H. Characteristics of bone marrow-derived microglia in the normal and injured retina. Invest. Ophthalmol. Vis. Sci. 2008;49:4162–4168. doi: 10.1167/iovs.08-1738. [DOI] [PubMed] [Google Scholar]
- Kettenmann H, Hanisch UK, Noda M, Verkhratsky A. Physiology of Microglia. Physiol. Rev. 2011;91:461–553. doi: 10.1152/physrev.00011.2010. [DOI] [PubMed] [Google Scholar]
- Kettenmann H, Kirchhoff F, Verkhratsky A. Microglia: new roles for the synaptic stripper. Neuron. 2013;77:10–18. doi: 10.1016/j.neuron.2012.12.023. [DOI] [PubMed] [Google Scholar]
- Li CH, Tam PKS. An iterative algorithm for minimum cross entropy thresholding. Pattern Recogn. Lett. 2011;19:771–776. [Google Scholar]
- Luo X-G, Ding J-Q, Chen S-D. Microglia in the aging brain: relevance to neurodegeneration. Mol. Neurodegener. 2010;5:12. doi: 10.1186/1750-1326-5-12. [DOI] [PMC free article] [PubMed] [Google Scholar]
- Merlini M, Davalos D, Akassoglou K. In vivo imaging of the neurovascular unit in CNS disease. Intravital. 2012;1:87–94. doi: 10.4161/intv.22214. [DOI] [PMC free article] [PubMed] [Google Scholar]
- Nimmerjahn A, Kirchhoff F, Helmchen F. Resting microglial cells are highly dynamic surveillants of brain parenchyma in vivo. Science. 2005;308:1314–1318. doi: 10.1126/science.1110647. [DOI] [PubMed] [Google Scholar]
- Njie EG, Boelen E, Stassen FR, Steinbusch HWM, Borchelt DR, Streit WJ. Ex vivo cultures of microglia from young and aged rodent brain reveal age-related changes in microglial function. Neurobiol. Aging. 2012;33:e1–12. doi: 10.1016/j.neurobiolaging.2010.05.008. [DOI] [PMC free article] [PubMed] [Google Scholar]
- Paolicelli RC, Bolasco G, Pagani F, Maggi L, Scianni M, Panzanelli P, Giustetto M, Ferreira TA, Guiducci E, Dumas L, Ragozzino D, Gross CT. Synaptic pruning by microglia is necessary for normal brain development. Science. 2011;333:1456–1458. doi: 10.1126/science.1202529. [DOI] [PubMed] [Google Scholar]
- Perry VH, Matyszak MK, Fearn S. Altered antigen expression of microglia in the aged rodent CNS. Glia. 1993;7:60–67. doi: 10.1002/glia.440070111. [DOI] [PubMed] [Google Scholar]
- Petersen MA, Dailey ME. Diverse microglial motility behaviors during clearance of dead cells in hippocampal slices. Glia. 2004;46:195–206. doi: 10.1002/glia.10362. [DOI] [PubMed] [Google Scholar]
- Ransohoff RM, Perry VH. Microglial physiology: unique stimuli, specialized responses. Annu. Rev. Immunol. 2009;27:119–145. doi: 10.1146/annurev.immunol.021908.132528. [DOI] [PubMed] [Google Scholar]
- Rapp PR, Gallagher M. Preserved neuron number in the hippocampus of aged rats with spatial learning deficits. Proc. Natl Acad. Sci. USA. 1996;93:9926–9930. doi: 10.1073/pnas.93.18.9926. [DOI] [PMC free article] [PubMed] [Google Scholar]
- Saijo K, Glass CK. Microglial cell origin and phenotypes in health and disease. Nat. Rev. Immunol. 2011;11:775–787. doi: 10.1038/nri3086. [DOI] [PubMed] [Google Scholar]
- Schafer DP, Lehrman EK, Kautzman AG, Koyama R, Mardinly AR, Yamasaki R, Ransohoff RM, Greenberg ME, Barres BA, Stevens B. Microglia sculpt postnatal neural circuits in an activity and complement-dependent manner. Neuron. 2012;74:691–705. doi: 10.1016/j.neuron.2012.03.026. [DOI] [PMC free article] [PubMed] [Google Scholar]
- Shaked I, Tchoresh D, Gersner R, Meiri G, Mordechai S, Xiao X, Hart RP, Schwartz M. Protective autoimmunity: interferon-gamma enables microglia to remove glutamate without evoking inflammatory mediators. J. Neurochem. 2005;92:997–1009. doi: 10.1111/j.1471-4159.2004.02954.x. [DOI] [PubMed] [Google Scholar]
- Sierra A, Gottfried-Blackmore AC, McEwen BS, Bulloch K. Microglia derived from aging mice exhibit an altered inflammatory profile. Glia. 2007;55:412–424. doi: 10.1002/glia.20468. [DOI] [PubMed] [Google Scholar]
- Spires TL, Meyer-Luehmann M, Stern EA, McLean PJ, Skoch J, Nguyen PT, Bacskai BJ, Hyman BT. Dendritic spine abnormalities in amyloid precursor protein transgenic mice demonstrated by gene transfer and intravital multiphoton microscopy. J. Neurosci. 2005;25:7278–7287. doi: 10.1523/JNEUROSCI.1879-05.2005. [DOI] [PMC free article] [PubMed] [Google Scholar]
- Streit WJ, Miller KR, Lopes KO, Njie E. Microglial degeneration in the aging brain–bad news for neurons? Front. Biosci. 2008;13:3423–3438. doi: 10.2741/2937. [DOI] [PubMed] [Google Scholar]
- Tremblay M-È, Lowery RL, Majewska AK. Microglial interactions with synapses are modulated by visual experience. PLoS Biol. 2010;8:e1000527. doi: 10.1371/journal.pbio.1000527. [DOI] [PMC free article] [PubMed] [Google Scholar]
- Tremblay M-È, Zettel ML, Ison JR, Allen PD, Majewska AK. Effects of aging and sensory loss on glial cells in mouse visual and auditory cortices. Glia. 2012;60:541–558. doi: 10.1002/glia.22287. [DOI] [PMC free article] [PubMed] [Google Scholar]
- Uemura E. Age-related changes in the subiculum of Macaca mulatta: dendritic branching pattern. Exp. Neurol. 1985;87:412–427. doi: 10.1016/0014-4886(85)90172-4. [DOI] [PubMed] [Google Scholar]
- Venneti S, Wiley CA, Kofler J. Imaging microglial activation during neuroinflammation and alzheimer’s disease. J. Neuroimmune. Pharmacol. 2008;4:227–243. doi: 10.1007/s11481-008-9142-2. [DOI] [PMC free article] [PubMed] [Google Scholar]
- Wake H, Moorhouse AJ, Jinno S, Kohsaka S, Nabekura J. Resting microglia directly monitor the functional state of synapses in vivo and determine the fate of ischemic terminals. J. Neurosci. 2009;29:3974–3980. doi: 10.1523/JNEUROSCI.4363-08.2009. [DOI] [PMC free article] [PubMed] [Google Scholar]
- Zhang B, Gaiteri C, Bodea L-G, Wang Z, McElwee J, Podtelezhnikov AA, Zhang C, Xie T, Tran L, Dobrin R, Fluder E, Clurman B, Melquist S, Narayanan M, Suver C, Shah H, Mahajan M, Gillis T, Mysore J, MacDonald ME, Lamb JR, Bennett DA, Molony C, Stone DJ, Gudnason V, Myers AJ, Schadt EE, Neumann H, Zhu J, Emilsson V. Integrated systems approach identifies genetic nodes and networks in late-onset Alzheimer’s disease. Cell. 2013;153:707–720. doi: 10.1016/j.cell.2013.03.030. [DOI] [PMC free article] [PubMed] [Google Scholar]