

Abstract
Understanding the genetic structure of human populations has important implications for the design and interpretation of disease mapping studies and reconstructing human evolutionary history. To date, inferences of human population structure have primarily been made with common variants. However, recent large-scale resequencing studies have shown an abundance of rare variation in humans, which may be particularly useful for making inferences of fine-scale population structure. To this end, we used an information theory framework and extensive coalescent simulations to rigorously quantify the informativeness of rare and common variation to detect signatures of fine-scale population structure. We show that rare variation affords unique insights into patterns of recent population structure. Furthermore, to empirically assess our theoretical findings, we analyzed high-coverage exome sequences in 6,515 European and African American individuals. As predicted, rare variants are more informative than common polymorphisms in revealing a distinct cluster of European–American individuals, and subsequent analyses demonstrate that these individuals are likely of Ashkenazi Jewish ancestry. Our results provide new insights into the population structure using rare variation, which will be an important factor to account for in rare variant association studies.
Keywords: information theory, exome sequencing, recent demography
Introduction
The genetic structure of human population remains a subject of intense interest as its study provides insight into the historical events that have caused departures from random mating (Novembre and Ramachandran 2011). More practically, population structure has important implications for understanding global variation in disease prevalence and can confound disease association studies (Yu et al. 2005; Price et al. 2006), even at intracontinental scales (Mathieson and McVean 2012; O'Connor et al. 2013). Although broad-scale patterns of population structure among continental groups are well understood (Rosenberg et al. 2002; International HapMap Consortium et al. 2007), delimiting recently emerged and fine-scale population structure has received comparatively less attention (Yu et al. 2002; Campbell et al. 2005; Novembre et al. 2008; Biswas et al. 2009).
Large-scale resequencing studies have found that humans harbor a vast excess of rare variation, primarily due to recent dramatic increases in population size (Keinan and Clark 2012; Nelson et al. 2012; Tennessen et al. 2012; Fu et al. 2013). As rare variants are more geographically restricted compared to common variants (Gravel et al. 2011; Tennessen et al. 2012), they may provide a powerful resource to delineate fine-scale patterns of population structure (Baye et al. 2011; 1000 Genomes Project Consortium 2012). Indeed, it has long been known that rare variants may be of particular use in studies of population structure (Slatkin 1985). More recently, an analysis of approximately 200 genes sequenced in over 14,000 individuals (Nelson et al. 2012) found a substantial reduction in allele sharing for rare versus common variants among European populations. Similarly, the 1000 Genomes Project found that almost all common variants were shared among multiple populations and rare variants (<0.5%) were predominantly population specific (∼53%; 1000 Genomes Project Consortium 2012).
Despite the considerable progress made in leveraging rare variation to infer patterns of population structure, many population genetics questions remain about the relative information content of rare and common variation. Here, we use an information theoretical framework (Rosenberg et al. 2003) to systematically quantify the ability of rare and common variation to reveal signatures of fine-scale population structure. We also empirically assess patterns of population structure present in rare and common variation by analyzing 6,515 exomes sequenced to high-coverage (mean depth >100×) in European–Americans (EA; N = 4,298) and African–Americans (AA; N = 2,217) (Fu et al. 2013). Our theoretical and empirical analyses demonstrate that rare variation contains considerable information about fine-scale population structure, and will be a powerful tool to understand recent population demographic history(Baye et al. 2011; Gravel et al. 2011; De la Cruz and Raska 2014; Genome of the Netherlands Consortium 2014; Mathieson and McVean 2014).
Results and Discussion
Quantifying the Information Content of Rare and Common Variants
To quantify the differences in signatures of population structure contained in rare and common variants, we used an information theory framework (Rosenberg et al. 2003) to contrast how informative variants of different frequencies are in capturing signals of population structure. We explicitly tested the hypothesis that rare variation is more informative about recent demographic changes through simulations (fig. 1a). We simulated two populations of 1,000 individuals each, varying the time of population splitting (Ts), and tested the ability of equal numbers (N = 1,000) of common or rare variants to accurately predict ancestry using the program FRAPPE (see Materials and Methods). We focused on a relatively small number of variants so that subtle differences in informativeness could be detected, which may otherwise be masked. There is a clear difference in the ability of rare and common variants to identify ancestry (fig. 1b), with rare variation being much more accurate in cases of recent population splitting. In contrast, common variants require significantly older split times for the same level of accuracy. For example, when the time for population expansion was set to 5,000 years ago (5 kya), the accuracy of rare variants rose from random expectations (i.e., 50% from a random assignment of individuals to one of two clusters) at a split time of 5 kya to approximately 90% by 8 kya, whereas with common variation it took longer than 20 kya to arrive at the same level of accuracy.
Fig. 1.

Relative informativeness of rare and common variants. (a) Summary of the demographic model used. NA, NB, and NF denote the ancestral population size, the bottleneck population size, and the final population size, respectively. Ts and Te indicate the time to population splitting and bottleneck. Population expansion begins immediately when the bottleneck ends. (b) Ancestry proportions estimated by FRAPPE as a function of the time to population splitting. (c) The expected IG for common (blue) and rare (red) variants as a function of the time to population splitting. Black lines denote the ratio of rare to common IG. (d) Inset of panel C for the time to population splitting in the range of 0–20 kya.
Moreover, the relative information content of rare and common variants is also significantly different (see fig. 1c and d; supplementary figs. S1 and S2, Supplementary Material online). Information gain (IG) is a measure of the increase in information of assignment to a population from an individual single nucleotide variant (SNV) (Rosenberg et al. 2003). IG is larger for common variants when split times are much older than the time of expansion (Te). In our simulations, we observe that for some of the parameters, Te = 0 or 5 kya, there is a small window of time right before the expansion where the IG for rare SNVs is equal to or higher than common SNVs. As the time between Ts and Te increases, there is an approximately linear increase in IG for common variants as the two populations have significant time to differentiate from drift, whereas the rare variant IG plateaus, as by definition they are only informative for a small number of individuals. In other words, they approach the definition-induced maximum of 0.5% in one population and 0% in the other.
Signatures of Fine-Scale Population Structure in a Large Exome Data set
To extend these theoretical insights, we next analyzed the exome data described in Fu et al. (2013). Specifically, 6,515 individuals were sequenced for 15,336 genes covering approximately 22.4 MB (megabasepair) of sequence. Of the 1.2 million SNVs discovered, 31,760 (2.6%) were common with a minor allele frequency (MAF) of >10% and 1,098,181 (90.7%) were rare with a MAF <0.5% in the combined sample. The average number of common and rare alleles per individual was 17,599 and 1,237 in AAs and 16,514 and 451 in EAs, respectively.
We first performed a principal components analysis (PCA) to identify qualitative differences in empirical patterns of population structure between common and rare variants. For common variants, individuals are dispersed along PC1 according to their level of African/European ancestry and PC2 results in the separation of EA individuals (fig. 2a) that is consistent with a North/South cline (supplementary fig. S3, Supplementary Material online). In the PCA of rare variants (fig. 2b), PC1 again reflects the level of admixture in AAs (common VS rare PC1 r2 = 0.918; supplementary fig. S4, Supplementary Material online). PC2 between common and rare variants is more modestly correlated (r2 = 0.661; supplementary fig. S5, Supplementary Material online), and two distinct clusters emerge that are not as apparent with common variants (consisting of 191 and 32 EA individuals, respectively). These visual clusters can largely be recapitulated using an unsupervised clustering algorithm (see Materials and Methods). Note the larger cluster of 191 individuals is identifiable in a biplot of PC1 versus PC4 with common variants when the analysis is restricted to EA samples only (supplementary fig. S6, Supplementary Material online). Thus, although detectable by common variation, the signature of fine-scale population structure is much more pronounced with rare variation. We will denote the large outlier cluster of individuals as Cluster 1 and the smaller cluster as Cluster 2; the remaining EA individuals are referred to as Cluster 3 (see also supplementary figs. S7 and S8, Supplementary Material online). We performed a number of quality control analyses and found no evidence that Clusters 1 and 2 were due to technical artifacts (see Supplementary material, Supplementary Material online).
Fig. 2.
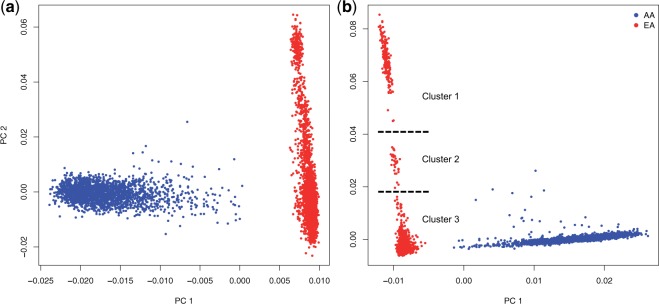
PCA of common and rare variation. (a) PCA results for the first two principal components of the 6,515 ESP individuals using common variants (MAF ≥ 10%). AA are in blue and EA are in red. (b) PCA results for the same individuals using rare variants (MAF ≤ 0.5%).
We genotyped 26 of the 191 Cluster 1 individuals with an Illumina 1 M chip and intersected it with single nucleotide polymorphism (SNP) genotypes from the Human Genome Diversity Panel (HGDP) data (Li et al. 2008). To gain insight into the possible geographic origins of Cluster 1 individuals, we performed a Procrustes analysis (Wang et al. 2010) to project the values of the first two PCs of HGDP European individuals onto a map (fig. 3a; see supplementary text S1, Supplementary Material online), and used this projection to predict a potential geographic source of Cluster 1 individuals. This analysis suggests that the ancestry of Cluster 1 individuals can be traced to the South Eastern corner of Europe near the Mediterranean Sea (fig. 3a) and outside what would be expected for the European populations sampled in HGDP. We next intersected our SNP genotype data with that from Behar et al. (2010), which contains a more comprehensive sampling of populations around the European and Middle Eastern Mediterranean areas, Northern Africa, and Jewish populations. The Jewish populations were sampled from across the globe and showed local admixture, but a core Middle Eastern component of ancestry (Behar et al. 2010). The final data set consisted of 1,337 individuals (excluding HGDP individuals from the Americas and Oceania) and approximately 228 K SNPs after filtering (see Materials and Methods).
Fig. 3.

PCA and Procrustes analysis of the combined SNP data. (a) Procrustes projection (blue) using the longitude/latitude values (black) and the PCA values from the HGDP European samples (Ady, Adygei, Russia Caucasus; Fre, French, France; Nor, North Italian, Italy; Orc, Orcadian, Orkney Islands; Rus, Russian, Russia; Sar, Sardinian, Italy; and Tus, Tuscan, Italy). The predicted position of the Cluster 1 samples is shown in red. (b) Global PCA of the 1,337 individuals from 83 populations (including Cluster 1 representatives) labeled by major geographical or ethnic group. The inset highlights the position of Cluster 1 in red.
We performed three additional analyses on this combined data set to infer the ancestry of Cluster 1 individuals. First, PCA reveals a close association with Europeans (fig. 3b), but also a colocalization with some Jewish populations, particularly individuals of Ashkenazi ancestry (fig. 3b inset; supplementary fig. S9, Supplementary Material online). Second, we performed an admixture analysis using the program FRAPPE (Tang et al. 2005). Using eight clusters (i.e., K = 8), similar to Behar et al. (2010) and Bray et al. (2010), we found that Cluster 1 individuals have very similar admixture proportions to the Jewish populations and are subtly distinct from Europeans (fig. 4a; supplementary fig. S10, Supplementary Material online) (Atzmon et al. 2010). Finally, we constructed a neighbor-joining tree from Nei's genetic distance (Nei 1972) (fig. 4b). Cluster 1 individuals cluster most tightly with the Ashkenazi Jewish sample, then with the Sephardic Jewish sample. From these results, we conclude that Cluster 1 individuals have Ashkenazi Jewish ancestry. We note that, there is also a subset of AA individuals that are outliers in the same direction on PC2 as Cluster 1 individuals. Although additional data are necessary to fully interpret this observation, it is plausible that these individuals also have Ashkenazi ancestry.
Fig. 4.

Cluster 1 individuals are closely related to individuals of Ashkenazi Jewish ancestry. (a) The global FRAPPE analysis with K = 8, focused on European and Middle Eastern populations. The remaining populations are in supplementary figure S8, Supplementary Material online. (b) Neighbor-joining tree based on Nei's genetic distance. Green branches denote the main group of Jewish populations and Cluster 1 is highlighted by the red circle. Note, Cluster 1 groups with Ashkenazi and then Sephardic Jewish populations.
Finally, we integrated insights from the theoretical framework described above and empirical observations from the ESP to understand the informativeness of rare and common variants. To this end, it is important to consider the cumulative information in addition to the IG of a single variant. For example, although a single common variant has a greater expected IG compared with a single rare variant, there are considerably more rare variants in humans. To more quantitatively assess the cumulative information content of common and rare variants, we calculated the sum of the expected information gained (i.e., E[IG]*NSNVs). Note we are assuming IG is independent for each variant; this will overestimate the cumulative IG, but the bias will be larger for common variants as they will on average have greater correlation. In a comparison between AA individuals and Cluster 3, the ratio of rare to common cumulative IG is 0.241 implying a greater information content for common variants, even with 13.14 times more rare than common variants. In contrast, the cumulative information content ratio between Clusters 1 and 3 is 2.28 with 7.37 more rare than common variants. This difference is primarily driven by the values of E(IG) for the two comparisons (Cluster 3 vs. AA: rare = 5.04 × 10⁻⁴, common = 0.027, rare/common = 0.018; Clusters 1 and 3: rare = 1.44 × 10⁻⁴, common = 4.66 × 10⁻⁴, rare/common =0.31; for similar values of alternative pairings see supplementary table S1, Supplementary Material online). Comparing these ratios to those obtained from simulations (fig. 1b) suggests that the separation of Clusters 1 and 3 likely took place just before recent population expansions (∼5–10 kya) (Nelson et al. 2012; Tennessen et al. 2012; Fu et al. 2013), whereas Cluster 3 and AA took place earlier (∼50–100 kya), consistent with previous estimates of split times between European and African populations (Cavalli-Sforza et al. 1994; Keinan and Clark 2012).
In summary, we have shown that rare variation is poised to provide new insights into recent patterns of human population structure. Although the information content of a single rare variant in detecting population structure is often smaller than a single common variant, their sheer abundance in contemporary human populations (Nelson et al. 2012; Tennessen et al. 2012; Fu et al. 2013) make the cumulative information contained a powerful tool for testing hypotheses about fine-scale population structure. In contrast to a previous study, we found less homogeneity in PCA of rare variants potentially due to the greater genetic diversity in our study with split times that predate population expansions and a larger sample size (De la Cruz and Raska 2014). We considered a limited number of demographic models, and it is plausible that rare variants may be even more powerful to detect recently emerged population structure in different demographic scenarios, which warrants further study.
More pragmatically, our results have important implications for rare variant association studies. Specifically, it is well-known that unrecognized population structure can cause spurious associations in disease mapping studies. As rare variants are potentially more sensitive to fine-scale patterns of population structure, common variants may not be able to fully correct for this potential confounding variable (Mathieson and McVean 2012; O'Connor et al. 2013). Finally, our results suggest that the ESP Exome Variant Server (EVS; http://evs.gs.washington.edu/EVS/, last accessed December 1, 2014) will be a valuable resource for screening or prioritization of causal Mendelian or de novo variants (O'Roak et al. 2011) for individuals of Ashkenazi ancestry.
Materials and Methods
Coalescent Simulations
To evaluate the relative power of common and rare variants (defined as >10% and <0.5%, respectively), we performed coalescent simulations with the program msms (Ewing and Hermisson 2010) (see supplementary table S2, Supplementary Material online). msms also has a forward simulation component when modeling selection, which we have not included in our simulations. We simulated two populations with 1,000 individuals in each population that split at time Ts = 1, 2, 3, … , 20 kya. For each Ts, we considered three different times to the start of expansion (Te): 0 (no growth), 5, and 10 kya where they had a bottleneck of 0.1*Ne and exponentially expanded to 2,000,000 individuals (see fig. 1a). These parameters were chosen to be similar to observed estimations across human populations. They are not meant to be representative of a specific group.
For common and rare variants, we randomly selected 1,000 SNVs and used FRAPPE (Tang et al. 2005) to calculate ancestry predictions. We used a greedy algorithm to assign clusters to the populations, by matching a cluster to a population which has the largest average ancestry proportion predicted for each of the individuals. Thus, the worst possible prediction would have every individual about equally assigned for the two clusters and the assignment of cluster will go by chance to the population with an average slightly higher than an even split, that is, just over 50%. We then report the average accuracy out of 50 replicates for each set of parameter values.
Information Theory
We used the framework developed by Rosenberg et al. (2003) to calculate the information content of SNVs. The general equation for IG or “informativeness of assignment” is:
where, j is an index of alleles (N = 2), i is an index of the populations with K = 2 total, qi is the proportion of the sample which is in population i, and pj is the average allele frequency for the jth allele across all populations and is calculated as:
where pij is the allele frequency of variant j in population i. In simulations of unequal sample sizes, we did not observe differences in informativeness pattern compared with when equal sample sizes were used (data not shown). The use of In also assumes discrete population assignments. Thus, it assumes an absence of admixture and therefore is only a measure of how accurately we can delineate between population labels, not coefficients of admixture from a program like FRAPPE (Rosenberg et al. 2003; Tang et al. 2005).
Building upon this framework, we calculated the expected IG of a variant with a particular MAF through the following equation:
where C is the minor allele count (e.g., 2 for doubletons, 3 for tripletons), M is the set of alleles with a particular number of missing individuals, thus giving a subtly different allele frequency (pijlm), and rlm is empirically estimated from the sample with the constraint and represents the proportion of C with m missing and which has a specific allele distribution between the populations (e.g., for C = 2, K = 2, and N = 2; l = 0 is two allele copies in population i = 2, l = 1 is one in each population, l = 2 is two in population i = 1). Complexity obviously increases with more populations and higher allele frequencies (i.e., as C increases), but we only consider N = 2. This equation provides the expected IG for a specific count of the site frequency spectrum. In other words, it gives the IG of the average doubleton, tripleton, or so on. In a similar manner, we can calculate the average IG for a span of allele frequencies by taking the weighted average across a range of minor allele counts. Thus, the expected IG values we report are integrated empirically across the observed site frequency spectrum.
We used the theory presented above and performed a series of simulations with msms using the demographic model described in figure 4a (msms command line argument is described in supplementary table S2, Supplementary Material online). Here, we used a sample size of 500 diploid individuals per population. We considered values of Ts = 0, 1, … 20, 30, … 100 kya and time of population expansion, Te = 0, 5, 10 kya. We repeated the analysis with and without a bottleneck starting at time Te. In this case, we used all SNVs produced, not limiting them to a specific number for either common or rare.
Genetic Data
We analyzed 6,515 high-coverage exomes (sequenced to a mean depth >100×) generated as part of the NHLBI Exome Sequencing Project. For a detailed description of the data and filtering process please see the supplementary material, Supplementary Material online, for Fu et al. (2013). We performed SNP genotyping using an Illumina 1 M chip on 26 individuals identified as Cluster 1 (see fig. 2b) according to the manufacturer's protocol. These individuals were selected randomly from the set of Cluster 1 individuals who had sufficient amounts of DNA available. We also obtained SNP genotype data from the HGDP (Li et al. 2008), which includes 852 unrelated (Biswas et al. 2009) individuals after excluding Native American and Oceanian populations. In addition, SNP data were included from 459 individuals from Behar et al. (2010), which increased the number of samples from European, Jewish (Ashkenazi, Azerbaijan, Bene Israel, Cochin, Ethiopian, Georgian, Iranian, Iraq, Moroccan, Sephardic, Uzbekistan, and Yemeni Jewish populations), Middle East, South East Asian, and North and Sub Saharan African populations. In combining the SNP genotype data from Cluster 1, HGDP, and Behar et al., we used the following filters: MAF>5%, linkage disequilibrium (LD) pruning r2>0.5 using PLINK (—indep-pairwise 50 5 0.5; Purcell et al. 2007), and removing sites with greater than 1% missing data. Here, we used a threshold of MAF>5% in order to maintain a high level of variation. PLINK's LD pruning method removes SNPs with a window approach where, with our parameters, all pairwise SNPs are compared in a 50 SNP window and one of the SNPs is removed if they are found to have an r2 greater than 0.5, finally the window is shifted 5 SNPs and the process is repeated (http://pngu.mgh.harvard.edu/∼purcell/plink/summary.shtml#prune, last accessed December 1, 2014). The filtered SNP genotype data set consisted of 1,337 individuals from 82 populations with 228,126 markers.
Population Structure Analysis
We performed PCA on the exome data separately for common (MAF>10%) and rare variants (MAF < 0.5%). Both data sets were filtered for LD similar to the genotype data, that is, LD r2>0.5 and PCA was performed using the program EIGENSTRAT (Price et al. 2006). Clusters were identified by eye and can be primarily derived using a DBSCAN cluster algorithm (Ester et al. 1996) implemented in R (fpc package) with a few outliers that do not affect the results. We performed four analyses on the combined SNP data set consisting of the 26 Cluster 1, HGDP, and Behar et al. (2010) individuals: PCA, Procrustes analysis (Wang et al. 2010), FRAPPE (Tang et al. 2005), and a neighbor-joining tree of the populations. The Procrustes analysis was performed as described in Wang et al. (2010), and we projected HGDP European individuals (see supplementary material, Supplementary Material online) from PCA space onto longitude/latitude coordinates of the populations obtained from the HGDP project. For the FRAPPE analyses, we ran ten replicates with K = 8, to be comparable to other studies of the HGDP and Behar et al. data sets that used K = 7 and 8 (Behar et al. 2010; Bray et al. 2010). Using a likelihood step difference threshold of 0.001, we selected the replicate with the highest log likelihood. To perform the neighbor-joining tree, we calculated the population allele frequencies of each SNP and used the programs SEQBOOT, GENDIST, NEIGHBOR, and CONSENSE from the package PHYLIP (Felsenstein 1993). We obtained the unrooted consensus tree from 500 bootstraps of Nei's genetic distance (Nei 1972) and visualized the tree using MEGA5 (Tamura et al. 2011).
Supplementary Material
Supplementary material, text S1, table S1 and S2, and figures S1–S10 are available at Molecular Biology and Evolution online (http://www.mbe.oxfordjournals.org/).
Acknowledgments
The authors thank Chaolong Wang for R code to perform Procrustes analysis. The authors wish to acknowledge the support of the National Heart, Lung, and Blood Institute (NHLBI) and the contributions of the research institutions, study investigators, field staff, and study participants in creating this resource for biomedical research. Funding for GO ESP was provided by NHLBI grants RC2 HL-103010 (HeartGO), RC2 HL-102923 (LungGO), and RC2 HL-102924 (WHISP). The exome sequencing was performed through NHLBI grants RC2 HL-102925 (BroadGO) and RC2 HL-102926 (SeattleGO). Filtered sets of annotated variants and their allele frequencies are available at http://evs.gs.washington.edu/EVS/, SNVs have been deposited in dbSNP (http://www.ncbi.nlm.nih.gov/snp) and genotypes and phenotypes from a large subset of individuals are also available via dbGaP (http://www.ncbi.nlm.nih.gov/gap) using the following accession information: NHLBI GO-ESP: Women's Health Initiative Exome Sequencing Project (WHI), pht002246.v2.p2, phs000281.v2.p2; NHLBI GO-ESP: Lung Cohorts Exome Sequencing Project (Cystic Fibrosis), ESP_LungGO_CF_PA_Culture_Data, pht002227.v1.p1, phs000254.v1.p1; NHLBI GO-ESP: Early-Onset Myocardial Infarction (Broad EOMI), pht001437.v1.p1, phs000279.v1.p1; NHLBI GO-ESP: Lung Cohorts Exome Sequencing Project (Pulmonary Arterial Hypertension), PAH_Subject_Phenotypes_Baseline_Measures, pht002277.v1.p1, phs000290.v1.p1; NHLBI GO-ESP: Lung Cohorts Exome Sequencing Project (Lung Health Study of Chronic Obstructive Pulmonary Disease), pht002272.v1.p1, phs000291.v1.p1; NHLBI GO-ESP: Heart Cohorts Exome Sequencing Project (ARIC), phs000398; NHLBI GO-ESP: Heart Cohorts Exome Sequencing Project (CARDIA), phs000399; NHLBI GO-ESP: Heart Cohorts Exome Sequencing Project (CHS), phs000400; NHLBI GO-ESP: Heart Cohorts Exome Sequencing Project (FHS), phs000401; NHLBI GO-ESP: Heart Cohorts Exome Sequencing Project (Jackson Heart Study), phs000402; NHLBI GO-ESP: Heart Cohorts Exome Sequencing Project (MESA), phs000403; NHLBI GO-ESP: Heart Cohorts Exome Sequencing Project (SWISS), phs000327.
References
- 1000 Genomes Project Consortium. An integrated map of genetic variation from 1,092 human genomes. Nature. 2012;491:56–65. doi: 10.1038/nature11632. [DOI] [PMC free article] [PubMed] [Google Scholar]
- Atzmon G, Hao L, Pe'er I, Velez C, Pearlman A, Palamara PF, Morrow B, Friedman E, Oddoux C, Burns E, Ostrer H. Abraham's Children in the Genome Era: Major Jewish Diaspora Populations Comprise Distinct Genetic Clusters with Shared Middle Eastern Ancestry. The American Journal of Human Genetics. 2010;86:850–859. doi: 10.1016/j.ajhg.2010.04.015. [DOI] [PMC free article] [PubMed] [Google Scholar]
- Baye TM, He H, Ding L, Kurowski BG, Zhang X, Martin LJ. Population structure analysis using rare and common functional variants. BMC Proc. 2011;5:S8. doi: 10.1186/1753-6561-5-S9-S8. [DOI] [PMC free article] [PubMed] [Google Scholar]
- Behar DM, Yunusbayev B, Metspalu M, Metspalu E, Rosset S, Parik J, Rootsi S, Chaubey G, Kutuev I, Yudkovsky G, et al. The genome-wide structure of the Jewish people. Nature. 2010;466:238–242. doi: 10.1038/nature09103. [DOI] [PubMed] [Google Scholar]
- Biswas S, Scheinfeldt LB, Akey JM. Genome-wide insights into the patterns and determinants of fine-scale population structure in humans. Am J Hum Genet. 2009;84:641–650. doi: 10.1016/j.ajhg.2009.04.015. [DOI] [PMC free article] [PubMed] [Google Scholar]
- Bray SM, Mulle JG, Dodd AF, Pulver AE, Wooding S, Warren ST. Signatures of founder effects, admixture, and selection in the Ashkenazi Jewish population. Proc Natl Acad Sci U S A. 2010;107:16222–16227. doi: 10.1073/pnas.1004381107. [DOI] [PMC free article] [PubMed] [Google Scholar]
- Campbell CD, Ogburn EL, Lunetta KL, Lyon HN, Freedman ML, Groop LC, Altshuler D, Ardlie KG, Hirschhorn JN. Demonstrating stratification in a European American population. Nat Genet. 2005;37:868–872. doi: 10.1038/ng1607. [DOI] [PubMed] [Google Scholar]
- Cavalli-Sforza LL, Menozzi P, Piazza A. The history and geography of human genes. Princeton (NJ): Princeton University Press; 1994. [Google Scholar]
- De la Cruz O, Raska P. Population structure at different minor allele frequency levels. BMC Proc. 2014;8:S55. doi: 10.1186/1753-6561-8-S1-S55. [DOI] [PMC free article] [PubMed] [Google Scholar]
- Ester M, Kriegel H-P, Sander J, Xu X. A density-based algorithm for discovering clusters in large spatial databases with noise. KDD-96 Proceedings, Portland. 1996;96:226–231. [Google Scholar]
- Ewing G, Hermisson J. MSMS: a coalescent simulation program including recombination, demographic structure and selection at a single locus. Bioinformatics. 2010;26:2064–2065. doi: 10.1093/bioinformatics/btq322. [DOI] [PMC free article] [PubMed] [Google Scholar]
- Felsenstein J. 1993. PHYLIP: phylogenetic inference package, version 3.5c, Department of Genome Sciences, University of Washington, Seattle. [Google Scholar]
- Fu W, O'Connor TD, Jun G, Kang HM, Abecasis G, Leal SM, Gabriel S, Rieder MJ, Altshuler D, Shendure J, et al. Analysis of 6,515 exomes reveals the recent origin of most human protein-coding variants. Nature. 2013;493:216–220. doi: 10.1038/nature11690. [DOI] [PMC free article] [PubMed] [Google Scholar]
- Genome of the Netherlands Consortium. Whole-genome sequence variation, population structure and demographic history of the Dutch population. Nat Genet. 2014;46:818–825. doi: 10.1038/ng.3021. [DOI] [PubMed] [Google Scholar]
- Gravel S, Henn BM, Gutenkunst RN, Indap AR, Marth GT, Clark AG, Yu F, Gibbs RA, Genomes P, Bustamante CD. Demographic history and rare allele sharing among human populations. Proc Natl Acad Sci U S A. 2011;108:11983–11988. doi: 10.1073/pnas.1019276108. [DOI] [PMC free article] [PubMed] [Google Scholar]
- International HapMap Consortium. Frazer KA, Ballinger DG, Cox DR, Hinds DA, Stuve LL, Gibbs RA, Belmont JW, Boudreau A, Hardenbol P, et al. A second generation human haplotype map of over 3.1 million SNPs. Nature. 2007;449:851–861. doi: 10.1038/nature06258. [DOI] [PMC free article] [PubMed] [Google Scholar]
- Keinan A, Clark AG. Recent explosive human population growth has resulted in an excess of rare genetic variants. Science. 2012;336:740–743. doi: 10.1126/science.1217283. [DOI] [PMC free article] [PubMed] [Google Scholar]
- Li JZ, Absher DM, Tang H, Southwick AM, Casto AM, Ramachandran S, Cann HM, Barsh GS, Feldman M, Cavalli-Sforza LL. Worldwide human relationships inferred from genome-wide patterns of variation. Science. 2008;319:1100–1104. doi: 10.1126/science.1153717. [DOI] [PubMed] [Google Scholar]
- Mathieson I, McVean G. Differential confounding of rare and common variants in spatially structured populations. Nat Genet. 2012;44:243–246. doi: 10.1038/ng.1074. [DOI] [PMC free article] [PubMed] [Google Scholar]
- Mathieson I, McVean G. Demography and the age of rare variants. PLoS Genet. 2014;10:e1004528. doi: 10.1371/journal.pgen.1004528. [DOI] [PMC free article] [PubMed] [Google Scholar]
- Nei M. Genetic distance between populations. Am Nat. 1972;106:283–292. [Google Scholar]
- Nelson MR, Wegmann D, Ehm MG, Kessner D, St Jean P, Verzilli C, Shen J, Tang Z, Bacanu SA, Fraser D, et al. An abundance of rare functional variants in 202 drug target genes sequenced in 14,002 people. Science. 2012;337:100–104. doi: 10.1126/science.1217876. [DOI] [PMC free article] [PubMed] [Google Scholar]
- Novembre J, Johnson T, Bryc K, Kutalik Z, Boyko AR, Auton A, Indap A, King KS, Bergmann S, Nelson MR, et al. Genes mirror geography within Europe. Nature. 2008;456:98–101. doi: 10.1038/nature07331. [DOI] [PMC free article] [PubMed] [Google Scholar]
- Novembre J, Ramachandran S. Perspectives on human population structure at the cusp of the sequencing era. Annu Rev Genomics Hum Genet. 2011;12:245–274. doi: 10.1146/annurev-genom-090810-183123. [DOI] [PubMed] [Google Scholar]
- O'Connor TD, Kiezun A, Bamshad M, Rich SS, Smith JD, Turner E, NHLBIGO Exome Sequencing Project Statistical Analysis Working Group, Leal SM, Akey JM, et al. Fine-scale patterns of population stratification confound rare variant association tests. PLoS One. 2013;8:e65834. doi: 10.1371/journal.pone.0065834. [DOI] [PMC free article] [PubMed] [Google Scholar]
- O'Roak BJ, Deriziotis P, Lee C, Vives L, Schwartz JJ, Girirajan S, Karakoc E, MacKenzie AP, Ng SB, Baker C. Exome sequencing in sporadic autism spectrum disorders identifies severe de novo mutations. Nat Genet. 2011;43:585–589. doi: 10.1038/ng.835. [DOI] [PMC free article] [PubMed] [Google Scholar]
- Price AL, Patterson NJ, Plenge RM, Weinblatt ME, Shadick NA, Reich D. Principal components analysis corrects for stratification in genome-wide association studies. Nat Genet. 2006;38:904–909. doi: 10.1038/ng1847. [DOI] [PubMed] [Google Scholar]
- Purcell S, Neale B, Todd-Brown K, Thomas L, Ferreira MA, Bender D, Maller J, Sklar P, De Bakker PI, Daly MJ. PLINK: a tool set for whole-genome association and population-based linkage analyses. Am J Hum Genet. 2007;81:559–575. doi: 10.1086/519795. [DOI] [PMC free article] [PubMed] [Google Scholar]
- Rosenberg NA, Li LM, Ward R, Pritchard JK. Informativeness of genetic markers for inference of ancestry. Am J Hum Genet. 2003;73:1402–1422. doi: 10.1086/380416. [DOI] [PMC free article] [PubMed] [Google Scholar]
- Rosenberg NA, Pritchard JK, Weber JL, Cann HM, Kidd KK, Zhivotovsky LA, Feldman MW. Genetic structure of human populations. Science. 2002;298:2381–2385. doi: 10.1126/science.1078311. [DOI] [PubMed] [Google Scholar]
- Slatkin M. Rare alleles as indicators of gene flow. Evolution. 1985;39:53–65. doi: 10.1111/j.1558-5646.1985.tb04079.x. [DOI] [PubMed] [Google Scholar]
- Tamura K, Peterson D, Peterson N, Stecher G, Nei M, Kumar S. MEGA5: molecular evolutionary genetics analysis using maximum likelihood, evolutionary distance, and maximum parsimony methods. Mol Biol Evol. 2011;28:2731–2739. doi: 10.1093/molbev/msr121. [DOI] [PMC free article] [PubMed] [Google Scholar]
- Tang H, Peng J, Wang P, Risch NJ. Estimation of individual admixture: analytical and study design considerations. Genet Epidemiol. 2005;28:289–301. doi: 10.1002/gepi.20064. [DOI] [PubMed] [Google Scholar]
- Tennessen JA, Bigham AW, O'Connor TD, Fu W, Kenny EE, Gravel S, McGee S, Do R, Liu X, Jun G, et al. Evolution and functional impact of rare coding variation from deep sequencing of human exomes. Science. 2012;337:64–69. doi: 10.1126/science.1219240. [DOI] [PMC free article] [PubMed] [Google Scholar]
- Wang C, Szpiech ZA, Degnan JH, Jakobsson M, Pemberton TJ, Hardy JA, Singleton AB, Rosenberg NA. Comparing spatial maps of human population-genetic variation using Procrustes analysis. Stat Appl Genet Mol. 2010;9:13. doi: 10.2202/1544-6115.1493. [DOI] [PMC free article] [PubMed] [Google Scholar]
- Yu J, Pressoir G, Briggs WH, Bi IV, Yamasaki M, Doebley JF, McMullen MD, Gaut BS, Nielsen DM, Holland JB. A unified mixed-model method for association mapping that accounts for multiple levels of relatedness. Nat Genet. 2005;38:203–208. doi: 10.1038/ng1702. [DOI] [PubMed] [Google Scholar]
- Yu N, Chen F-C, Ota S, Jorde LB, Pamilo P, Patthy L, Ramsay M, Jenkins T, Shyue S-K, Li W-H. Larger genetic differences within Africans than between Africans and Eurasians. Genetics. 2002;161:269–274. doi: 10.1093/genetics/161.1.269. [DOI] [PMC free article] [PubMed] [Google Scholar]
Associated Data
This section collects any data citations, data availability statements, or supplementary materials included in this article.