

Abstract
Attempts to reconstruct the evolutionary history of snake toxins in the context of their co-option to the venom gland rarely account for nonvenom snake genes that are paralogous to toxins, and which therefore represent important connectors to ancestral genes. In order to reevaluate this process, we conducted a comparative transcriptomic survey on body tissues from a venomous snake. A nonredundant set of 33,000 unigenes (assembled transcripts of reference genes) was independently assembled from six organs of the medically important viperid snake Bothrops jararaca, providing a reference list of 82 full-length toxins from the venom gland and specific products from other tissues, such as pancreatic digestive enzymes. Unigenes were then screened for nontoxin transcripts paralogous to toxins revealing 1) low level coexpression of approximately 20% of toxin genes (e.g., bradykinin-potentiating peptide, C-type lectin, snake venom metalloproteinase, snake venom nerve growth factor) in body tissues, 2) the identity of the closest paralogs to toxin genes in eight classes of toxins, 3) the location and level of paralog expression, indicating that, in general, co-expression occurs in a higher number of tissues and at lower levels than observed for toxin genes, and 4) strong evidence of a toxin gene reverting back to selective expression in a body tissue. In addition, our differential gene expression analyses identify specific cellular processes that make the venom gland a highly specialized secretory tissue. Our results demonstrate that the evolution and production of venom in snakes is a complex process that can only be understood in the context of comparative data from other snake tissues, including the identification of genes paralogous to venom toxins.
Keywords: Bothrops jararaca, transcriptome, venom gland, snake toxin, differential expression, Serpentes
Introduction
Protein neofunctionalization is one of the major processes driving snake venom evolution. Several snake venom toxins have seemingly evolved from the recruitment of physiological molecules that underwent convergent or divergent pathways to play a role in killing and paralyzing prey or defending the organism (Ivanov CP and Ivanov OC 1979; Fry et al. 2006; Lynch 2007; Brust et al. 2013).
These selected molecules are reasonably well known, as snake venoms have long been studied by biochemical, proteomic, and transcriptomic approaches. The latter have provided an important contribution to the field of toxinology, by elucidating the diversity of molecules from different protein classes that are present in venom (Junqueira-de-Azevedo and Ho 2002; Ching et al. 2006; Pahari et al. 2007; Casewell et al. 2009, 2014; Leão et al. 2009; Durban et al. 2011; Rokyta et al. 2012). Nevertheless, with the exception of a few nonvenomous species (Schwartz et al. 2010; Castoe et al. 2011; Reyes-Velasco et al. 2014), no global view of gene expression in the other body tissues of a venomous snake has been described. Genomic characterizations of snakes are also neglected and are only recently becoming available (Castoe et al. 2013; Vonk et al. 2013). Thus, the repertoire of body proteins and the tissue location of their expression remain predominately unknown.
A remarkable feature of many snakes is the ability of some species to produce, in a controlled way, high amounts of complex protein solution used for an external purpose (i.e., injection into prey)—venom. Snake venom glands (VGs) are very specialized tissues that possess a high capacity of protein synthesis, storage, and secretion. The proportion of secretor granules in viperid VG cells has been shown to account for only 4% of the cell volume and mRNA and protein synthesis are rapidly initiated, suggesting that secretion constitutes a fast process (Rotenberg et al. 1971; De Lucca and Imaizumi 1972; Oron and Bdolah 1973). However, the cellular mechanisms regulating protein production/secretion in the VG are essentially unknown. To assess whether these processes are specialized or shared with other secretory tissues, it is necessary to first gain a greater understanding of the genes expressed in different snake tissues.
The lack of information about nonvenom genes also impairs some important understandings relating to the process underpinning the evolution of venom. This is because without an adequate knowledge about the physiological counterparts that gave rise to toxins during their evolutionary history, phylogenetic analyses aimed at determining the origin of toxins are deprived of a fundamental component and instead have to rely on genes from other kinds of organisms. This important aspect began to be addressed recently (Casewell et al. 2012) by analyzing the evolution of snake toxins in the context of snake body proteins related to those toxins. The evolutionary pathways observed in this study revealed an unexpected scenario of plasticity, represented by events of venom recruitment, followed by reverse recruitment to nonvenom functions in some cases. However, this study used nonvenom genes from several nonvenomous snake species to compare with venom genes from venomous species. There are few animals for which toxin-related transcripts were investigated in other tissues to be compared with the VG-expressed toxins, including the first know venomous crustacean (von Reumont et al. 2014). It would be expected that comparing the venom and nonvenom genes from the same venomous species of snake would improve the robustness of such an analysis.
More recently, a study analyzed the coexpression of venom toxins in a moderate number of snake tissues, including the skin and scent gland (Hargreaves, Swain, Hegarty, et al. 2014). The authors suggested that genes related to venom toxins are coexpressed in multiple tissues and have subsequently been restricted to the VG (Hargreaves, Swain, Hegarty, et al. 2014). This is in contrast to a previous hypothesis whereby toxin antecedents were thought to be expressed in a specific tissue type before a change in expression location to the VG occurred (Fry 2005). Unfortunately, the expression level of toxin-related genes in different snake tissues was not quantified by Hargreaves, Swain, Hegarty, et al. (2014), thereby providing a major limitation to the interpretation of their results. By contrast, the analysis of Fry (2005) was limited by largely utilizing tissue data from nonsnake taxa to predict the origin of venom genes—a limitation inherent to the time of study when few gene sequences from snake tissues existed.
Here, we conducted a comparative transcriptomic survey on the VG and other body tissues of the viperid snake Bothrops jararaca—the most medically important snake in Brazil and one of the most well studied in terms of venom. We profiled the diversity and expression of genes found in a diverse number of snake tissues and compared them with VG data to provide a better understanding of snake physiology, venom production, and the evolutionary history of snake venom toxins.
Results and Discussion
Bothrops jararaca Reference Transcriptome
Transcriptomes from different tissues of B. jararaca were generated by 454-pyrosequencing. Sequencing of cDNA fragment libraries from the VG, pancreas, liver, kidney, brain, and heart generated a total of 884,235 reads that, after filtering against adaptors, primers, vertebrate ribosomal RNAs (rRNAs), short and low quality sequences, resulted in 560,242 high-quality sequences. These sequences were assembled into contigs in a hierarchical manner, first from each tissue and then by combining the different tissue data sets to generate a list of reference transcripts (unigenes) from B. jararaca. A total of 33,000 unigenes were generated using this multitissue assembly approach.
Considering that 1) the majority of snake toxin classes are enriched for paralogous gene forms, sometimes with minor sequence differences; and 2) the automatic assembly of next generation sequencing data is subject to a certain level of inaccuracy due to the nature of short reads derived from fragment cDNA libraries, we checked the contigs for the occurrence of misassembled multigenes. In some cases, we rebuilt the assembly of toxin gene types under rigorous manual inspection in order to improve the distinction of putative paralogous genes and to obtain full-length transcripts. This approach permitted us to generate a refined reference data set of toxin coding transcripts for subsequent downstream analysis (see supplementary table S1, Supplementary Material online).
VG Transcriptome
In the case of the B. jararaca VG, 116,236 reads were mapped to 13,642 unigenes (table 1). The annotation process provided putative identification of 8,690 VG unigenes, corresponding to 81% of reads that could be assigned to a functional category based on significant similarity with the GenBank nr database, InterProScan screenings and GO (gene ontology) mapping—4,700 unigenes remained unidentified. The identified set was classified into the categories represented in figure 1. Transcripts coding for cellular proteins amounted to 7,069 unigenes representing 25% of total gene expression, whereas putative toxin coding transcripts were represented by 582 unigenes accounting for 53% of gene expression. This is in accordance with the 50–58% toxin expression described in previous expressed sequence tag studies on related Bothrops VG transcriptomes (Valente et al. 2009; Zelanis et al. 2012).
Table 1.
Bothrops jararaca Transcriptome Sequencing and Assemble.
| Raw Reads | Filtered Reads | Average Size (bp) | Mapped Reads | Expressed Contigs | Annotated Contigs | Unique Contigs | |
|---|---|---|---|---|---|---|---|
| VG | 219,550 | 142,726 | 367.0 | 116,236 | 13,642 | 8,690 | 3,074 |
| Liver | 66,870 | 41,471 | 200.7 | 31,391 | 6,030 | 4,263 | 589 |
| Pancreas | 223,070 | 26,163 | 250.4 | 19,422 | 2,728 | 1,809 | 449 |
| Kidney | 120,472 | 115,958 | 319.1 | 85,090 | 14,235 | 9,786 | 1,343 |
| Brain | 121,245 | 117,412 | 374.2 | 75,214 | 18,354 | 11,465 | 4,646 |
| Heart | 133,028 | 116,512 | 383.0 | 88,784 | 15,546 | 10,092 | 2,868 |
| Total | 884,235 | 560,242 | 344.2 | 416,137 | 33,044 | 20,486 | – |
Fig. 1.

Transcriptomic profile of the VGs of Bothrops jararaca. (A) Relative expression, indicated by the percentage of total expression values (RPKM) of all transcripts (upper panel) and among venom-related transcripts (lower panel). (B) Gene diversity, indicated by the percentage of the number of total transcripts (unigenes) (upper panel) and among venom-related transcripts (lower panel). The venom-related category corresponds to transcripts coding for known or putative toxins, classified based on their sequence similarities to known toxin superfamilies. Numbers in parentheses indicate the expression percentage and the number of reference transcripts in each category.
The relative abundances of the major toxin classes identified (fig. 1) are also in agreement with these previous transcriptomic surveys. In total, 16 toxin types were identified in the VG transcriptome (fig. 1), represented by 92 reference toxin transcripts, of which 79 contained full-length open read frames (supplementary table S1, Supplementary Material online). Fifteen corresponded to variant or identical forms of previously identified mRNAs or proteins from B. jararaca and the remaining 77 corresponded to new putative venom genes. Interestingly, some toxins (mRNA or proteins) known from this species were absent from our VG data set, including the metalloproteinase HF3 (GenBank: AF149788) and the serine protease KN-BJ (GenBank: AB004067). Presumably, these genes are not present, or are not transcribed, in the single specimen sampled here and may represent alleles unevenly distributed in the population.
Body Tissue Transcriptomes
Five other body tissues (from liver, pancreas, kidney, heart, and brain) from B. jararaca were sequenced and individually analyzed in a similar fashion to the VGs described above. The numbers of sequences obtained for each transcriptome are described in table 1. In total, 29,888 unigenes were expressed in these five tissue types, with 17,978 successfully annotated. Supplementary table S2, Supplementary Material online, details the top ten most expressed unigenes in each of these tissues.
Pancreatic Transcriptome
The pancreas is a secretory epithelium with a very specialized fluid secretion that includes several enzymes. Thus, it can be considered an appropriate tissue type for comparing gene expression with the VG, as both are secretory tissues, albeit used for distinct purposes (internal and external functions, respectively).
The pancreatic transcriptome revealed a core set of highly expressed proteinases related to digestion. The mammalian pancreas typically secretes three forms of trypsin, six of chymotrypsin, and three carboxypeptidases. All these major family members were identified in the B. jararaca pancreas (fig. 2). This is the first report of the whole set of pancreatic enzymes from a snake and most of those identified here represent full-length sequences. A serine protease inhibitor of kazal-type, containing a single kazal repeat, was also found among the most expressed genes for pancreatic polypeptides. This protein may function to prevent the action of the digestive enzymes described above during the long starvation periods that snakes are often subjected to. We also identified two lipases, which are major components of pancreatic secretions, in our data set. These genes correspond to a bile salt-activated lipase and a triacylglycerol lipase (fig. 2).
Fig. 2.
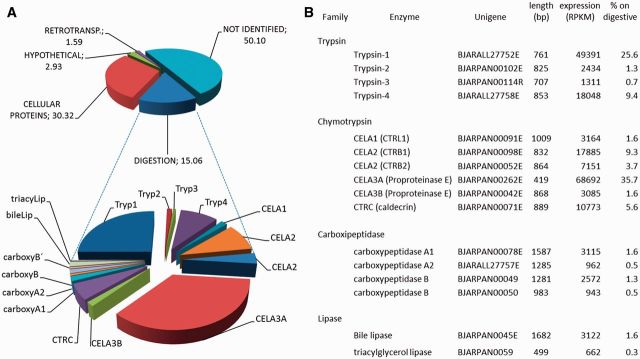
Transcriptomic profile of the pancreas of Bothrops jararaca. (A) Relative expression, indicated by the percentage of total expression values (RPKM) of all transcripts (upper panel) and those encoding digestive enzymes (lower panel). (B) Table describing the transcripts involved in digestion identified in the transcriptome.
In organisms that feed on relatively large prey, such as many snakes, digestive enzymes are critical and therefore have an expected high activity, thus becoming an interesting model for enzymatic studies (Secor and Diamond 1998; Castoe et al. 2013). Moreover, the putative production of high amounts of a complete set of digestive enzymes in the pancreas of B. jararaca suggests that these secretions have the capacity to promote prey digestion. These data therefore support the current hypothesis that venom is used primarily for prey capture and has no apparent effect on the “predigestion” of prey (McCue 2007), despite many venom enzymes being capable of promoting tissue digestion (Bottrall et al. 2010).
The most expressed unigenes in the pancreas also revealed some unexpected pancreatic proteins (supplementary table S2, Supplementary Material online), such as natterin. Natterin is the major toxin of some venomous fishes and possesses a proteolytic kininogenase activity (Magalhães et al. 2005). Interestingly, natterin-related genes have an uneven distribution across vertebrate taxa, having been retrieved from the genomes of reptiles, birds and other fishes, but seemingly absent from amphibians or mammals—presumably as the result of independent gene loss during the evolution of tetrapod lineages. Nevertheless, our identification of its selective expression in the snake pancreas, combined with its previously determined proteolytic activity in fish venom, suggests a digestive function of the ancestral natterin protein.
Nontoxin Genes and Pathways Enhanced in the VG
Genes with a potential role in the VG machinery were identified by comparing unigene expression levels in the VG with other tissues. The scatter plot displayed in figure 3 demonstrates that toxin genes (marked in red) have a strong prevalence in the VG, as expected. However, some nontoxin unigenes were found to have a considerably higher level of expression in the VG than on average in the other tissues (marked in green), with some exclusively expressed in the VG (marked in yellow and found on the x axis). Details of these specific unigenes are provided in supplementary tables S3 and S4, Supplementary Material online, respectively. In addition to comparing gene expression, we analyzed whether specific GO categories are enriched in the subset of those nontoxin genes that we found unregulated in the VG, when compared with the general occurrence of genes in all other tissues (fig. 4).
Fig. 3.

Scatter plot showing the relationship of gene expression values (normalized RPKM Log10) in the VG (VGLA) and the average of all other tissues (TISSUES). Red spots represent toxin annotated genes. Green spots represent nontoxin genes that have a ≥20 fold change in expression level and/or are highly expressed in the VG. Yellow spots represent the top ten most expressed nontoxin genes with selective expression in the VG. Blue spots represent the remaining annotated genes.
Fig. 4.

Histogram showing the GO biological process categories enriched in the VG. Gene Enrichment analysis was performed by BLAST2Go software by comparing the number of unigenes annotated with a given GO category in a test set (VG differentially expressed unigenes) against the number of those genes in a reference set (all annotated unigenes) and selecting enriched categories by statistical significance (P ≤ 0.05) using Fisher’s exact test.
The functions of the majority of the most differentially expressed unigenes identified in the VG relate to processes involved in venom biosynthesis and pathways relevant to protein secretion. The identity of many of these enriched genes suggests roles relating to protein processing, particularly peptidases and modifying enzymes that are likely to be important for the production of venom toxins. Chaperones are also highly represented in the VG as well as proteins involved in disulfide bond formation. Although few individual unigenes were associated with glycosylation pathways, the gene enrichment test highlighted the apparent importance of this pathway for venom biosynthesis. Vesicular traffic, an important process for a specialized secretory tissue, was also detected as one of the most enriched processes for the VG differentially expressed unigenes.
A more detailed description and discussion of the differentially expressed genes and their biological pathways in the VG are provided in the supplementary discussion, Supplementary Material online. In addition to providing evidences of the processing mechanisms that act to control venom production, our profile of VG enhanced unigenes describes, from a molecular point of view, the specialization of this tissue to produce a suite of stable proteins that are highly secreted, structurally diverse and hydrolytic in nature. Understanding the molecular basis of this high-production, neuronally controlled, secretory system that has no obvious parallel in other vertebrates therefore provides a novel insight into the cellular regulation of glandular systems.
Reserpine Treatment Does Not Impair Toxin Production
The release of venom from the snake VG during biting or manual extraction leads to morphological changes in the venom secretory cells and starts a new cycle of venom production (Kochva 1987). The sympathetic nervous system has been shown to play an important role in the regulation of this process in B. jararaca. Both alpha and beta adrenoceptors have been implicated in venom production, as the stimulation of both receptors triggers a complex intracellular signaling that culminates in the activation of NFkappaB and AP-1 transcription factors and regulation of the synthesis of proteins in the VG (Yamanouye et al. 1997, 2000; Kerchove et al. 2004, 2008; Luna et al. 2009). The importance of the sympathetic system was demonstrated by treating snakes with reserpine, an alkaloid that depletes catecholamine from the peripheral sympathetic nerve. After treatment, it was shown that 1) no venom could be collected by milking and 2) the secretory cells of the VG remain in a quiescent-like stage, with narrow rough endoplasmic reticulum cisternae and no secretory vesicles, indicative of little or no venom production (Yamanouye et al. 1997). However, reserpine treatment does not seem to irreversibly damage the VG, unlike for example rat salivary glands (Martinez et al. 1975; Johnson 1988), as adrenoceptor stimulation reverses its effect (Yamanouye et al. 1997).
We therefore investigated the effect of reserpine treatment on mRNA expression in the VG of B. jararaca. According to the established model of the VG secretory process, we would expect this treatment to impair toxin production or, alternatively, block the secretory pathway. When comparing the VG transcriptomes of reserpine treated and untreated individuals our data showed a surprisingly high level of similarity. In terms of the quantitative composition of the transcriptome, toxin-related transcripts amounted to 58% of the total transcripts (fig. 5A)—highly comparable to the 53% obtained in the untreated VG transcriptome and, qualitatively, all major classes of toxins were detected in similar amounts in comparison to the untreated specimen. We confirmed these results by quantitative polymerase chain reaction (qPCR) analysis of representative toxin mRNAs, which demonstrated that toxins are not downregulated in reserpine-treated specimens. In fact, in some cases the treated animals presented with a higher level of toxin expression (fig. 5B). These results suggest that noradrenergic innervation does not influence the transcription of toxin genes. In agreement with this finding, our recent study of the VG proteome showed that several toxin types are present in the secretory cells of the quiescent VG of B. jararaca and some of them were present only in this stage (Luna et al. 2013). Taken together, these data suggest that venom production may be more dependent on a fine regulation of other cellular processes than solely on general protein synthesis. Further investigation of specific genes related to these pathways using more biological replicates would aid the future identification of the mechanisms involved.
Fig. 5.

Transcriptomic profile of the VGs of Bothrops jararaca specimens treated with reserpine demonstrating the high expression of toxin encoding genes. (A) Relative expression, indicated by the percentage of total expression values (RPKM) of all transcripts. (B) qPCR expression levels of selected toxin genes in treated and untreated individuals (N = 3; **P < 0.05; *P < 0.01).
The Evolution of Snake Venom Toxins and Their Nontoxin Paralogs
To investigate the evolutionary history of snake venom toxins, we constructed phylogenetic trees using our toxin and nontoxin paralog data for the following gene families: bradykinin-potentiating peptide (BPP), cobra venom factor, C-type lectin (CTL), cysteine-rich secretory protein (CRISP), cystatin, hyaluronidase, LAAO, phospholipase A2 (PLA2), snake venom nerve growth factor (NGF), snake venom metalloproteinase (SVMP), snake venom serine proteinase (SVSP), snake venom vascular endothelial growth factor (VEGF), and three-finger toxins. Venom toxins were defined as those found placed within clades containing previously described snake venom toxins (highlighted in fig. 6 and supplementary figs. S1–S12, Supplementary Material online). Only one B. jararaca gene that exhibited its greatest abundance of expression in the VG was found placed outside these previously defined snake venom toxin clades (cystatin gene BJARALL22588—supplementary fig. S5, Supplementary Material online). For the vast majority of other toxin types, we found VG expressed genes grouping phylogenetically with known snake venom toxins. Notably, we recovered multiple toxin isoforms for many of these gene families (e.g., BPP, CTL, l-amino acid oxidase [LAO], PLA2, SVSP, and SVMP), indicative of duplication events giving rise to new gene copies following their recruitment for expression in the VG of snakes, as previously described (e.g., Fry et al. 2003; Casewell et al. 2011; Vonk et al. 2013). For other toxin families, such as CRISP, hyaluronidase, and NGF, we only identified a single B. jararaca gene nested within toxin clades.
Fig. 6.
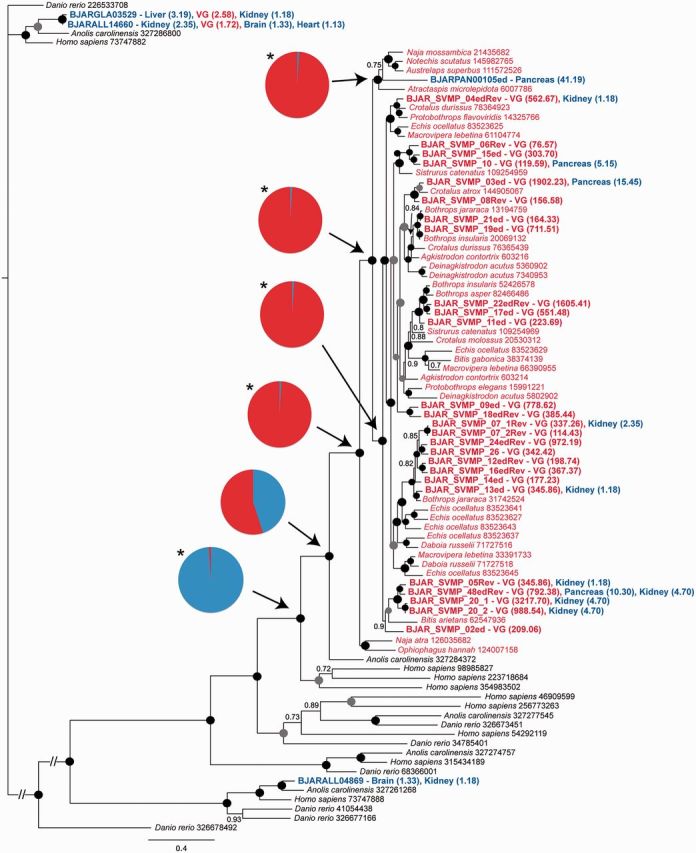
Bayesian DNA gene tree of the SVMP toxin family. Bothrops jararaca sequences are labeled in bold, with the tissue location and expression level annotated on the tip label. The tips of the tree are colored to indicate sequences sourced from the VG (red) and other snake tissues (blue). Pie charts represent the Bayesian posterior probabilities (Bayesian pp) of ancestral state reconstructions at that node: Red, venom; blue, nonvenom. Asterisks highlight significant support (Bayesian pp ≥ 0.95) for a character state at ancestral nodes. Circles placed at internal tree nodes indicate the Bayesian pp for that node: Black = 1.00; gray ≥ 0.95.
Recently Hargreaves, Swain, Hegarty, et al. (2014) suggested that the location of expression of snake toxins has been restricted to the VG following their recruitment to this tissue type. However, an absence of data quantifying gene expression in different tissues limits our interpretation of this seemingly rational hypothesis, particularly as the pathogenic viper toxin families analyzed by the authors do not appear to be selectively expressed in the VG of the venomous snake sampled (Hargreaves, Swain, Hegarty, et al. 2014). We therefore investigated the location of expression of B. jararaca toxin genes using our transcriptomic data sets. Our results demonstrate that the majority of toxins are indeed selectively expressed in the VG, and typically at high levels (fig. 7A—note the logarithmic scale). Although these results are novel, this observation was expected, and corresponds with previous theories relating to venom evolution (e.g., Casewell et al. 2012; Fry et al. 2012; Hargreaves, Swain, Hegarty, et al. 2014; Reyes-Velasco et al. 2014), as the expression of toxic molecules in internal tissues would be expected to be deleterious to the producing animal.
Fig. 7.

Expression analysis of snake venom toxins and their related nontoxin paralogs. (A) The location and abundance of expression (normalized RPKM Log10) of venom toxins in each of the tissue transcriptomes. Note the logarithmic scale. (B) A comparison of the percentage of venom toxin genes and their nontoxin paralogs found coexpressed in the tissue transcriptomes. The percentage of genes is defined as the percentage of all toxins and all nontoxins, respectively. (C) The location and abundance of expression of nontoxin genes that are paralogous to venom toxins as determined by phylogenetic analysis. (D) Comparisons of the mean level of venom toxin gene expression in the VG and when coexpressed in one or two other tissue types (non-VG). (E) Comparisons of the mean level of nontoxin paralog gene expression when found selectively expressed in one tissue type or coexpression in multiple tissues. The selective expression of SVSP nontoxin paralogs in the pancreas has been separated from the “one” tissue bar, such as not to skew the data.
However, we were surprised to find that approximately 20% of B. jararaca toxin unigenes are actually coexpressed in at least one other tissue type (fig. 7A and B). For example, multiple BPP, CTL, and SVMP toxins were coexpressed in the pancreas (supplementary figs. S1 and S3, Supplementary Material online, and fig. 6), some SVMP genes were also found coexpressed in the kidney (fig. 6), whereas NGF exhibited expression in the VG, liver, and heart (supplementary fig. S8, Supplementary Material online). These results suggest that the premise that snake venom toxins are only expressed in the VG is not unequivocal, and correlates with findings from another venomous vertebrate, the platypus (Whittington and Belov 2009). However, in all cases observed here the level of expression detected in non-VG tissues was significantly lower (typically >50 times) than expression in the VG (fig. 7D). It therefore seems likely that on the occasions where toxins are coexpressed, perhaps through leaky expression (Ramsköld et al. 2009), their expression level is sufficiently limited that any resulting proteins are tolerated. We should note, however, that we used 454 data in this study and it produces limited amounts of reads compared with other technologies such as Illumina. It means that the level of expression of low expressed genes is not precise and could be underestimated.
Our observations of toxin coexpression in non-VG tissues may partially explain the unusual phylogenetic placement of some toxin orthologs previously detected in non-VG tissues of Thamnophis elegans and Python bivittatus (Casewell et al. 2012). This process, termed “reverse recruitment,” suggested that some genes recruited early in venomous snake ancestors for expression in the VG may subsequently have evolved profiles for expression in nonvenom tissues, whereas the expression location of the other descendants remained restricted to the VG. A recent study dismissed this mechanism of gene evolution (Hargreaves, Swain, Logan, et al. 2014) as “less parsimonious” than a situation where the gene of interest has always been expressed in non-VG tissues. However, this interpretation ignores the shared ancestry of the reverse recruited genes with toxin orthologs found expressed in the VGs of other species. Utilizing the B. jararaca tissue transcriptomes we identified the strongest case for reverse recruitment identified to date, where an SVMP gene nested within the snake toxin clade was found to be exclusively expressed in the pancreas (fig. 6). The placement of this gene within the venom toxin clade, where it groups with elapid SVMPs (sharing 80% similarity) at the base of the venom toxin radiation, was validated by Bayes factor analysis (supplementary table S5, Supplementary Material online). Furthermore, stochastic mutational mapping character analysis robustly supported (Bayesian Posterior Probability = 0.99) the premise that this gene is derived from venom toxins (fig. 6)—therefore suggesting that the location of gene expression has changed from the VG to the pancreas. Further discussion of other non-VG expressed B. jararaca genes forming monophyletic groups with venom toxins can be found in the supplementary discussion, Supplementary Material online.
Our phylogenetic analyses also provided information regarding the location of expression of nontoxin paralogs related to toxin genes. We identified these genes in 8 of the 13 toxin families analyzed (fig. 7C). No discernible pattern of tissue expression was observed for these paralogous genes, with some selectively expressed in individual tissues (SVSP, hyaluronidase), whereas others were found to be coexpressed in two (SVMP, VEGF), three (cobra venom factor), or five (3FTX, cystatin) different tissue types (fig. 7B). Notably, the expression levels of all of these paralogs were low irrespective of their tissue location, and significantly lower than the expression level of venom toxins in the VG (P < 0.001; two-tailed t-test). The sole exception to this were the nearest recovered paralogs to the SVSPs, which were represented by four trypsin genes found abundantly expressed in the pancreas of B. jararaca at comparative expression levels to their VG toxin counterparts (fig. 7E). In general, however, nontoxin paralogs were found coexpressed in a higher number of tissues than venom toxins (fig. 7B), correlating with recent reports that python nontoxin gene orthologs are often coexpressed in multiple tissues at low levels (Reyes-Velasco et al. 2014).
We harnessed this recently published information on venom toxin orthologs recovered from the Burmese python (Reyes-Velasco et al. 2014) to compare changes in the location of gene expression in venom toxin gene families. We used B. jararaca data to describe 1) the location of expression of toxin genes and nontoxin paralogs in the liver, kidney, pancreas, brain, heart, and VG and 2) the location of expression of the nontoxin orthologs identified from the python in these same tissue types. Comparisons of these data provide a complicated picture of change in the location of expression of genes associated with toxin families (fig. 8). For example, some appear to show a transition from wide levels of coexpression in paralogous genes to lesser coexpression in python orthologs to abundant expression in the VG (e.g., CTL), whereas others show more selective expression of nontoxin genes in fewer tissues types and an apparent switch to selective expression in the VG (e.g., hyaluronidase, PLA2). It is clear that changes in the location of expression of these gene families have occurred over evolutionary time and, as suggested by the recently proposed SINNER model of venom evolution (Reyes-Velasco et al. 2014), the evolution of venom toxins appears to have involved the switching of low level physiological expression to high levels of tissue-specific expression in the VG, followed by a reduction, or perhaps little change, in expression levels in nonvenom-related tissues.
Fig. 8.
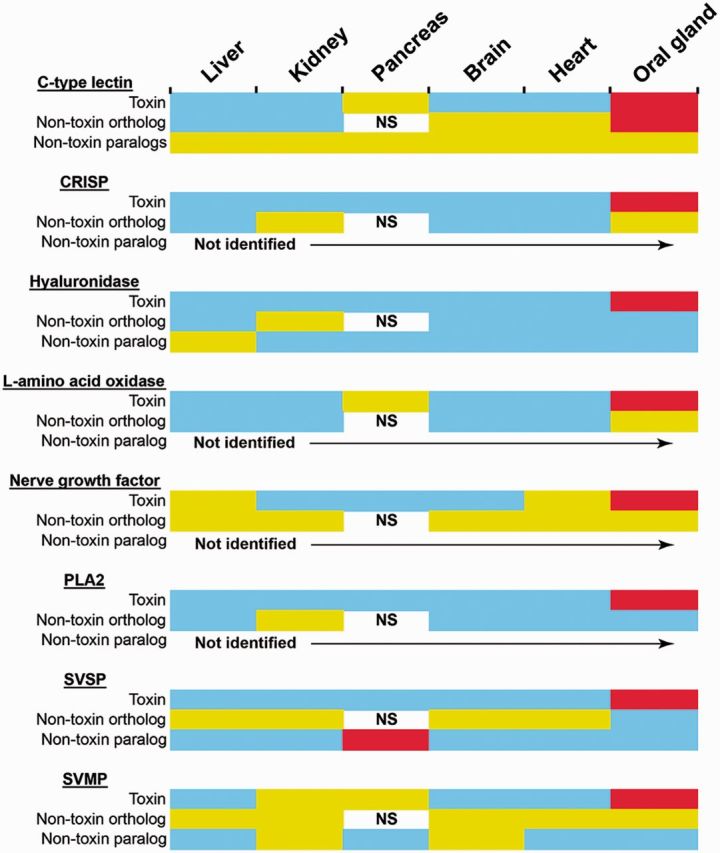
Reconstructing changes in the location of expression of venom toxin genes and their orthologs and paralogs. For each viper toxin family, the locations of expression of nontoxin paralogs (identified here from Bothrops jararaca), nontoxin orthologs (identified from the nonvenomous snake Python bivittatus [Reyes-Velasco et al. 2014]), and the toxins themselves (identified here from B. jararaca) are displayed. Oral gland refers to the VG for B. jararaca and the rictal gland for P. bivittatus. Colors indicate presence/absence and level of expression: Blue, not expressed; yellow, low level expression; red, high level expression. NS indicates that pancreatic data were not sampled for P. bivittatus. Not identified indicates toxin families where we failed to detect nontoxin paralogs in our B. jararaca transcriptomes.
Conclusions
Utilizing comparative data sourced from non-VG tissues greatly improves our understanding of the evolution and production of snake venom. For example, our analyses of differentially expressed nontoxin genes detected in the VG of B. jararaca provide us novel information relating to the biological processes that are of critical importance for the production of venom. Notably, we find clear distinctions between the genes and pathways enriched in the VG in comparison with other snake secretory tissues, such as the pancreas. This is perhaps unsurprising as the evolution of a distinct secretory gland that functions to produce highly bioactive and toxic proteins for injection into other animals represents an atypical anatomical occurrence. These data reinforce our belief that venom systems have a number of unique characteristics (e.g., high production of toxic proteins, restriction of abundant levels of toxins to the VG, avoidance of self-toxicity, and intense use of posttranslational modifications). Our results also provide a rational basis to holistically investigate how venom systems (i.e., not only the snake venom toxins) have evolved. As comparative gene data relating to other animal venom systems (e.g., spiders, scorpions, etc) become available, it will be particularly interesting to identify whether the specific peptidases modifying enzymes and chaperones involved in snake toxin production are shared with other animal lineages, thereby mirroring previous reports of toxin convergence across diverse venomous taxa (Fry et al. 2009; Casewell et al. 2013).
Our analyses of gene family evolution revealed that many toxin families have evolved by a process of gene duplication, with nontoxin paralogs typically being coexpressed in non-VG tissues at low levels. By contrast, the majority of venom toxins are found selectively expressed in the VG, with some exhibiting leaky low-level expression in other body tissues, demonstrating that changes in the location and abundance of gene expression have occurred during their co-option to venom. This process may be controlled by the up or down regulation of gene transcription in different tissues and/or through the loss or gain of core promoters influencing gene transcription in different tissues types. Critically, identifying the specific mechanisms that underpin this process remains one of the major barriers limiting our understanding of how animal venom systems have evolved. It is apparent from our analyses here that additional non-VG data from other Toxicoferan reptile taxa are required to robustly reconstruct the evolutionary history of these gene families in the context of 1) changes in their location of expression and 2) the gene duplication events that are responsible for generating the diversity of toxin-related genes observed in venomous snakes.
Materials and Methods
Specimens
One adult specimen of B. jararaca from São Paulo State was obtained by the Herpetology Laboratory, Instituto Butantan, São Paulo, Brazil and used for body organ dissection (except for brain, which was removed from a second animal). First, venom was extracted and 4 days later the animal was anesthetized with sodium pentobarbital (30 mg/kg of body mass, s.c.). The organs used for tissues sampling in this study (VG, liver, pancreas, brain, heart, and kidney) were carefully dissected, frozen in liquid nitrogen, and stored at −80°C until use.
For the reserpine treatment experiment, the same procedure was adopted except that three specimens were injected with reserpine (20 mg/kg of body mass, s.c.) to deplete endogenous catecholamine stores and 24 h later venom was extracted. The animals received additional doses of reserpine (5 mg/kg) on each of the following 4 days, before they were anesthetized for VG dissection.
mRNA Extraction and 454-Pyrosequencing
For total RNA isolation, the tissues were ground into a powder in liquid nitrogen and homogenized using a Polytron Tissue Homogenizer. Total RNA was extracted with TRIZOL Reagent (Invitrogen, Life Technologies Corp.) and mRNA was prepared using the Dynabeads mRNA DIRECT kit (Invitrogen, Life Technologies Corp.). mRNA was quantified by the Quant-iT RiboGreen RNA reagent and kit (Invitrogen, Life Technologies Corp.). A cDNA library from each tissue was constructed using 500 ng of mRNA and the cDNA Synthesis System (Roche Diagnostics). Emulsion PCR amplification and library sequencing were performed individually using a GS Junior 454 Sequencing System (Roche Diagnostics) for liver, brain, kidney, and heart. VG and pancreas libraries were run on a GS FLX instrument using MID indexing on different sections of a PicoTiter Plate, according to the manufacturer’s protocols (Roche Diagnostics).
Bioinformatic Analyses
Raw sequences from each tissue were first assembled with Newbler 2.7 (Roche Diagnostics). The Newbler assembler first removed adaptors and contaminating rRNA sequences. The assembly parameters were set to 1) a minimum overlap length of 50% of the read and 2) a minimum overlap identity of 98%, with all other parameters set as default. Newbler isotig consensus sequences from each tissue were combined using Cap3 software (Huang and Madan 1999) and the De Novo assembly tool of CLC Genomics Workbench software (Qiagen) to join contigs expressed in more than one tissue. The final unigene data set included consensus sequences of combined contigs from two or more tissues (named BJARALL) and isotigs exclusively occurring in single tissues (BJAR[tissue]).
Unigenes were automatically annotated using BLAST2Go (Conesa et al. 2005) by performing a Basic Local Alignment Search Tool (BLAST) search against the UniProt database with the algorithm BLASTX to identify similar sequences. Those without annotations were subsequently searched against the GenBank nr database using BLASTN. GO categories were attributed by BLAST2Go and used for downstream analysis such as gene enrichment. Toxin categories were manually assigned by comparing the unigenes to a compiled list of known snake toxins. Final manual curation of relevant isotig sequences was undertaken to improve the quality and extension of the informatically assembled cDNAs.
Expression values of the unigenes identified in the different tissues were calculated using the RNA-Seq function of CLC Genomics Workbench software by mapping cleaned reads (without known contaminants and rRNAs) back to the unigenes and normalizing by unigene length using RPKM (reads per kilobase per million of mapped reads).
Quantitative PCR
RNA was isolated from the VGs of reserpine-treated and untreated animals and 1 µg of total RNA was reverse transcribed using SuperScriptTM III First Strand Synthesis System for RT-PCR (Invitrogen) according to the manufacturer’s instructions. Quantitative PCR experiments were performed in StepOnePlusTM (Applied Biosystems) using PlatinumSYBR Green qPCR SuperMix-UDG (Invitrogen) and SYBR Green PCR Master Mix (Applied Biosystems). For normalization, ΔCt values were calculated using the formula: ΔCt = (Cttarget − Ctcontrol), where control corresponds to the level of GAPDH (glyceraldehyde 3-phosphate dehydrogenase) transcript. Fold differences in normalized gene expression were calculated by dividing the level of expression of the reserpine-treated with the untreated sample. The results generated from three replicates were corrected to reduce the weight of individual variations in the statistical analysis (Willems et al. 2008). Significance was assessed using a two-tailed Student’s t-test and a P-value cutoff of ≤0.05.
Evolutionary Analyses
Bothrops jararaca toxin sequences were incorporated into gene family sequence alignments containing toxin and nontoxin gene homologs and paralogs sourced from other snakes and representative outgroup taxa. Sequences were obtained from our previous work (Casewell et al. 2012; Vonk et al. 2013) and supplemented by BLAST searching the GenBank nucleotide database. DNA data sets were trimmed to the open reading frame in MEGA6 (Tamura et al. 2013), with identical sequences and those containing truncations or frameshifts (as the result of indels) excluded, before they were aligned using MUSCLE (Edgar 2004) and checked manually.
For phylogenetic analysis, we used MrBayes v3.2 (Ronquist et al. 2012) to generate DNA gene trees for each toxin family. We first selected models of sequence evolution for each codon using MrModelTest v2.3 (https://www.abc.se/∼nylander/mrmodeltest2/mrmodeltest2.html, last accessed December 15, 2014) to determine the model favored by the Akaike Information Criterion (supplementary table S6, Supplementary Material online). We implemented these models in Bayesian Inference analyses, using MrBayes on the CIPRES Science Gateway (www.phylo.org, last accessed December 15, 2014). Each data set was run in duplicate using four chains simultaneously (three heated and one cold) for 1 × 10⁷ generations, sampling every 500th cycle from the chain and using default settings in regards to priors. Tracer v1.5 (http://beast.bio.ed.ac.uk/Tracer, last accessed December 15, 2014) was used to estimate effective sample sizes for all parameters (with a minimum of 200 deemed acceptable) and to construct plots of ln(L) against generation to verify the point of convergence (burnin), with all trees generated prior to this point (the first 25%) discarded. We then annotated the resulting consensus gene trees with information relating to the location and level of expression of the B. jararaca sequences identified in our different tissue transcriptomes.
To test alternative hypotheses relating to the phylogenetic placement of specific B. jararaca sequences of interest within the gene trees, we used Bayes factors (Kass and Raftery 1995) and stochastic mutational mapping character analyses (Huelsenbeck et al. 2003; Bollback 2006). These analyses were performed as previously described (Casewell et al. 2012).
Supplementary Material
Supplementary discussion, figures S1–S13, and tables S1–S6 are available at Molecular Biology and Evolution online (http://www.mbe.oxfordjournals.org/).
Acknowledgments
This work was supported by grants from Fundação de Amparo à Pesquisa do Estado de São Paulo (FAPESP, grant numbers 12/00177-5, 2013/07467-1) and Conselho Nacional de Desenvolvimento Científico e Tecnológico (CNPq) to I.L.M.J. N.R.C. acknowledges support from the Natural Environment Research Council, United Kingdom (Fellowship #NE/J018678/1). The raw data generated in this project were deposited in GenBank BioProject section under accession code PRJNA262899.
References
- Bollback JP. SIMMAP: stochastic character mapping of discrete traits on phylogenies. BMC Bioinformatics. 2006;7:88. doi: 10.1186/1471-2105-7-88. [DOI] [PMC free article] [PubMed] [Google Scholar]
- Bottrall JL, Madaras F, Biven CD, Venning MG, Mirtschin PJ. Proteolytic activity of Elapid and Viperid Snake venoms and its implication to digestion. J Venom Res. 2010;1:18–28. [PMC free article] [PubMed] [Google Scholar]
- Brust A, Sunagar K, Undheim EAB, Vetter I, Yang DC, Casewell NR, Jackson TNW, Koludarov I, Alewood PF, Hodgson WC, et al. Differential evolution and neofunctionalization of snake venom metalloprotease domains. Mol Cell. Proteomics. 2013;12:651–663. doi: 10.1074/mcp.M112.023135. [DOI] [PMC free article] [PubMed] [Google Scholar]
- Casewell NR, Harrison RA, Wüster W, Wagstaff SC. Comparative venom gland transcriptome surveys of the saw-scaled vipers (Viperidae: Echis) reveal substantial intra-family gene diversity and novel venom transcripts. BMC Genomics. 2009;10:564. doi: 10.1186/1471-2164-10-564. [DOI] [PMC free article] [PubMed] [Google Scholar]
- Casewell NR, Huttley GA, Wüster W. Dynamic evolution of venom proteins in squamate reptiles. Nat Commun. 2012;3:1066. doi: 10.1038/ncomms2065. [DOI] [PubMed] [Google Scholar]
- Casewell NR, Wagstaff SC, Harrison RA, Renjifo C, Wüster W. Domain loss facilitates accelerated evolution and neofunctionalization of duplicate snake venom metalloproteinase toxin genes. Mol Biol Evol. 2011;28:2637–2649. doi: 10.1093/molbev/msr091. [DOI] [PubMed] [Google Scholar]
- Casewell NR, Wagstaff SC, Wüster W, Cook DAN, Bolton FMS, King SI, Pla D, Sanz L, Calvete JJ, Harrison RA. Medically important differences in snake venom composition are dictated by distinct postgenomic mechanisms. Proc Natl Acad Sci U S A. 2014;111:9205–9210. doi: 10.1073/pnas.1405484111. [DOI] [PMC free article] [PubMed] [Google Scholar]
- Casewell NR, Wüster W, Vonk FJ, Harrison RA, Fry BG. Complex cocktails: the evolutionary novelty of venoms. Trends Ecol Evol. 2013;28:219–229. doi: 10.1016/j.tree.2012.10.020. [DOI] [PubMed] [Google Scholar]
- Castoe T, de Koning APJ, Hall K, Yokoyama K, Gu W, Smith E, Feschotte C, Uetz P, Ray D, Dobry J, et al. Sequencing the genome of the Burmese python (Python molurus bivittatus) as a model for studying extreme adaptations in snakes. Genome Biol. 2011;12:406. doi: 10.1186/gb-2011-12-7-406. [DOI] [PMC free article] [PubMed] [Google Scholar]
- Castoe TA, de Koning APJ, Hall KT, Card DC, Schield DR, Fujita MK, Ruggiero RP, Degner JF, Daza JM, Gu W, et al. The Burmese python genome reveals the molecular basis for extreme adaptation in snakes. Proc Natl Acad Sci U S A. 2013;110:20645–20650. doi: 10.1073/pnas.1314475110. [DOI] [PMC free article] [PubMed] [Google Scholar]
- Ching ATC, Rocha MMT, Paes Leme AF, Pimenta DC, de Fátima D, Furtado M, Serrano SMT, Ho PL, Junqueira-de-Azevedo ILM. Some aspects of the venom proteome of the Colubridae snake Philodryas olfersii revealed from a Duvernoy’s (venom) gland transcriptome. FEBS Lett. 2006;580:4417–4422. doi: 10.1016/j.febslet.2006.07.010. [DOI] [PubMed] [Google Scholar]
- Conesa A, Götz S, García-Gómez JM, Terol J, Talón M, Robles M. Blast2GO: a universal tool for annotation, visualization and analysis in functional genomics research. Bioinformatics. 2005;21:3674–3676. doi: 10.1093/bioinformatics/bti610. [DOI] [PubMed] [Google Scholar]
- De Lucca FL, Imaizumi MT. Synthesis of ribonucleic acid in the venom gland of Crotalus durissus terrificus (Ophidia, Reptilia) after manual extraction of tne venom. Biochem J. 1972;130:335–342. doi: 10.1042/bj1300335. [DOI] [PMC free article] [PubMed] [Google Scholar]
- Durban J, Juárez P, Angulo Y, Lomonte B, Flores-Diaz M, Alape-Girón A, Sasa M, Sanz L, Gutiérrez JM, Dopazo J, et al. Profiling the venom gland transcriptomes of Costa Rican snakes by 454 pyrosequencing. BMC Genomics. 2011;12:259. doi: 10.1186/1471-2164-12-259. [DOI] [PMC free article] [PubMed] [Google Scholar]
- Edgar RC. MUSCLE: multiple sequence alignment with high accuracy and high throughput. Nucleic Acids Res. 2004;32:1792–1797. doi: 10.1093/nar/gkh340. [DOI] [PMC free article] [PubMed] [Google Scholar]
- Fry BG. From genome to “venome”: molecular origin and evolution of the snake venom proteome inferred from phylogenetic analysis of toxin sequences and related body proteins. Genome Res. 2005;15:403–420. doi: 10.1101/gr.3228405. [DOI] [PMC free article] [PubMed] [Google Scholar]
- Fry BG, Casewell NR, Wüster W, Vidal N, Young B, Jackson TNW. The structural and functional diversification of the Toxicofera reptile venom system. Toxicon. 2012;60:434–448. doi: 10.1016/j.toxicon.2012.02.013. [DOI] [PubMed] [Google Scholar]
- Fry BG, Roelants K, Champagne DE, Scheib H, Tyndall JDA, King GF, Nevalainen TJ, Norman JA, Lewis RJ, Norton RS, et al. The toxicogenomic multiverse: convergent recruitment of proteins into animal venoms. Annu Rev Genomics Hum Genet. 2009;10:483–511. doi: 10.1146/annurev.genom.9.081307.164356. [DOI] [PubMed] [Google Scholar]
- Fry BG, Vidal N, Norman JA, Vonk FJ, Scheib H, Ramjan SFR, Kuruppu S, Fung K, Hedges SB, Richardson MK, et al. Early evolution of the venom system in lizards and snakes. Nature. 2006;439:584–588. doi: 10.1038/nature04328. [DOI] [PubMed] [Google Scholar]
- Fry BG, Wüster W, Kini RM, Brusic V, Khan A, Venkataraman D, Rooney AP. Molecular evolution and phylogeny of elapid snake venom three-finger toxins. J Mol Evol. 2003;57:110–129. doi: 10.1007/s00239-003-2461-2. [DOI] [PubMed] [Google Scholar]
- Hargreaves AD, Swain MT, Hegarty MJ, Logan DW, Mulley JF. Restriction and recruitment-gene duplication and the origin and evolution of snake venom toxins. Genome Biol Evol. 2014;6:2088–2095. doi: 10.1093/gbe/evu166. [DOI] [PMC free article] [PubMed] [Google Scholar]
- Hargreaves AD, Swain MT, Logan DW, Mulley JF. Testing the Toxicofera: comparative transcriptomics casts doubt on the single, early evolution of the reptile venom system. Toxicon. 2014;92:140–156. doi: 10.1016/j.toxicon.2014.10.004. [DOI] [PubMed] [Google Scholar]
- Huang X, Madan A. CAP3: a DNA sequence assembly program. Genome Res. 1999;9:868–877. doi: 10.1101/gr.9.9.868. [DOI] [PMC free article] [PubMed] [Google Scholar]
- Huelsenbeck JP, Nielsen R, Bollback JP. Stochastic mapping of morphological characters. Syst Biol. 2003;52:131–158. doi: 10.1080/10635150390192780. [DOI] [PubMed] [Google Scholar]
- Ivanov CP, Ivanov OC. The evolution and ancestors of toxic proteins. Toxicon. 1979;17:205–220. doi: 10.1016/0041-0101(79)90210-1. [DOI] [PubMed] [Google Scholar]
- Johnson DA. Changes in rat parotid saliva protein composition following chronic reserpine treatment and their relation to inanition. Arch Oral Biol. 1988;33:463–466. doi: 10.1016/0003-9969(88)90025-8. [DOI] [PubMed] [Google Scholar]
- Junqueira-de-Azevedo IDLM, Ho PL. A survey of gene expression and diversity in the venom glands of the pitviper snake Bothrops insularis through the generation of expressed sequence tags (ESTs) Gene. 2002;299:279–291. doi: 10.1016/s0378-1119(02)01080-6. [DOI] [PubMed] [Google Scholar]
- Kass RE, Raftery A. Bayes factors. J Am Stat Assoc. 1995;90:773–795. [Google Scholar]
- Kerchove CM, Carneiro SM, Markus RP, Yamanouye N. Stimulation of the alpha-adrenoceptor triggers the venom production cycle in the venom gland of Bothrops jararaca. J Exp Biol. 2004;207:411–416. doi: 10.1242/jeb.00778. [DOI] [PubMed] [Google Scholar]
- Kerchove CM, Luna MS, Zablith MB, Lazari MF, Smaili SS, Yamanouye N. α1-adrenoceptors trigger the snake venom production cycle in secretory cells by activating phosphatidylinositol 4,5-bisphosphate hydrolysis and ERK signaling pathway. Comp Biochem Physiol. 2008;Part A 150:431–437. doi: 10.1016/j.cbpa.2008.04.607. [DOI] [PubMed] [Google Scholar]
- Kochva E. The origin of snakes and evolution of the venom apparatus. Toxicon. 1987;25:65–106. doi: 10.1016/0041-0101(87)90150-4. [DOI] [PubMed] [Google Scholar]
- Leão LI, Ho PL, Junqueira-de-Azevedo IDLM. Transcriptomic basis for an antiserum against Micrurus corallinus (coral snake) venom. BMC Genomics. 2009;10:112. doi: 10.1186/1471-2164-10-112. [DOI] [PMC free article] [PubMed] [Google Scholar]
- Luna MS, Valente RH, Perales J, Vieira ML, Yamanouye N. Activation of Bothrops jararaca snake venom gland and venom production: a proteomic approach. J Proteomics. 2013;94:460–472. doi: 10.1016/j.jprot.2013.10.026. [DOI] [PubMed] [Google Scholar]
- Luna MSA, Hortencio TMA, Ferreira ZS, Yamanouye N. Sympathetic outflow activates the venom gland of the snake Bothrops jararaca by regulating the activation of transcription factors and the synthesis of venom gland proteins. J Exp Biol. 2009;212:1535–1543. doi: 10.1242/jeb.030197. [DOI] [PubMed] [Google Scholar]
- Lynch VJ. Inventing an arsenal: adaptive evolution and neofunctionalization of snake venom phospholipase A2 genes. BMC Evol Biol. 2007;7:2. doi: 10.1186/1471-2148-7-2. [DOI] [PMC free article] [PubMed] [Google Scholar]
- Magalhães GS, Lopes-Ferreira M, Junqueira-de-Azevedo ILM, Spencer PJ, Araújo MS, Portaro FCV, Ma L, Valente RH, Juliano L, Fox JW, et al. Natterins, a new class of proteins with kininogenase activity characterized from Thalassophryne nattereri fish venom. Biochimie. 2005;87:687–699. doi: 10.1016/j.biochi.2005.03.016. [DOI] [PubMed] [Google Scholar]
- Martinez JR, Adelstein E, Quissel D, Barbero GJ. The chronically reserpinized rat as a possible model for cystic fibrosis. I. Submaxillary gland morphology and ultrastructure. Pediatr Res. 1975;9:463–469. doi: 10.1203/00006450-197505000-00001. [DOI] [PubMed] [Google Scholar]
- McCue MD. Prey envenomation does not improve digestive performance in western diamondback rattlesnakes (Crotalus atrox) J Exp Zool A Ecol Genet Physiol. 2007;307:568–577. doi: 10.1002/jez.411. [DOI] [PubMed] [Google Scholar]
- Oron U, Bdolah A. Regulation of protein synthesis in the venom gland of viperid snakes. J Cell Biol. 1973;56:177–190. doi: 10.1083/jcb.56.1.177. [DOI] [PMC free article] [PubMed] [Google Scholar]
- Pahari S, Mackessy SP, Kini RM. The venom gland transcriptome of the Desert Massasauga rattlesnake (Sistrurus catenatus edwardsii): towards an understanding of venom composition among advanced snakes (Superfamily Colubroidea) BMC Mol Biol. 2007;8:115. doi: 10.1186/1471-2199-8-115. [DOI] [PMC free article] [PubMed] [Google Scholar]
- Ramsköld D, Wang ET, Burge CB, Sandberg R. An abundance of ubiquitously expressed genes revealed by tissue transcriptome sequence data. PLoS Comput Biol. 2009;5:e1000598. doi: 10.1371/journal.pcbi.1000598. [DOI] [PMC free article] [PubMed] [Google Scholar]
- Reyes-Velasco J, Shaney KJ, Card DC, Andrew A, Adams RA, Schield D, Modahl C, Casewell NR, Mackessy SP, Castoe TA. Expression of venom homologs in the python suggests a model for venom gene recruitment. Mol Biol Evol. 2014;2:173–183. doi: 10.1093/molbev/msu294. [DOI] [PubMed] [Google Scholar]
- Rokyta DR, Lemmon AR, Margres MJ, Aronow K. The venom-gland transcriptome of the eastern diamondback rattlesnake (Crotalus adamanteus) BMC Genomics. 2012;13:312. doi: 10.1186/1471-2164-13-312. [DOI] [PMC free article] [PubMed] [Google Scholar]
- Ronquist F, Teslenko M, van der Mark P, Ayres DL, Darling A, Höhna S, Larget B, Liu L, Suchard MA, Huelsenbeck JP. MrBayes 3.2: efficient Bayesian phylogenetic inference and model choice across a large model space. Syst Biol. 2012;61:539–542. doi: 10.1093/sysbio/sys029. [DOI] [PMC free article] [PubMed] [Google Scholar]
- Rotenberg D, Bamberger ES, Kochva E. Studies on ribonucleic acid synthesis in the venom glands of Vipera palaestinae (Ophidia, Reptilia) Biochem J. 1971;121:609–612. doi: 10.1042/bj1210609. [DOI] [PMC free article] [PubMed] [Google Scholar]
- Schwartz TS, Tae H, Yang Y, Mockaitis K, Van Hemert JL, Proulx SR, Choi J-H, Bronikowski AM. A garter snake transcriptome: pyrosequencing, de novo assembly, and sex-specific differences. BMC Genomics. 2010;11:694. doi: 10.1186/1471-2164-11-694. [DOI] [PMC free article] [PubMed] [Google Scholar]
- Secor SM, Diamond J. A vertebrate model of extreme physiological regulation. Nature. 1998;395:659–662. doi: 10.1038/27131. [DOI] [PubMed] [Google Scholar]
- Tamura K, Stecher G, Peterson D, Filipski A, Kumar S. MEGA6: molecular evolutionary genetics analysis. Version 6.0. Mol Biol Evol. 2013;30:2725–2729. doi: 10.1093/molbev/mst197. [DOI] [PMC free article] [PubMed] [Google Scholar]
- Valente RH, Guimarães PR, Junqueira M, Neves-Ferreira AGC, Soares MR, Chapeaurouge A, Trugilho MRO, León IR, Rocha SLG, Oliveira-Carvalho AL, et al. Bothrops insularis venomics: a proteomic analysis supported by transcriptomic-generated sequence data. J Proteomics. 2009;72:241–255. doi: 10.1016/j.jprot.2009.01.001. [DOI] [PubMed] [Google Scholar]
- von Reumont BM, Blanke A, Richter S, Alvarez F, Bleidorn C, Jenner RA. The first venomous crustacean revealed by transcriptomics and functional morphology: remipede venom glands express a unique toxin cocktail dominated by enzymes and a neurotoxin. Mol Biol Evol. 2014;31:48–58. doi: 10.1093/molbev/mst199. [DOI] [PMC free article] [PubMed] [Google Scholar]
- Vonk FJ, Casewell NR, Henkel CV, Heimberg AM, Jansen HJ, McCleary RJR, Kerkkamp HME, Vos RA, Guerreiro I, Calvete JJ, et al. The king cobra genome reveals dynamic gene evolution and adaptation in the snake venom system. Proc Natl Acad Sci U S A. 2013;110:20651–20656. doi: 10.1073/pnas.1314702110. [DOI] [PMC free article] [PubMed] [Google Scholar]
- Whittington CM, Belov K. Platypus venom genes expressed in non-venom tissues. Aust J Zool. 2009;57:199. [Google Scholar]
- Willems E, Leyns L, Vandesompele J. Standardization of real-time PCR gene expression data from independent biological replicates. Anal Biochem. 2008;379:127–129. doi: 10.1016/j.ab.2008.04.036. [DOI] [PubMed] [Google Scholar]
- Yamanouye N, Britto LR, Carneiro SM, Markus RP. Control of venom production and secretion by sympathetic outflow in the snake Bothrops jararaca. J Exp Biol. 1997;200:2547–2556. doi: 10.1242/jeb.200.19.2547. [DOI] [PubMed] [Google Scholar]
- Yamanouye N, Carneiro SM, Scrivano CN, Markus RP. Characterization of beta-adrenoceptors responsible for venom production in the venom gland of the snake Bothrops jararaca. Life Sci. 2000;67:217–226. doi: 10.1016/s0024-3205(00)00626-3. [DOI] [PubMed] [Google Scholar]
- Zelanis A, Andrade-Silva D, Rocha MM, Furtado MF, Serrano SMT, Junqueira-de-Azevedo ILM, Ho PL. A transcriptomic view of the proteome variability of newborn and adult Bothrops jararaca snake venoms. PLoS Negl Trop Dis. 2012;6:e1554. doi: 10.1371/journal.pntd.0001554. [DOI] [PMC free article] [PubMed] [Google Scholar]
Associated Data
This section collects any data citations, data availability statements, or supplementary materials included in this article.