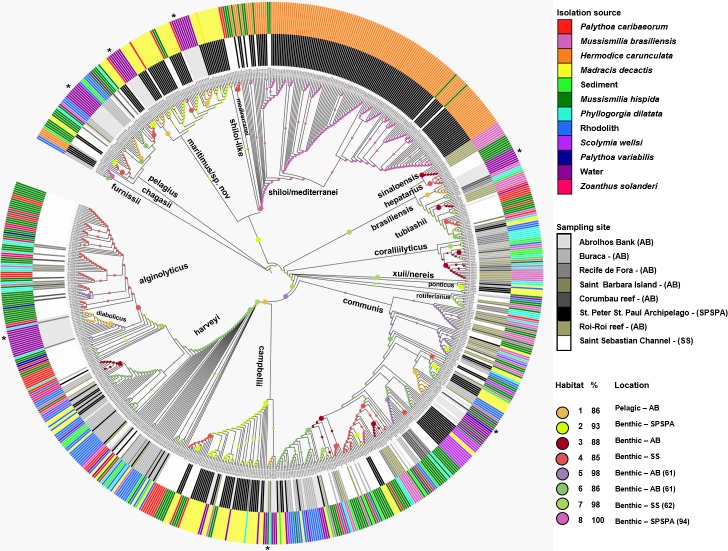
Figure 2. Inferred habitat associations for all ancestors of sequenced Vibrio strains.
The rings surrounding the tree represent the isolation source (outer) and the sampling site (inner) from which strains were isolated. The maximum likelihood assignment of nodes to habitats is shown for all nodes, regardless of the confidence of each prediction. Colored circles on each branch indicate the habitat spectrum assignment (H1-H8) for the node immediately below that branch (see above legend for color scheme). Branch lengths are adjusted to aid visualization and do not represent evolutionary distances. * Highlights the isolation source, water.

