Abstract
It has previously been reported that visual crowding of a target by flankers is stronger in the upper visual field than in the lower, and this finding has been attributed to greater attentional resolution in the lower hemifield (He, Cavanagh, & Intriligator, 1996). Here we show that the upper/lower asymmetry in visual crowding can be explained by natural variations in the borders of each individual's visual field. Specifically, asymmetry in crowding along the vertical meridian can be almost entirely accounted for by replacing the conventional definition of visual field location, in units of degrees of visual angle, with a definition based on the ratio of the extents of an individual's upper and lower visual field. We also show that the upper/lower crowding asymmetry is eliminated when stimulus eccentricity is expressed in units of percentage of visual field extent but is present when the conventional measure of visual angle is used. We further demonstrate that the relationship between visual field extent and perceptual asymmetry is most evident when participants are able to focus their attention on the target location. These results reveal important influences of visual field boundaries on visual perception, even for visual field locations far from those boundaries.
Keywords: visual space, space perception, coordinate system, visual field extent, crowding, attention
Introduction
It is well established that the perception of objects is degraded with increasing distance from the fovea (Low, 1951). However, perceptual performance also varies across different visual field locations for eccentricities that have been equalized in terms of visual angle from fixation (Carrasco, Giordano, & McElree, 2004; Carrasco, Talgar, & Cameron, 2001; Finger & Spelt, 1947). Horizontal visual field asymmetries often reflect functional hemispheric differences (e.g., Ivry & Robertson, 1997; Piazza & Silver, 2014), but there are also reliable behavioral differences between the upper and lower visual fields (Abrams, Nizam, & Carrasco, 2012; He, Cavanagh, & Intriligator, 1996, 1997; Intriligator & Cavanagh, 2001; Karim & Kojima, 2010; Previc, 1990; Previc & Intraub, 1997). Specifically, lower visual field advantages have been reported for a variety of tasks, including target detection and discrimination (Abrams et al., 2012; Carrasco et al., 2004; Carrasco et al., 2001), visual acuity and contrast sensitivity (Fuller, Rodriguez, & Carrasco, 2008; Skrandies, 1987), and perception of illusory contours (Rubin, Nakayama, & Shapley, 1996).
Of particular importance for the present study are influential papers by He et al. (1996, 1997) which showed that participants are better able to report the orientation of a grating flanked by other gratings of the same size and spatial frequency when the gratings are presented in the lower visual field compared to an equal visual angle in the upper visual field. That is, there were more deleterious effects of crowding in the upper visual field. Similar lower visual field advantages were found for tasks that required focused sustained attention, including conjunction search and multiple-object tracking (He et al., 1996), as well as an attentional “walk” task requiring object individuation (Intriligator & Cavanagh, 2001). These investigators concluded that the spatial resolution of visual attention is greater in the lower visual field, where it might be particularly useful for object recognition in natural scenes (He et al., 1996, 1997), and that this asymmetry may be related to the pattern of projections from early visual cortical retinotopic areas to parietal cortex, with a greater number of projections associated with lower compared to upper visual field representations (He et al., 1997).
While the results of He et al. (1996) demonstrate group-level visual field anisotropies in crowding performance, other studies have shown large individual differences in crowding across multiple radial angles, including the upper and lower vertical meridian (Petrov & Meleshkevich, 2011). The present study sought to address whether the upper/lower crowding asymmetry and individual differences in this asymmetry can be explained by a simple parameter that has not been traditionally considered in studies of visual processing: the shape of the visual field.
The standard method for defining retinotopic visual field locations employs a polar coordinate system, with the center of gaze (i.e., the fixation point) at the origin (Figure 1a). In this system, each location is composed of a polar angle value and a radial distance from fixation (i.e., eccentricity), defined in degrees of visual angle. For practical purposes, the use of polar coordinates has the advantage of allowing standardized presentation of visual stimuli across individuals. However, the conventional polar coordinate system fails to incorporate systematic group-level variations in visual field extent along different radial directions, as well as individual differences in visual field extent for a given direction.
Figure 1.

Two coordinate systems for representing visual field locations. (a) Traditional polar coordinate system, with distance from fixation in degrees of visual angle. (b) Schematic demonstrating bielliptical shape of the typical human field of view. Numbers indicate typical visual field extent along the vertical meridian, in degrees of visual angle. (c) Alternative representation of the visual field, with contours representing equal distances from fixation in terms of percentage of visual field extent.
In humans, the visual field is naturally asymmetric, with approximate average borders of 90°–100° of visual angle to the left and right of fixation, 70° for the lower visual field, and 50° for the upper visual field (Niederhauser & Mojon, 2002; Figure 1b). Thus, the shape of the visual field is best described by a bielliptical contour, not a circle. Moreover, upper and lower visual field boundaries (as measured in degrees of visual angle) vary significantly across individuals due to differences in the prominence of the brow and cheeks, relative to the eyes. This asymmetrical shape of the visual field means that a target presented at 25° eccentricity would be approximately halfway between fixation and the edge of the visual field along the upper vertical meridian but only one-third of the way along the lower vertical meridian. Given these asymmetries in visual field boundaries, one can represent stimulus locations according to percentage of visual field extent (%VFE), in which the distance from fixation is defined with respect to the visual field boundary along a given radial direction.
We have previously shown that visual field boundaries influence peripheral localization performance across the visual field (Fortenbaugh, Sanghvi, Silver, & Robertson, 2012). In the present study, we tested whether intrinsic variations in visual field extent also predict visual form perception at locations far from visual field boundaries. Specifically, we measured visual field boundaries along the vertical meridian for each observer (Figure 1c) and examined whether natural variations in %VFE predict individual differences in upper/lower hemifield crowding asymmetries. We tested crowding performance in two conditions: one in which the upper and lower stimulus locations were equated in standard terms of degrees of visual angle from fixation, and one in which locations were equated in terms of %VFE.
General methods
The Committee for the Protection of Human Subjects at the University of California, Berkeley, approved all experimental procedures, and participants provided signed informed consent before the study began. All participants reported 20/20 visual acuity, either without optical correction or with optical correction by contact lenses. Participants were excluded if they wore eyeglasses, as these can artificially restrict the visual field (Steel, Mackie, & Walsh, 1996). Eye disease of any kind was also an exclusion criterion. To further ensure that deficits in visual acuity or contrast sensitivity did not significantly impair performance on the crowding task, data from participants with less than 75% accuracy in the single-grating condition were excluded from analysis (one participant each in Experiments 1 and 4, or 2.8% of all participants). Correlations between visual field extent ratios and performance ratios were quantified with Pearson's R, as Kolmogorov–Smirnov tests indicated that these ratios were normally distributed in each experiment.
Experiment 1
Methods
Participants
Eighteen naïve undergraduate volunteers and one author (FCF) completed the experiment (17 females; mean age: 21.3 ± 4.5 years).
Materials and procedure
Assessment of visual field extent:
Prior to behavioral testing in the crowding task, a Haag-Streit Goldmann kinematic projection perimeter was used to measure the binocular upper and lower visual field extents for each participant. We used the standard III4e test target (0.44° test spot at a viewing distance of 30 cm; target luminance of 318 cd/m2 on a background luminance of 10 cd/m2). While participants maintained fixation at the center of the half-dome perimeter, the experimenter projected the target light in the far periphery and then slowly moved it towards the fovea along the vertical meridian. The participant pressed a button that elicited a tone as soon as he or she detected the light in the periphery. Upon hearing the tone, the experimenter recorded the location of the target light (in degrees of visual angle from fixation).
Throughout testing, participants maintained fixation at the center of the perimeter. A small telescope allowed the experimenter, seated on the other side of the dome, to view the participant's right eye to ensure that fixation was maintained. If fixation was not maintained, that trial was discarded. Each subject performed one practice trial for the upper and for the lower vertical median. Two or three measurements were collected in random order for each vertical meridian and were rounded to the nearest half-degree. Visual field extents for each subject were defined as the average across trials for each vertical meridian.
Crowding test:
Stimuli were presented on a ViewSonic G225f CRT monitor (100-Hz refresh rate) using Presentation software (Neurobehavioral Systems, www.neurobs.com). Subjects viewed the monitor at a distance of 25.4 cm, and a chin-and-forehead rest stabilized head position. Throughout testing, eye position was continuously monitored by the experimenter using a commercial infrared camera (LTCMW304C5 from LTS, Houston, TX). If an eye movement was made, a tone sounded and that trial was discarded and repeated at a random time later in the block.
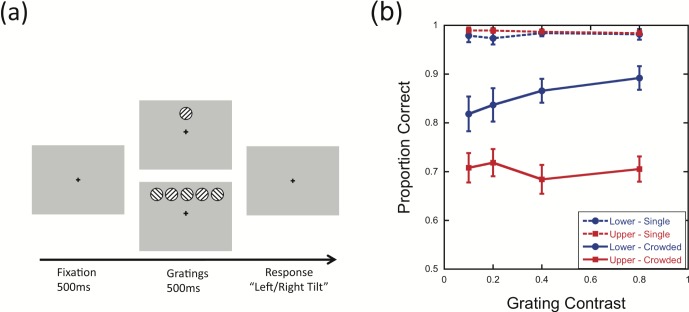
The task was a modified version of the paradigm of He et al. (1996). Target gratings of varying contrast, oriented at 45° or 135°, were presented above or below the fixation cross for 500 ms (Figure 2a). While maintaining fixation on a red cross, participants verbally reported whether the target grating (always located along the vertical meridian) was tilted to the left or right. Target gratings were either presented alone (single condition) or horizontally flanked by gratings on both the left and right (crowded condition). Flanker and target gratings always had the same contrast, and the orientations of the four flanker gratings were randomly assigned on each trial. Following He et al. (1996), sine-wave gratings were 1c/° and 4° in diameter, with a 5° center-to-center distance between gratings in the crowded condition.
Figure 2.
Lower visual field advantage for crowded stimuli at 20° eccentricity. (a) Schematic of trial sequence. After a fixation period, the target grating was presented either alone or with flanker gratings. (b) Mean accuracy as a function of contrast for targets presented 20° above or below fixation. Error bars represent the standard error of the mean. The results from the crowded condition replicate the lower visual field advantage reported by He et al. (1996).
Gratings were presented at four target locations (20° upper visual field, 20° lower visual field, matched upper %VFE, and matched lower %VFE), with each location tested in separate blocks. In the matched lower %VFE block, the location corresponding to 20° upper visual field was converted to %VFE, and stimuli were presented at the same %VFE in the lower visual field. In the matched upper %VFE block, the location at 20° in the lower visual field was converted to %VFE, and stimuli were presented at this %VFE value in the upper visual field. For example, given 50° upper VFE and 75° lower VFE, gratings presented at 20° are at 40% VFE in the upper visual field but only 26.67% VFE in the lower visual field. Targets would then be presented at 13.33° (26.67% of 50°) in the matched upper %VFE condition and at 30° (40% of 75°) in the matched lower %VFE condition.
For gratings at 20° eccentricity, the 1°-diameter fixation cross was placed at the center of the screen and the gratings were placed 20° above or below fixation. For the matched conditions, the fixation cross was moved either closer to or farther away from the gratings to decrease or increase grating eccentricity. The monitor was located on a platform with a pulley system that allowed the experimenter to adjust the height of the monitor so that the participant could fixate the cross with his or her head flat against the forehead rest and eyes directed straight ahead, in primary position. Thus, the position of the monitor, not the position of the participants' eyes and head, was adjusted across blocks.
Participants first completed 10 practice trials with the gratings located 10° above fixation, to familiarize them with the task. During practice, auditory feedback was given for incorrect responses, and these trials were also repeated. During the experiment, no feedback was provided. Block order was randomized across participants. Within each block, there were 10 repeats of each of the 16 conditions: 2 flanker conditions (single, crowded) × 2 grating orientations (45°, 135°) × 4 grating contrast levels (0.1, 0.2, 0.4, 0.8).
Results
Performance in the single-grating conditions was near ceiling, indicating that participants were easily able to discriminate the orientation of the target grating when flankers were not present (mean proportion correct = 0.98, range = 0.81–1.00). The following analyses focus on performance in the crowded conditions. Differences in performance for the crowded conditions between the upper and lower visual fields at 20° were assessed with a 2 (visual field) × 4 (grating contrast) repeated-measures ANOVA. Replicating the vertical asymmetry reported by He et al. (1996), performance was significantly better in the lower visual field than the upper at 20° eccentricity (Figure 2b), F(1, 18) = 26.99, p < 0.001. There was no main effect of grating contrast, F(3, 54) = 1.06, p = 0.37, but there was a significant interaction between the two factors, F(3, 54) = 3.04, p = 0.04, with accuracy decreasing at lower contrast levels in the lower visual field location.
To test the hypothesis that individual differences in visual field extent correlate with performance asymmetries, we computed an upper/lower performance ratio for each participant by dividing the proportion correct in the 20° upper visual field location by the proportion correct in the 20° lower visual field location for each grating contrast in the crowded condition. An analogous ratio was computed for visual field extent by dividing the upper visual field extent (in degrees of visual angle) by the lower visual field extent. Across participants, the upper/lower visual field extent ratio strongly predicted the upper/lower performance ratio (Figure 3), R = 0.68, p = 0.001.
Figure 3.
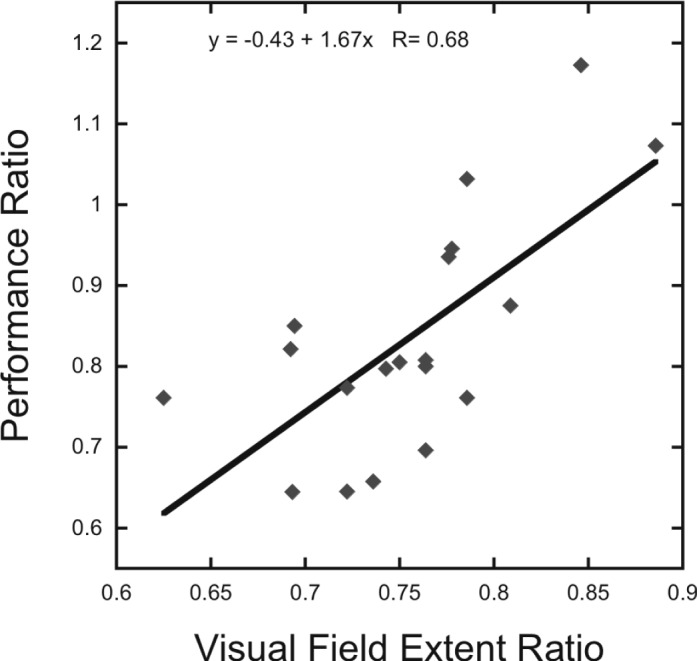
Upper/lower asymmetry in visual field extent predicts magnitude of upper/lower perceptual asymmetry across individual participants. The magnitude of the upper/lower performance ratio for the crowded conditions at 20° (averaged across contrast levels) is highly correlated with the upper/lower visual field extent ratio. Each data point represents one participant. Solid black line indicates linear regression.
As performance varied as a function of stimulus contrast, correlations between visual field extent ratio and performance ratio were also calculated for each contrast level. Significant positive correlations were found at all contrast levels (10% contrast: R = 0.61, p = 0.005; 20% contrast: R = 0.62, p = 0.004; 40% contrast: R = 0.50, p = 0.03; 80% contrast: R = 0.56, p = 0.01).
We next tested the hypothesis that performance would be similar for stimulus locations with identical %VFE values but different eccentricities in degrees of visual angle. Performance at each 20° location was compared with performance at a location matched for %VFE in the opposite hemifield for the crowded condition. Statistical testing was conducted using 2 (visual field) × 4 (grating contrast) repeated-measures ANOVAs.
When locations in the upper and lower visual field had the same %VFE, performance was nearly identical (Figure 4). Specifically, performance was very similar for the 20° lower visual field and upper %VFE-matched locations (85.3% vs. 85.3%), F < 1, p = 0.99, and for the 20° upper visual field and lower %VFE-matched locations (70.4% vs. 69.7%), F < 1, p = 0.78. To test the generality of these results across stimulus contrasts, pairwise comparisons were calculated at each grating contrast level for both pairings of visual field locations. There was no significant difference in performance at any contrast level, all ps > 0.14 (uncorrected).
Figure 4.
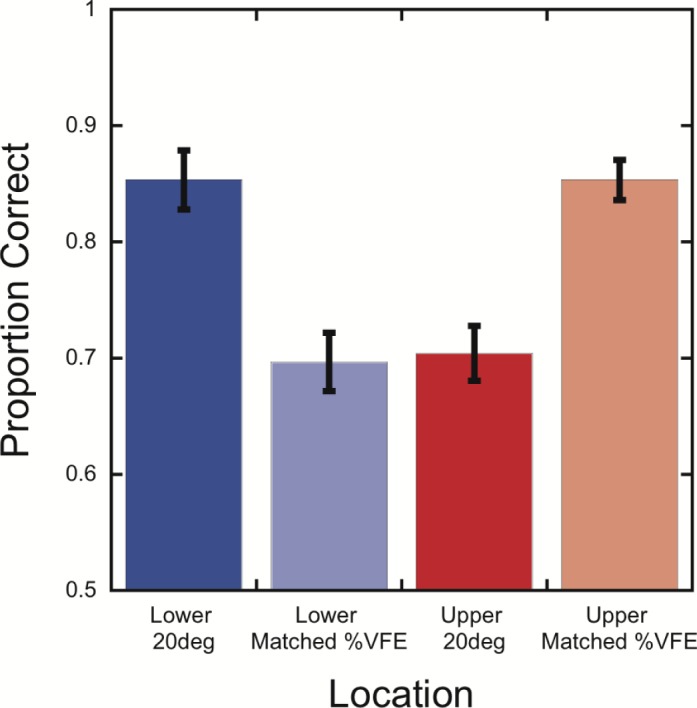
Performance on the crowding task is very similar for upper and lower visual field locations that have the same percentage of visual field extent. Mean accuracy, averaged over grating contrasts, is shown as a function of stimulus location. Error bars represent the standard error of the mean.
Discussion
The results of Experiment 1 show that incorporating visual field extent asymmetries into the coordinate system used to define stimulus location accounts for both between-subject and within-subject variability in the upper/lower performance asymmetry. Across participants, the ratio of an individual's upper and lower visual field extents strongly predicted the magnitude of the lower visual field advantage in the crowded condition. Moreover, when targets in one hemifield were matched with the 20° location in the opposite hemifield based on %VFE, in each participant the performance asymmetry was eliminated.
Another interesting finding from the present experiment is that the two participants with the most symmetric vertical visual field extents both exhibited better performance for the upper than the lower visual field (Figure 3). This finding is not easily predicted by ecological theories that propose specialization of the lower visual field for viewing of the ground plane (Previc, 1990). In contrast, consideration of individual differences in visual field extent provides a novel, and accessible, way of predicting when such reversals in performance asymmetries are present in individual subjects.
In Experiment 1, targets appeared at the same location throughout a block of trials, and it is therefore unclear from these data whether the relationship between visual field extent and performance asymmetry primarily reflects differences in basic visual or attentional processing. As noted in the Introduction, the original report of a lower visual field advantage in crowding (He et al., 1996) was supported by findings of similar performance asymmetries for a feature/conjunction and a multiple-object tracking task, leading the authors to suggest that the lower visual field advantage was due to differences in the spatial resolution of sustained attention in the two hemifields (He et al., 1996). Other researchers have also demonstrated upper/lower visual field asymmetries in sustained attention (Altpeter, Mackeben, & Trauzettel-Klosinski, 2000; Mackeben, 1999) and greater attentional weighting for lower visual field locations (Rezec & Dobkins, 2004).
While the mechanisms of crowding remain unknown, crowding clearly does not arise from the same processing limitations that account for visual acuity thresholds such as retinal ganglion cell densities (Levi, 2008; Whitney & Levi, 2011). Currently, two primary theories regarding the mechanisms of crowding are integrative fields (Levi, 2008; Levi, Klein, & Aitsebaomo, 1985; Pelli, 2008) and limited spatial resolution of attention (Chakravarthi & Cavanagh, 2009; He et al., 1996, 1997). Moreover, recent studies have shown that changes in the focus of attention can alter the critical spacing and magnitude of crowding (Mareschal, Morgan, & Solomon, 2010; Petrov & Meleshkevich, 2011; Whitney & Levi, 2011; Yeshurun & Rashal, 2010). In Experiment 1, target location remained constant throughout a block of trials, allowing subjects to direct attention to the location of the target grating before the stimulus appeared. We therefore conducted additional experiments to investigate the effects of spatial attention on the relationship between visual field and performance asymmetries observed in Experiment 1.
Experiment 2
Methods
Participants
Sixteen naïve undergraduate volunteers and one author (FCF) completed the experiment (10 females; mean age: 22.1 ± 4.6 years).
Materials and procedure
As in Experiment 1, prior to behavioral testing, a Haag-Streit Goldmann kinematic projection perimeter was used to measure the binocular upper and lower visual field extents for each participant. The subsequent crowding task was the same as in Experiment 1, except there were only three blocks. In two of the blocks, the target grating was presented at 20° either above or below fixation, and the location remained constant throughout the block (Attend 1 Location condition). Within each of the Attend 1 Location blocks, there were 10 repeats of each of the 16 conditions: 2 flanker conditions (single, crowded) × 2 grating orientations (45°, 135°) × 4 grating contrast levels (0.1, 0.2, 0.4, 0.8). In the third block, the target was randomly presented at either 20° above or below fixation on each trial (Attend 2 Locations condition). In this block, there were 10 repeats of each of the 32 conditions: 2 target locations (20° above/below fixation) × 2 flanker conditions (single, crowded) × 2 grating orientations (45°, 135°) × 4 grating contrast levels (0.1, 0.2, 0.4, 0.8). A break was provided to participants halfway through the Attend 2 Locations block. Block order was alternated across participants.
Results
As in Experiment 1, performance in the single-grating conditions was near ceiling, indicating that participants easily discriminated the orientation of the target grating when flankers were not present (mean proportion correct = 0.98, range = 0.87–1.00). The following analyses focus on performance in the crowded conditions. To determine whether performance varied when targets appeared in one versus two possible locations within a block of trials, a 2 (number of target locations: Attend 1, Attend 2) × 2 (visual field location: 20° above/below fixation) × 4 (grating contrast) repeated-measures ANOVA was performed. There was no significant main effect of grating contrast, F(3, 48) = 1, p = 0.40, or interaction of grating contrast with any other factor, all ps > 0.40.
Replicating the results of Experiment 1 and He et al. (1996), performance was better in the lower than the upper 20° location, F(1, 16) = 37.32, p < 0.001. Overall, there was no significant difference between Attend 1 Location and Attend 2 Locations, F(1, 16) = 1.63, p = 0.22, nor was the Visual Field Location × Number of Target Locations interaction significant (Figure 5), F(1, 16) = 0.79, p = 0.39. Paired t tests for each combination of grating contrast and visual field location indicated no significant differences between Attend 1 Location and Attend 2 Locations for any combination, all ps > 0.30 (uncorrected).
Figure 5.
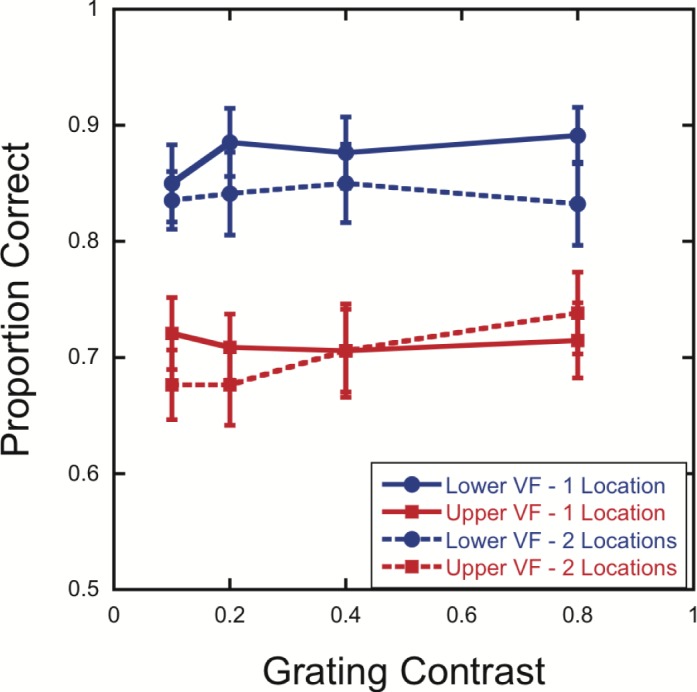
Lower visual field advantage in crowding for both Attend 1 Location and Attend 2 Locations conditions. Mean accuracy is shown as a function of contrast for targets presented with flankers at 20° (500-ms duration) above or below fixation when participants monitored either one or two target locations. Error bars represent the standard error of the mean.
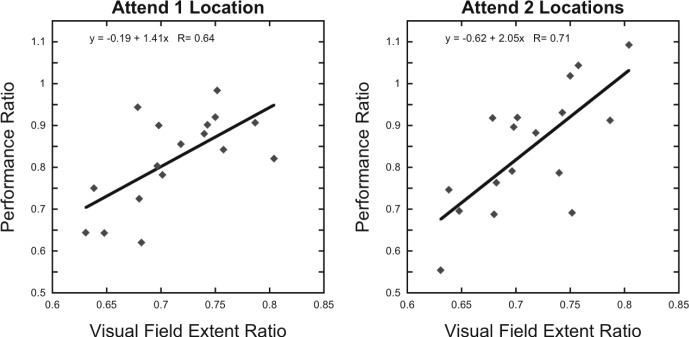
Next, upper/lower visual field extent ratios were calculated for each participant as in Experiment 1, and upper/lower performance ratios were computed for each participant for both Attend 1 Location and Attend 2 Locations conditions. As in Experiment 1, when participants monitored a single target location, the visual field extent ratio predicted the magnitude of the upper/lower performance asymmetry (Attend 1 Location; Figure 6, left panel), R = 0.64, p = 0.006. A similar correlation was observed when participants monitored both the upper and lower target locations within a block of trials (Attend 2 Locations; Figure 6, right panel), R = 0.71, p = 0.001.
Figure 6.
Upper/lower visual field extent asymmetry predicts magnitude of upper/lower perceptual asymmetry for both Attend 1 Location and Attend 2 Locations conditions. The magnitude of the upper/lower performance ratio for the crowded conditions (averaged across contrast levels) is highly correlated with the asymmetry in upper/lower visual field extent ratio. Left panel: One target location was monitored within each block (Attend 1 Location). Right panel: Both target locations were monitored on every trial in the block (Attend 2 Locations). Each data point represents one participant. Solid black lines indicate linear regressions.
Discussion
In Experiment 2, we found a lower visual field advantage as well as a correlation between upper/lower visual field extent and performance ratios in both the Attend 1 Location (replicating Experiment 1) and Attend 2 Locations conditions. These results show that spatial uncertainty prior to target onset did not alter the strength of the correlation across the two conditions. However, the long (500 ms) target durations utilized in Experiments 1 and 2 prevent any definitive conclusions from being made regarding the influence of attention on the relationship between visual field extent and performance asymmetries. In particular, it is known that rapid stimulus onsets capture involuntary attention (Yantis & Hillstrom, 1994; Yantis & Jonides, 1990), with maximal effects occurring approximately 150 ms after stimulus onset and declining rapidly afterwards (Posner, 1980). In contrast, the onset of sustained attention is slower, but it can be maintained for many seconds (Carrasco, 2011; Silver, Ress, & Heeger, 2007). Therefore, it is plausible that although participants monitored both upper and lower locations prior to grating presentation in the Attend 2 Locations condition, the 500-ms stimulus presentation duration allowed subjects sufficient time to shift their attention to the target location. In the next experiment, we therefore employed a shorter (150 ms) stimulus duration that substantially reduced the likelihood of voluntary shifts of attention to the target.
Experiment 3
In Experiments 1 and 2, the gratings were always presented for 500 ms, providing sufficient time for attention to be shifted and focused on the target grating location following stimulus onset. In Experiment 3, participants completed two blocks of trials, one with a 500-ms and one with a 150-ms grating duration. In both cases, gratings could appear 20° above or below fixation on any given trial, as in the Attend 2 Locations condition in Experiment 2. Because subjects did not know the location of the gratings on a given trial until they were presented, the 150-ms condition made it unlikely that there would be sufficient time for voluntary shifts of attention to the target grating while it was displayed.
Methods
Participants
Eleven naïve undergraduate volunteers and one author (FCF) completed the experiment (eight females; mean age: 21.8 ± 3.8 years).
Materials and procedure
As in Experiments 1 and 2, prior to behavioral testing, a Haag-Streit Goldmann kinematic projection perimeter was used to measure the binocular upper and lower visual field extent for each participant. The behavioral testing was the same as in Experiment 1, except there were only two blocks of trials. In both blocks, the target could appear either 20° above or below fixation (randomly selected) on each trial (i.e., Attend 2 Locations). In one block of trials, the gratings were presented for 500 ms, as in Experiments 1 and 2. In the other block of trials, the gratings were presented for 150 ms. Only the 0.8 grating contrast was tested.
To better control for potential differences in target visibility across flanker configurations, and in contrast to Experiments 1 and 2 (in which flanker orientations were completely random on each trial), all 16 possible combinations of the two grating orientations (45° and 135°) across the four flanker locations were presented in each block of trials. Thus, for each block of trials, there were 128 trials: 2 target locations (20° above/below fixation) × 2 flanker conditions (single, crowded) × 2 target grating orientations (45°, 135°) × 16 flanker configurations (or repeats in the single-grating condition). Block order was alternated across participants.
Results
As in Experiments 1 and 2, performance in the single-grating conditions was near ceiling (mean proportion correct = 0.98, range = 0.81–1.00). The following analyses focus on the performance of participants in the crowded conditions. To assess the effects of grating duration, a 2 (visual field location: 20° above/below fixation) × 2 (150-ms or 500-ms grating duration) repeated-measures ANOVA was performed. As in the previous experiments, performance was significantly better in the lower visual field than the upper visual field (Figure 7), F(1, 11) = 12.65, p = 0.005. Performance was also significantly worse for the 150-ms compared to the 500-ms grating duration (Figure 7), F(1, 11) = 28.94, p < 0.001. However, performance was significantly above chance for all four combinations of visual field location and grating duration (Figure 7), all ps ≤ 0.01 (one-sample t tests). There was a trend towards a Visual Field Location × Grating Duration interaction, F(1, 11) = 3.63, p = 0.08. Specifically, this trend was towards a greater lower visual field advantage for the 500-ms grating duration relative to the 150-ms one (Figure 7). However, paired t tests show a significant lower visual field advantage for both grating durations—150 ms: t(11) = 2.15, p = 0.05; 500 ms: t(11) = 2.81, p = 0.01.
Figure 7.
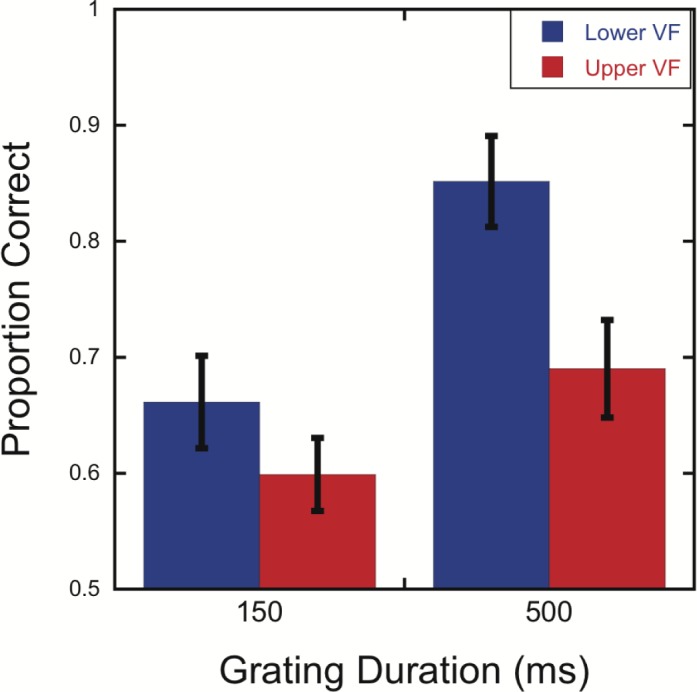
Lower visual field advantage in crowding for both 150-ms and 500-ms grating durations. Mean accuracy is shown as a function of grating duration for targets presented with flankers at 20° above or below fixation. Subjects monitored both target locations in every trial. Error bars represent the standard error of the mean.
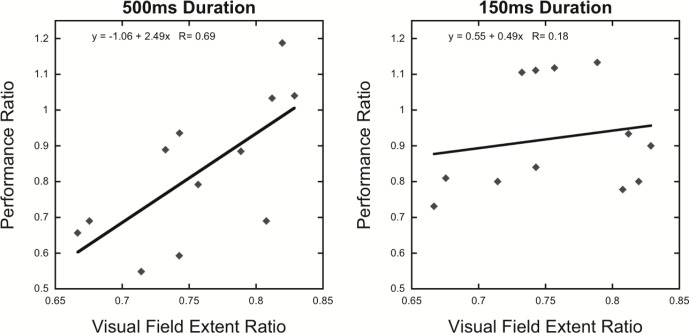
To determine whether individual variations in visual field extent predicted upper/lower performance asymmetries for each of the two grating duration conditions, visual field extent and performance ratios were calculated as in Experiment 1. Replicating the results of Experiment 2, in which the grating duration was 500 ms, the visual field extent ratio predicted the magnitude of the upper/lower performance asymmetry (Figure 8, left panel), R = 0.69, p = 0.013. In contrast, no significant correlation was observed when the gratings were presented for 150 ms (Figure 8, right panel), R = 0.18, p = 0.58.
Figure 8.
Upper/lower visual field extent asymmetry predicts magnitude of upper/lower perceptual asymmetry for 500-ms but not 150-ms grating durations. Left panel: Performance ratio for the 500-ms grating duration. Right panel: Performance ratio for the 150-ms grating duration. Subjects monitored both target locations in every trial. Each data point represents one participant. Solid black lines indicate linear regressions.
Discussion
In this experiment, a lower visual field advantage in crowding was observed for both 150-ms and 500-ms grating conditions. However, the upper/lower asymmetry in visual field extent predicted performance asymmetries for only the 500-ms condition. Performance was above chance in both the upper and lower visual field locations for the 150-ms condition, so the lack of a significant correlation between visual field extent and performance ratios is unlikely to be due to a floor effect. Instead, these results are consistent with the hypothesis that visual field extent for a given radial direction predicts the degree to which sustained attention can be focused at a specific eccentricity.
While no significant correlation between visual field extent asymmetry and performance ratio was observed for the 150-ms grating condition, participants still exhibited a lower visual field advantage in this condition. Lower vertical meridian advantages have been reported for a variety of measures, including visual acuity and contrast sensitivity (Skrandies, 1987) and illusory contour perception (Rubin et al., 1996). Previous studies have also reported upper/lower differences in orientation discrimination and detection, with locations along the upper and lower vertical meridian showing equivalent benefits of exogenous precues (Carrasco et al., 2001). Collectively, these results and those of Experiment 3 suggest that there are upper/lower perceptual asymmetries that cannot be accounted for by either the asymmetrical shape of the visual field or attentional resolution. Asymmetries in retinal cell densities or in the representation of the upper and lower visual fields in early visual cortical areas have been proposed to account for these perceptual asymmetries (Abrams et al., 2012; Carrasco et al., 2004; Carrasco et al., 2001; Karim & Kojima, 2010; Liu, Heeger, & Carrasco, 2006; Previc, 1990; Silva et al., 2010; Skrandies, 1987), and the lower visual field advantage we observed for the 150-ms grating duration may be due to one or both of these factors.
While we employed a brief 150-ms grating duration to decrease the likelihood of shifts of voluntary attention to the target location, it is known that reducing stimulus duration increases critical spacing in similar crowding tasks (Tripathy & Cavanagh, 2002). Moreover, attentional manipulations can alter critical spacing (Mareschal et al., 2010; Yeshurun & Rashal, 2010). If the effects of grating duration are due to sustained attention at the target location in the 500-ms but not the 150-ms condition, then the individual variations in upper/lower asymmetry in visual field extent should predict performance asymmetry for 150-ms gratings if participants maintained focused attention at one target location throughout a block of trials. The final experiment was designed to test this hypothesis.
Experiment 4
Participants completed four blocks of trials using the same locations tested in Experiment 1. Grating duration was always 150 ms, and only one target location was tested within each block of trials, allowing participants to focus and maintain attention at the target location before the onset of the gratings for every trial.
Methods
Participants
Twenty naïve undergraduate volunteers and one author (FCF) completed the experiment (13 females; mean age: 23 ± 4.5 years).
Materials and procedure
As in the previous experiments, prior to behavioral testing, a Haag-Streit Goldmann kinematic projection perimeter was used to measure the upper and lower visual field extents for each participant. The crowding task was the same as in Experiment 1, except that the gratings were only presented for 150 ms and the center-to-center distance between the gratings was increased to 5.25° in order to better equate accuracy levels with those of Experiment 1 (which employed a 500-ms stimulus duration). As in Experiment 3, only the 0.8 grating contrast level was tested, and all 16 configurations of the flanker gratings in the crowded condition were presented in each block. Thus, for each block there were 64 trials: 2 flanker conditions (single, crowded) × 2 target grating orientations (45°, 135°) × 16 flanker configurations (or repeats in the single-grating conditions). Block order was randomized across participants.
Results
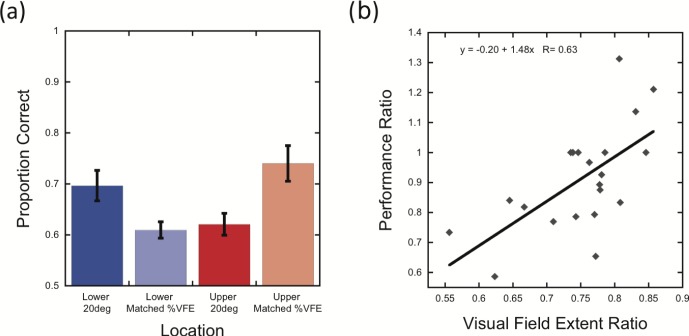
Performance in the single-grating conditions was near ceiling (mean proportion correct = 0.98, range = 0.87–1.00). The following analyses focus on performance in the crowded conditions. Again, a lower visual field advantage was evident for stimuli at 20° (Figure 9a), t(20) = 2.67, p = 0.01. Replicating the results of Experiment 1, there was no significant difference between performance in the upper 20° location and the lower matched %VFE location (Figure 9a), t(20) = −1.85, p = 0.52, or between the lower 20° location and the upper matched %VFE location (Figure 9a), t(20) = −1.85, p = 0.08. Finally, the visual field extent ratio predicted the average magnitude of the upper/lower performance asymmetry (Figure 9b), R = 0.63, p = 0.002.
Figure 9.
Gratings presented for 150 ms can produce a lower visual field advantage in crowding and correlation with visual field extent ratio, if the target location is predictable. (a) Mean accuracy as a function of grating location. Error bars represent the standard error of the mean. (b) Correlation of upper/lower performance ratio for the crowded condition at 20° grating locations with upper/lower visual field extent ratio. Each data point represents one participant. Solid black line indicates linear regression.
Discussion
The results of this experiment demonstrate a significant correlation between individual visual field extent ratios and performance ratios even for gratings presented for 150 ms. This correlation is presumably due to the fact that target location was fixed throughout each block of trials, allowing participants to focus attention on the target location before the gratings appeared. Moreover, as in Experiment 1, when target locations in one hemifield were matched in terms of percentage of visual field extent in the opposite hemifield, the lower visual field advantage was eliminated. These results provide further evidence that the relationship between visual field extent and performance ratios is mediated by focused spatial attention at the target location. Our findings are consistent with those from other studies showing greater benefits of sustained attention in the lower compared to upper visual field (Altpeter et al., 2000; He et al., 1996, 1997; Mackeben, 1999; Rezec & Dobkins, 2004). Importantly, we also show that individual differences in upper/lower performance asymmetries in crowding can be accounted for by individual differences in visual field extent when attention is directed towards the crowded stimuli.
Cross-validation of performance asymmetries across experiments
The results of the previous four experiments show significant correlations between visual field extent ratios and performance ratios when participants were able to focus attention at the target grating's location. Across experiments, this relationship was observed in five experimental conditions with four separate groups of participants at the 20° upper and lower visual field locations (Experiment 1: 19 participants, 500-ms duration, single target location; Experiment 2: 17 participants, 500-ms duration, both single and dual target locations; Experiment 3: 12 participants, 500-ms duration, dual target location; Experiment 4: 21 participants, 150-ms duration, single target location). While significant correlations between visual field extent ratio and performance ratio were observed in each of these individual experiments, we wished to assess if the performance of participants in one condition could be used to effectively predict performance in another condition, as research in the area of statistical machine learning has suggested that regression analyses can overestimate prediction ability for novel samples (Cohen et al., 2011). To further assess the ability of visual field extent ratios to predict performance ratios on the current crowding task, we combined an iterative leave-one-out cross-validation procedure with linear regression. For each iteration, we combined data from four of the five data sets, computed a linear regression for this combined data set, and then determined the degree to which the intercept and slope parameters of the resulting regression function accurately predicted data from the set that was left out. This process was conducted five times, with each data set left out once. Thus, each of the 86 performance ratio values across the five conditions (Figure 10) was predicted exactly once, utilizing only data from the other four sets. A significant correlation was observed between the measured and predicted performance ratios (Figure 10), R = 0.57, p < 0.001, supporting the generality and strength of the relationships between visual field extent ratios and performance ratios that were observed in the previous experiments.
Figure 10.
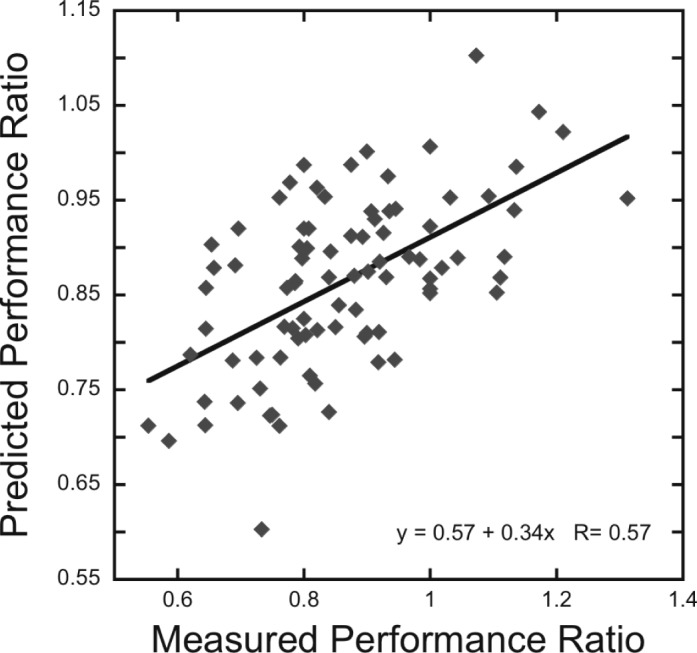
Prediction of performance ratios across the experimental conditions that allowed attention to be directed towards the target. The scatter plot shows the relationship between measured and predicted performance ratios using an iterative leave-one-out linear-regression analysis. Each data point represents one participant across all five conditions. Solid black line indicates linear regression.
General discussion
We have shown that individual differences in vertical visual field extent account for both within- and between-participant variability in performance asymmetries on a crowding task. Furthermore, this relationship between visual field extent and performance asymmetries is mediated by directing endogenous spatial attention to the target location. Our findings demonstrate that visual field boundaries, or more specifically, visual field extents, substantially influence visual processing at locations far from the edges of the visual field. The present results extend our previous findings by demonstrating an important role for visual field boundaries in influencing not only where one perceives objects (Fortenbaugh et al., 2012) but also how those objects are processed.
Studies on the evolution of binocular vision have revealed strong relationships between the shape of the visual field and its representation in the brain. One defining feature of the mammalian visual system, particularly in primates, is the large degree of overlap in the visual fields of the two eyes (Heesy, 2004, 2009) relative to species with more panoramic visual fields. Differences in the size of the binocular visual field across species are associated with differences in retinal cell density in the area of binocular overlap and with the development of binocular neurons in early visual cortical areas (Pettigrew, 1986). Functional specialization of the visual system at the species level, from the level of orbital convergence (alignment of the two eyes' axes) to higher level cortical organization, has also been associated with the evolution of visual processing capabilities that promote survival in different environments, including binocular vision (stereopsis) and enhanced light sensitivity, visual acuity, and contrast discrimination (Heesy, 2009; Pettigrew, 1986).
These relationships between the shape of the binocular visual field and visual system organization across species suggest that coupling between individual variations in visual field extent and known physiological anisotropies may account for variability in the performance asymmetries we have observed. To our knowledge, the relationship between individual visual field extents and the topographic organization of sensory or attention signals in the cerebral cortex has not been studied. However, there are multiple examples within the literature of anisotropies and asymmetries of cortical visual field representations. Specifically, the lateral geniculate nucleus (Schneider, Richter, & Kastner, 2004), cortical area V1 (Van Essen, Newsome, & Maunsell, 1984), and posterior parietal cortical areas that contain topographic maps of spatial attention signals (Silver, Ress, & Heeger, 2005) contain larger representations of the horizontal than the vertical meridian. In the retina, the lower visual field representation has greater cell density than the upper visual field (Curcio & Allen, 1990; Curcio, Sloan, Packer, Hendrickson, & Kalina, 1987), and early visual areas contain larger representations of the lower visual field compared to the upper (Liu et al., 2006; Van Essen et al., 1984). Some of these neurophysiological anisotropies have been incorporated in theories of the mechanism driving perceptual asymmetries, including visual crowding (He et al., 1996, 1997). One fascinating possibility raised by the current results is that visual field extent correlates with cortical representations across subjects, with the visual field measurements in the present study serving as a proxy for individual differences in visual field representations in the brain.
Our findings of correlations between visual field extent ratios and performance asymmetries for locations along the vertical meridian motivate further research to test for such relationships across a broader range of eccentricities and radial angles. To the extent that performance asymmetries are due to the shape of the visual field, we predict that they should be most prominent close to the vertical meridian (where the visual field extent ratio is greatest; Figure 1b) and decrease for locations closer to the horizontal meridian (where the binocular visual field is more symmetrical). More generally, it is possible that representing visual field locations in a coordinate system based on %VFE will provide more insight into certain perceptual asymmetries than the conventional system based on degrees of visual angle.
It is important to note that the relationship between visual field shape and lower field advantage in crowding that we report here was only evident when subjects could focus spatial attention at the visual field location of the stimuli. It will be of great interest to test whether this relationship will generalize across a broader range of stimuli and task settings, as predicted if our results reflect individual variations in the spatial resolution of sustained attention across the visual field.
There are numerous visual field asymmetries, including the upper/lower performance asymmetry observed in Experiment 3 with a 150-ms presentation, that cannot be accounted for by considerations of visual field extent, and the degree of crowding itself is modulated by many stimulus, task, and cognitive factors (Whitney & Levi, 2011). It is therefore important for future research to determine the degree to which variations in visual field extent can predict performance asymmetries across a broader range of experimental settings. Finally, we note that our findings do not exclude influences of ecological factors or retinal and cortical specialization on perceptual visual field asymmetries.
In conclusion, we have discovered that the shape of the visual field profoundly influences spatial interactions in visual processing and that the relationship between visual field shape and perceptual asymmetries is mediated by spatial attention. In the future, measuring the visual field extents of participants and defining visual field locations in units of %VFE may advance our understanding of perceptual asymmetries and individual variability in the magnitude of these asymmetries.
Acknowledgments
The authors thank Tytus Massei and Shanelle Nebre for help with data collection. This research was partially supported by the Department of Veterans Affairs, as well as by National Institutes of Health Grant R01-EY016975 (LCR), the Chancellor's Faculty Partnership Fund from the University of California, Berkeley (MAS and LCR), and NEI Core grant EY003176 (LCR and MAS). LCR has a Senior Research Career Scientist award from the Department of Veterans Affairs in the VA Clinical Sciences Research Service, Department of Veterans Affairs Medical Center, Martinez, CA. The contents within do not represent the views of the Department of Veterans Affairs of the United States government.
Commercial relationships: none.
Corresponding author: Lynn Robertson.
Email: lynnrob@berkeley.edu.
Address: Department of Psychology, University of California, Berkeley, CA, USA.
Contributor Information
Francesca C. Fortenbaugh, Email: francescafortenbaugh@gmail.com.
Michael A. Silver, Email: masilver@berkeley.edu.
Lynn C. Robertson, Email: lynnrob@berkeley.edu.
References
- Abrams J., Nizam A., Carrasco M. (2012). Isoeccentric locations are not equivalent: The extent of the vertical meridian asymmetry. Vision Research , 52 (1), 70–78. [DOI] [PMC free article] [PubMed] [Google Scholar]
- Altpeter E., Mackeben M., Trauzettel-Klosinski S. (2000). The importance of sustained attention for patients with maculopathies. Vision Research , 40 (10–12), 1539–1547. [DOI] [PubMed] [Google Scholar]
- Carrasco M. (2011). Visual attention: The past 25 years. Vision Research , 51 (13), 1484–1525. [DOI] [PMC free article] [PubMed] [Google Scholar]
- Carrasco M., Giordano A. M., McElree B. (2004). Temporal performance fields: Visual and attentional factors. Vision Research , 44 (12), 1351–1365. [DOI] [PubMed] [Google Scholar]
- Carrasco M., Talgar C., Cameron E. L. (2001). Characterizing visual performance fields: Effects of transient covert attention, spatial frequency, eccentricity, task and set size. Spatial Vision , 15 (1), 61–75. [DOI] [PMC free article] [PubMed] [Google Scholar]
- Chakravarthi R., Cavanagh P. (2009). Bilateral field advantage in visual crowding. Vision Research , 49 (13), 1638–1646. [DOI] [PMC free article] [PubMed] [Google Scholar]
- Cohen J. R., Asarnow R. F., Sabb F. W., Bilder R. M., Bookheimer S. Y., Knowlton B. J., Poldrack R. A. (2011). Decoding continuous variables from neuroimaging data: basic and clinical applications. Frontiers in Neuroscience , 5, 1–12. [DOI] [PMC free article] [PubMed] [Google Scholar]
- Curcio C. A., Allen K. A. (1990). Topography of ganglion cells in human retina. Journal of Comparative Neurology , 300 (1), 5–25. [DOI] [PubMed] [Google Scholar]
- Curcio C. A., Sloan K., Packer O., Hendrickson A., Kalina R. (1987, May 1, 1987). Distribution of cones in human and monkey retina: Individual variability and radial asymmetry. Science , 236 (4801), 579–582. [DOI] [PubMed] [Google Scholar]
- Finger F. W., Spelt D. K. (1947). The illustration of the horizontal-vertical illusion. Journal of Experimental Psychology , 37 (3), 243–250. [DOI] [PubMed] [Google Scholar]
- Fortenbaugh F. C., Sanghvi S., Silver M. A., Robertson L. C. (2012). Exploring the edges of visual space: The influence of visual boundaries on peripheral localization. Journal of Vision , 12 (2): 19 1–18, http://www.journalofvision.org/content/12/2/19, doi:10.1167/12.2.19. [PubMed] [Article]. [DOI] [PMC free article] [PubMed] [Google Scholar]
- Fuller S., Rodriguez R. Z., Carrasco M. (2008). Apparent contrast differs across the vertical meridian: Visual and attentional factors. Journal of Vision , 8 (1): 19 1–16, http://www.journalofvision.org/content/8/1/16, doi:10.1167/8.1.16. [PubMed] [Article]. [DOI] [PMC free article] [PubMed] [Google Scholar]
- He S., Cavanagh P., Intriligator J. (1996). Attentional resolution and the locus of visual awareness. Nature , 383 (6598), 334–337. [DOI] [PubMed] [Google Scholar]
- He S., Cavanagh P., Intriligator J. (1997). Attentional resolution. Trends in Cognitive Science , 1 (3), 115–121. [DOI] [PubMed] [Google Scholar]
- Heesy C. (2004). On the relationship between orbit orientation and binocular visual field overlap in mammals. Anatomical Record Part A , 281A (1), 1104–1110. [DOI] [PubMed] [Google Scholar]
- Heesy C. (2009). Seeing in stereo: The ecology and evolution of primate binocular vision and stereopsis. Evolutionary Anthropology , 18 (1), 21–35. [Google Scholar]
- Intriligator J., Cavanagh P. (2001). The spatial resolution of attention. Cognitive Psychology , 43, 171–216. [DOI] [PubMed] [Google Scholar]
- Ivry R. B., Robertson L. C. (1997). The two sides of perception. Cambridge, MA: MIT Press. [Google Scholar]
- Karim A. K. M. R., Kojima H. (2010). The what and why of perceptual asymmetries in the visual domain. Advances in Cognitive Psychology , 6, 103–115. [DOI] [PMC free article] [PubMed] [Google Scholar]
- Levi D. M. (2008). Crowding—An essential bottleneck for object recognition: A mini-review. Vision Research , 48 (5), 635–654. [DOI] [PMC free article] [PubMed] [Google Scholar]
- Levi D. M., Klein S. A., Aitsebaomo A. P. (1985). Vernier acuity, crowding and cortical magnification. Vision Research , 25 (7), 963–977. [DOI] [PubMed] [Google Scholar]
- Liu T., Heeger D. J., Carrasco M. (2006). Neural correlates of the visual vertical meridian asymmetry. Journal of Vision , 6 (11): 19 1294–1306, http://www.journalofvision.org/content/6/11/12, doi:10.1167/6.11.12. [PubMed] [Article]. [DOI] [PMC free article] [PubMed] [Google Scholar]
- Low F. N. (1951). Peripheral visual acuity. Archives of Ophthalmology , 45 (1), 80–99. [DOI] [PubMed] [Google Scholar]
- Mackeben M. (1999). Sustained focal attention and peripheral letter recognition. Spatial Vision , 12 (1), 51–72. [DOI] [PubMed] [Google Scholar]
- Mareschal I., Morgan M. J., Solomon J. A. (2010). Attentional modulation of crowding. Vision Research , 50 (8), 805–809. [DOI] [PubMed] [Google Scholar]
- Niederhauser S., Mojon D. S. (2002). Normal isopter position in the peripheral visual field in Goldmann kinetic perimetry. Ophthalmologica , 216 (6), 406–408. [DOI] [PubMed] [Google Scholar]
- Pelli D. G. (2008). Crowding: A cortical constraint on object recognition. Current Opinion in Neurobiology , 18 (4), 445–451. [DOI] [PMC free article] [PubMed] [Google Scholar]
- Petrov Y., Meleshkevich O. (2011). Asymmetries and idiosyncratic hot spots in crowding. Vision Research , 51 (10), 1117–1123. [DOI] [PubMed] [Google Scholar]
- Pettigrew J. D. (1986). The evolution of binocular vision. In Pettigrew J. D., Sanderson K. J., Levick W. R. (Eds.), Visual neurosciences (pp 208–222) Cambridge, UK: Cambridge University Press. [Google Scholar]
- Piazza E. A., Silver M. A. (2014). Persistent hemispheric differences in the perceptual selection of spatial frequencies. Journal of Cognitive Neuroscience , 26 (9), 2021–2027. [DOI] [PMC free article] [PubMed] [Google Scholar]
- Posner M. I. (1980). Orienting of attention. Quarterly Journal of Experimental Psychology , 32 (1), 3–25. [DOI] [PubMed] [Google Scholar]
- Previc F. H. (1990). Functional specialization in the lower and upper visual fields in humans: Its ecological origins and neurophysiological implications. Behavioral and Brain Sciences , 13 (3), 519–575. [Google Scholar]
- Previc F. H., Intraub H. (1997). Vertical biases in scene memory. Neuropsychologia , 35 (12), 1513–1517. [DOI] [PubMed] [Google Scholar]
- Rezec A. A., Dobkins K. R. (2004). Attentional weighting: A possible account of visual field asymmetries in visual search? Spatial Vision , 17 (4–5), 269–293. [DOI] [PubMed] [Google Scholar]
- Rubin N., Nakayama K., Shapley R. (1996, February 2, 1996). Enhanced perception of illusory contours in the lower versus upper visual hemifields. Science , 271 (5249), 651–653. [DOI] [PubMed] [Google Scholar]
- Schneider K. A., Richter M. C., Kastner S. (2004). Retinopic organization and functional subdivisions of the human lateral geniculate nucleus: A high-resolution functional magnetic resonance imaging study. The Journal of Neuroscience , 24 (41), 8975–8985. [DOI] [PMC free article] [PubMed] [Google Scholar]
- Silva M. F., Mateus C., Reis A., Nunes S., Fonseca P., Castelo-Branco M. (2010). Asymmetry of visual sensory mechanisms: Electrophysiological, structural, and psychophysical evidences. Journal of Vision , 10 (6): 19 1–11, http://www.journalofvision.org/content/10/6/26, doi:10.1167/10.6.26. [PubMed] [Article]. [DOI] [PubMed] [Google Scholar]
- Silver M. A., Ress D., Heeger D. J. (2005). Topographic maps of visual spatial attention in human parietal cortex. Journal of Neurophysiology , 94 (2), 1358–1371. [DOI] [PMC free article] [PubMed] [Google Scholar]
- Silver M. A., Ress D., Heeger D. J. (2007). Neural correlates of sustained spatial attention in human early visual cortex. Journal of Neurophysiology , 97 (1), 229–237. [DOI] [PMC free article] [PubMed] [Google Scholar]
- Skrandies W. (1987). The upper and lower visual field of man: Electrophysiological and functional differences. Progress in Sensory Physiology , 8, 1–93. [Google Scholar]
- Steel S. E., Mackie S. W., Walsh G. (1996). Visual field defects due to spectacle frames: Their prediction and relationship to UK driving standards. Ophthalmic and Physiological Optics , 16 (2), 95–100. [PubMed] [Google Scholar]
- Tripathy S. P., Cavanagh P. (2002). The extent of crowding in peripheral vision does not scale with target size. Vision Research , 42 (20), 2357–2369. [DOI] [PubMed] [Google Scholar]
- Van Essen D. C., Newsome W. T., Maunsell J. H. (1984). The visual field representation in striate cortex of the macaque monkey: Asymmetries, anisotropies, and individual variability. Vision Research , 24 (5), 429–448. [DOI] [PubMed] [Google Scholar]
- Whitney D., Levi D. M. (2011). Visual crowding: A fundamental limit on conscious perception and object recognition. Trends in Cognitive Sciences , 15 (4), 160–168. [DOI] [PMC free article] [PubMed] [Google Scholar]
- Yantis S., Hillstrom A. P. (1994). Stimulus-driven attentional capture: Evidence from equiluminant visual objects. Journal of Experimental Psychology: Human Perception and Performance , 20 (1), 95–107. [DOI] [PubMed] [Google Scholar]
- Yantis S., Jonides J. (1990). Abrupt visual onsets and selective attention: Voluntary versus automatic allocation. Journal of Experimental Psychology: Human Perception and Performance , 16 (1), 121–134. [DOI] [PubMed] [Google Scholar]
- Yeshurun Y., Rashal E. (2010). Precueing attention to the target location diminishes crowding and reduces the critical distance. Journal of Vision , 10 (10): 19 1–12, http://www.journalofvision.org/content/10/10/16, doi:10.1167/10.10.16. [PubMed] [Article]. [DOI] [PubMed] [Google Scholar]


