Abstract
Label-free isolation of single cells is essential for the growing field of single-cell analysis. Here, we present a device which prints single living cells encapsulated in free-flying picoliter droplets. It combines inkjet printing and impedance flow cytometry. Droplet volume can be controlled in the range of 500 pl–800 pl by piezo actuator displacement. Two sets of parallel facing electrodes in a 50 μm × 55 μm channel are applied to measure the presence and velocity of a single cell in real-time. Polystyrene beads with <5% variation in diameter generated signal variations of 12%–17% coefficients of variation. Single bead efficiency (i.e., printing events with single beads vs. total number of printing events) was 73% ± 11% at a throughput of approximately 9 events/min. Viability of printed HeLa cells and human primary fibroblasts was demonstrated by culturing cells for at least eight days.
I. INTRODUCTION
The isolation and analysis of single cells are an emerging field within the life sciences.1,2 Applications range from understanding complex heterogeneous biological samples, such as tumor biopsies,3 to rare cell isolation,4 or clone selection for biotechnological processes.5 Conventionally, cells are analyzed by bulk measurements on cell populations consisting of several thousands to ten thousand individual cells. Inherently, bulk measurements yield only averaged results. Due to heterogeneity in most cell samples, such measurements can lead to misleading results. Single-cell separation and subsequent single-cell analysis are therefore of large interest. Currently, the most prominent methods to isolate individual cells are limited dilution, micromanipulation, laser capture microdissection, fluorescence-activated cell sorting, and microfluidics.6 Limited dilution isolates cells by adjusting the cell concentration which, although easily automated by pipetting robotics, does not allow manipulation of a specific individual cell. Hence, cells can only be isolated randomly according to Poisson's statistical distribution.7 Using limited dilution, the theoretically highest yield for single cell seeding in a microwell plate (wells filled with truly single cells) is 37%. Even in this, theoretically optimal case 26% of the wells contain multiple cells, which are prohibitory for many single-cell applications, where multiple cell events must be avoided. Furthermore, 37% of the wells remain empty. Alternatives to this stochastic approach such as micromanipulation and laser capture microdissection can provide control of individually selected cells, but are labor intensive manual methods which have limited throughput. In contrast, fluorescence-activated cell sorting offers very high throughput, but requires a large sample with many cells and may affect the cell viability.6 More recent microfluidic lab-on-a-chip devices aim to combine the separation and subsequent analysis in order to implement a complete workflow. However, these approaches are typically designed to serve a very specific application and lack flexibility with respect to single-cell analysis techniques as well as compatibility to established laboratory workflows.
Inkjet-based printing of cells is well established today, demonstrated by its use in tissue engineering.8 It can also be employed to print single cells by limited dilution.9 The approach presented in this work10,11 employs flow-through impedance-based cell detection12 to trigger drop-on-demand printing and enable a controlled delivery of individual single cells than as opposed to random seeding according to the limited dilution method. This work differs from our previous work by replacing the optical cell detection presented previously13,14 with impedance-based chip-integrated real-time detection, which leads to a more compact system. Detection of cells via electrical excitation has been reported for printing systems previously.15,16 However, Feng et al.15 have proposed a system for printing of extraordinary large cells (oocytes) of typically 100 μm diameter, which is not well suited for printing of commonly used cell types in cell-based assay, diagnostics or recombinant protein production. Tornay et al.16 have not reported single bead printing efficiency or cell printing. Compared to these approaches, the work presented here features smaller droplet sizes and a parallel electrode configuration, as opposed to planar electrodes. Smaller droplets are beneficial in single cell analysis since the suspension buffer may contain undesired contaminants, which can be transferred with the cell. The parallel electrode configuration may lead to lower signal variation.17 Precise measurements of dielectric cell properties enabled by such electrodes are a prerequisite for sorting of heterogeneous cell populations in the future. Based on our previous works,10,11 we present here the complete system, the sensor characterization based on bead populations with different sizes and the optimization of the single bead printing efficiency from 26% to 73% ± 11% by analysis and optimization of the dispensing parameters.
II. MATERIALS AND METHODS
A. Principle
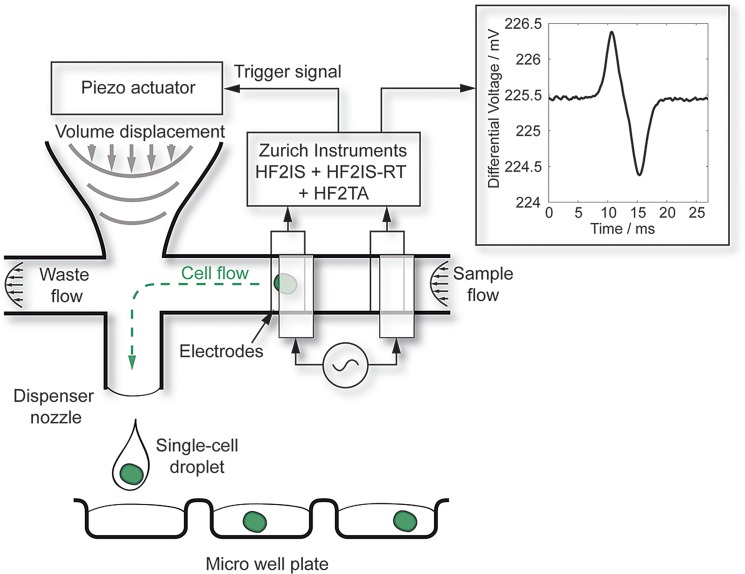
The working principle is schematically shown in Fig. 1. Cells, suspended in PBS (phosphate-buffered saline), enter the microfluidic dispenser chip (Fig. 1). The channel impedance is measured using integrated electrodes. The measurement is performed differentially to reduce undesired perturbations. Each cell passing the electrodes with the flow creates a positive peak at the first electrode pair and a negative peak at the second electrode pair. The signal is analyzed in real-time, in order to issue a trigger to the dispenser when a cell is detected in the channel. A piezo stack actuator deflects a silicon membrane, which forms the back side of a so called dosage chamber. By displacing the volume in the dosage chamber, a flow perpendicular to the sample flow is generated and droplets containing the single cell are expelled from the nozzle of the chip.
FIG. 1.
Schematic of the cell printing process. Sample flow enters the dispenser chip. Due to differential measurement of the channel impedance, they induce a positive peak at the first electrode pair and a negative peak at the second electrode pair. The signal is analyzed in real-time, the flow velocity is calculated from the signal and a piezo actuator is triggered to deflect a silicon membrane to produce a droplet containing the individual single cell.
The impedance signal is measured with two pairs of parallel facing electrodes. The top two electrodes are excited with an AC signal, typically in the range of 1 mV–100 mV with a frequency of 500 kHz–10 MHz. The current across the channel into the opposing electrodes is amplified with a current amplifier (HF2TA, Zurich Instruments) and measured differentially with an impedance spectroscope (HF2IS, Zurich Instruments). The resulting sensor signal is denoted here as
where is the real part, the imaginary part, and the phase angle. The signal amplitude is therefore . When passing the first set of electrodes, a cell causes a positive peak in the differential sensor signal, when passing the second set of electrodes, it causes a negative peak. This results in a characteristic double peak (inset of Fig. 1). Two main features can be derived from the characteristic double peak of each cell: the peak-to-peak voltage , and the transit time , the time between both peaks.
In flow-through impedance spectroscopy, it is common practice to interpret measurements at low frequency AC (e.g., 500 kHz) as a measure of the cell's volume,18 i.e., and therefore . Thus, sorting according to cell size becomes feasible.
B. Chip fabrication
The fabrication process of the microfluidic dispenser chip with integrated electrodes has been described in detail elsewhere.10,19 The dispenser chip comprises a nozzle channel connected to a dosage chamber to form the droplet dispenser and perpendicular to the nozzle a supply channel with two sets of parallel facing electrodes (Fig. 2). The electrodes are patterned on silicon and Pyrex wafers, which are bonded via an intermediate photo-patterned TMMF layer defining the microchannels.
FIG. 2.
(a) Optical micrograph of the dispenser chip. The close up shows the channel crossing with the nozzle and the electrodes. To the right a photograph of the entire chip can be seen, with its fluidic inlet and contact pads for electrical interfacing. (b) Schematic of the cross-section A–A, as indicated in (a). The chip consists of a layer stack of silicon, TMMF photoresist and Pyrex glass. (c) Cross-section illustrating the deflection of the silicon membrane by a piezo stack actuator to dispense droplets on demand.
III. EXPERIMENTAL RESULTS
A. Dispensing performance
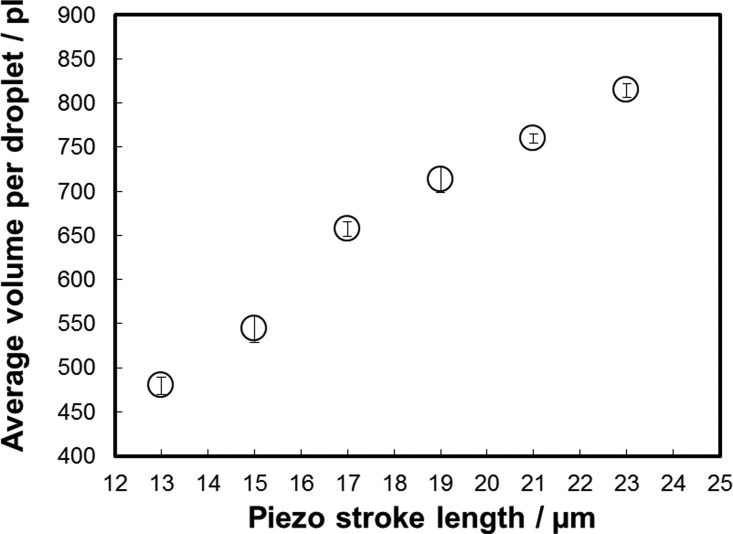
The dispensing performance has been characterized gravimetrically using a gravimetric regression method.20 Due to the small volume of individual droplets, each measurement was performed on 50 droplets, which have been dispensed into a vial filled with silicone oil, to prevent evaporation. The piezo is driven by a specific electronic drive circuit (R5-Piezoelektronik, BioFluidix GmbH). First, the piezo extends to a given piezo stroke length with a velocity of 250 μm/s. It holds its position for 100 μs and then slowly retracts with a velocity of 0.3 μm/s, to keep the nozzle meniscus in its position and to avoid gas to be sucked into the chip. Fig. 3 shows droplet volumes in the range of approximately 500 pl–800 pl as a function of piezo extension (piezo stroke length) from 13 μm to 24 μm.
FIG. 3.
Droplet volume versus piezo stack extension for PBS. The ejected volume depends linearly on the piezo actuator extension (piezo stroke length). Droplet volume has been measured gravimetrically using a precision scale (XP2U, Mettler Toledo). Each measurement point represents the average of 50 droplets and its error bar represents the standard deviation of ten measurements.
B. Real-time detection
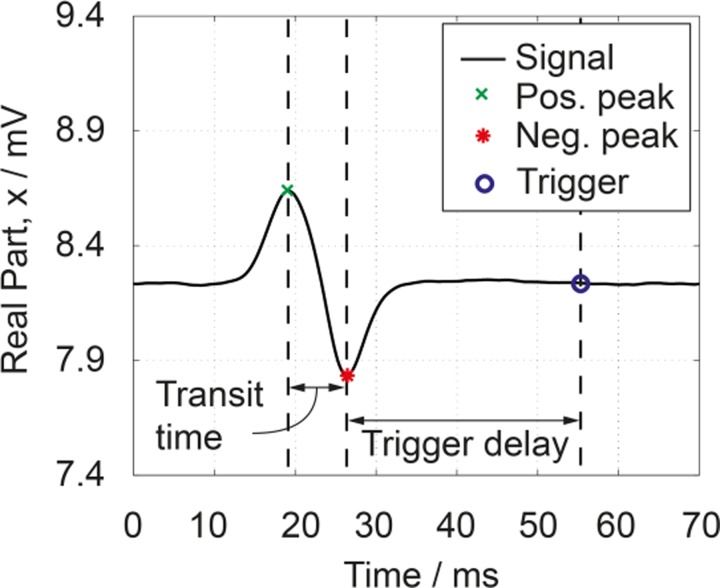
A real-time algorithm running within the impedance spectroscope (HF2IS+HF2IS-RT, Zurich Instruments) calculates the mean and standard deviation of the signal and thresholds for cell events (Fig. 4). Upon detecting an event, the algorithm determines the minimum and maximum of the cell's double peak signal and calculates the cell's velocity from the transit time (the time taken to travel between the electrodes, or equivalently the time between the extrema) and the well-known electrode distance (40 μm). This allows the algorithm to issue a trigger signal to the piezo actuator via the DIO port of the impedance spectroscope at the time the cell arrives at the channel crossing in order to dispense the cell.
FIG. 4.
Impedance signal of a single 15 μm bead. The differential measurement with two sets of electrode pairs creates a positive/negative peak when a bead passes the 1st/2nd set of electrodes. Bead velocity is calculated from transit time and the electrode distance (40 μm/7 ms = 5.6 mm/s).
C. Sensor characterization
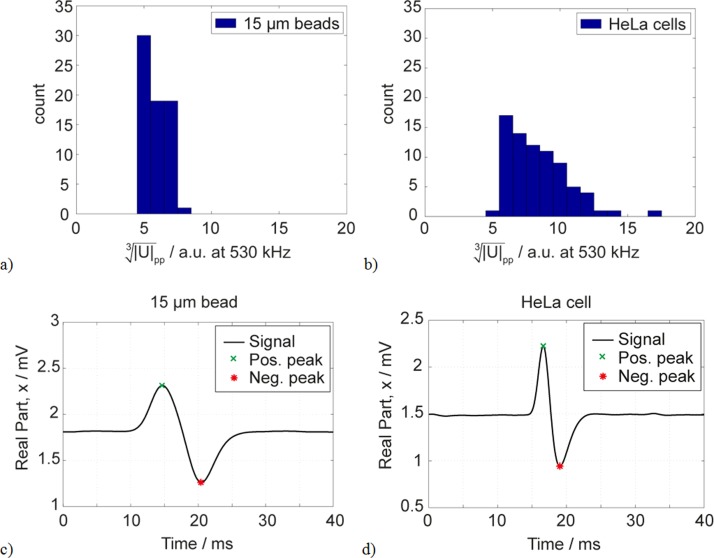
The impedance-based sensor has been characterized with three mono-disperse populations of polystyrene beads of different sizes (10 μm, 15 μm, and 20 μm). Polysterene beads are a very suitable model for the characterization of the system. At this impedance measurements frequency (530 kHz), the resulting signal is very similar to those of biological cells. In Fig. 5, the histograms of HeLa cell populations and 15 μm beads are shown. The cells have slightly larger size variation, which is probably due to the biological heterogeneity. Also the characteristic double peaks of 15 μm beads and HeLa cells are comparable (Figs. 5(c) and 5(d)).
FIG. 5.
Comparison of real-time impedance measurements of 15 μm beads and HeLa cells. (a) Histogram of 15 μm bead measurement. (b) Histogram of HeLa cell measurements. (c) Exemplary double peak of a 15 μm bead. (d) Exemplary double peak of a HeLa cell. This data illustrate the suitability of 15 μm beads as model for HeLa cells.
The beads were suspended in PBS at a concentration of approximately 105 beads per ml and fed into the chip. The driving signal on the upper electrodes was 100 mV at 530 kHz. Fig. 6 confirms that is approximately proportional to the bead diameter, as stated previously (see Sec. II A). The measurement of has coefficients of variation (CV) of 17% (10 μm beads), 15% (15 μm beads), and 12% (20 μm beads), respectively, for polystyrene beads that have <5% CV in diameter.
FIG. 6.
Size measurement on calibrated polystyrene beads. The impedance was measured at 530 kHz, and the measurement signal is plotted versus data given in the manufacture's data sheet (GKisker). Error bars show the standard deviation of N = 622 (10 μm), N = 924 (15 μm), and N = 417 (20 μm) measured beads.
To understand the origins of these variations, the correlation between sensor signals and bead position in the channel is analyzed in the following.
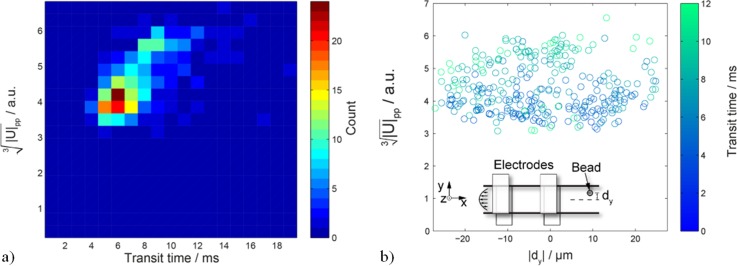
First, the beads' transit time is correlated with the size measurement in terms of . In Fig. 7(a), the impedance signal is plotted versus in a density plot. Adjacent to the region of highest bead density, there is a small portion of the bead population, which had high transit times and caused higher peak-to-peak signals .
FIG. 7.
(a) Density plot of vs. transit time for 10 μm beads. (b) versus y-position in channel with color-coded transit time. Inset: schematic of the measurement. There is no observable variation in y-direction. The slower beads causing higher signals in (a) can be explained by beads flowing near the top or bottom of the channel (closer to the electrodes).
Due to low Reynolds numbers, laminar flow conditions in the channel can be assumed. Also inertial focusing effects are not apparent in this regime. Thus, the beads are randomly distributed over the cross-section of the channel and slower beads flow closer to the channel walls. Consequently, slow beads in Fig. 7(a) are presumed to pass close to one of the four channel walls. With the optical imaging capabilities of the experimental setup, it is possible to correlate the bead's positions in-plane of the chip (see inset of Fig. 7(b)). An automated object detection algorithm, running in Matlab (Mathworks, Natick, MA, USA), is used to derive the distance of each bead from the channel center. Fig. 7(b) plots the bead position , from the middle of the channel (transverse direction), versus the impedance signal . There is no significant correlation between and . The artifacts are therefore not observed when beads pass close to the channel side walls. They are observed when beads pass close to the electrodes (at the top and bottom of the channel). A possible explanation is based on the heterogeneity of the electric field between the electrodes. The field strength closer to the electrodes is higher, than in the center of the channel, which may result in signal distortion.21 The effect of a non-conductive beads displacing conductive PBS is artificially amplified in region with higher field strength. These findings are in accordance with simulations and experimental data published by Spencer and Morgan,22 where the bead position was not measured.
Understanding the origin of the variation in measured signals allows deriving improvements for the future. The first possibility to reduce the signal variation is to filter out slow beads during detection. This would lead to a certain cell loss, but may improve the signal quality. A second approach would be focusing in vertical (z−) direction.
D. Printing results
To expel a cell encapsulated within a free flying droplet from the nozzle, the dispenser should be triggered when the particle to be dispensed is at the channel crossing (Fig. 8(a)). To calculate the correct timing in real-time, the measured transit time is multiplied with a fixed factor, which is introduced as
To optimize the trigger delay ratio, it was been varied from 2 to 5.5 at a flow rate of approximately 3 μl/h. Fig. 8(a) shows a simplified schematic of the channels and electrodes (compare to Fig. 1). Using optical imaging, the position of each bead at the moment of triggering has been monitored. Fig. 8 shows the position of beads in the chip, in the moment of dispensing, with different colors coding for the respective trigger delay ratio. Small trigger delay ratio, such a 2 (red dots), result in too early dispensation. For larger trigger delay ratios, such as 5 or 5.5, many beads have already reached the waste channel and were not expelled. A trigger delay ratio of 4 (black dots in Fig. 8(b)) was found to work well, as the beads are approximately in the center of the channel crossing.
FIG. 8.
Adjustment of the trigger delay. (a) Beads are detected when passing the electrodes. The trigger is sent to the dispenser with a delay. The delay is calculated in real-time by multiplication of the measured transit time (from electrode set A to set B) with the trigger delay ratio. The aim is to trigger the dispensation, when the bead is right at the channel crossing. (b) Position of beads, directly before the trigger is issued. The dot color codes for the applied trigger delay ratio. Small trigger delay ratios, such as 2 (red dots), result in too early triggering. Larger trigger delay ratios, such as 5.5 (yellow dots), result in too late triggering.
A subsequent printing experiment showed, that with a trigger delay ratio of 4, 25% of beads were ejected out of the nozzle, 47% were diverted into the nozzle, and 28% were missed and passed through the outlet channel (N = 81). This means approximately 72% of beads were displaced towards nozzle, but only 25% were ejected with the first dispensation. Beads, which remained in the nozzle, after the first dispensation, can be dispensed using multiple dispenses in succession.
To quantify the efficiency of the printing process, the single-bead printing efficiency
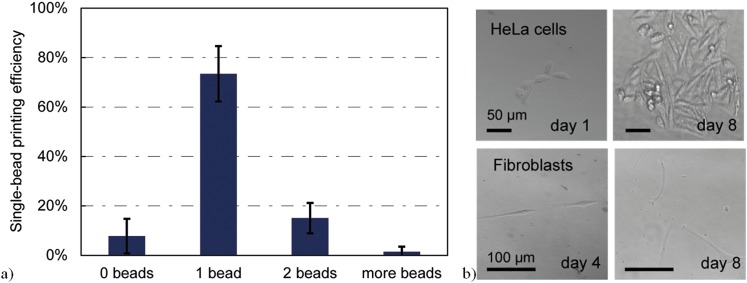
is introduced. Optical imaging of the beads during printing is used to determine the single-bead printing efficiency. Results are shown in Fig. 9(a). Ten subsequent dispensations were used to make sure all beads, that entered the nozzle were dispensed, before the next bead is detected. Using this burst of dispensations with 10 issued triggers per detection event, 73% ± 11% (N = 94) of printing events a single bead has been dispensed. Approximately, 8% of the printing events missed the bead (no beads dispensed), and approximately in 17% of the printing events multiple beads were dispensed. The bead distribution in an ideal poisson would yield 37% events with no bead, 37% single beads, and 26% events with multiple beads.
FIG. 9.
(a) Single bead efficiency, i.e., printing events with single bead per total number of printing events. (b) Qualitative viability of printed HeLa and fibroblast cells. Cultivation of at least 8 days was possible and proliferation was observed.
After successful printing of single micro beads, beads were replaced by cells and the viability of printed cells has been evaluated qualitatively. Cells have been resuspended in PBS and printed with the same approach into wells of a microwell plate, which was previously filled with culture medium. HeLa cells (cervical cancer cell line) and fibroblast (human primary stem cells) have been printed into microwells and were subsequently cultured for eight days (Fig. 9(b)). Cell adhesion and proliferation have been observed in most cases, indicating that the described process of printing is not particularly harmful and works for cells and beads in a similar way.
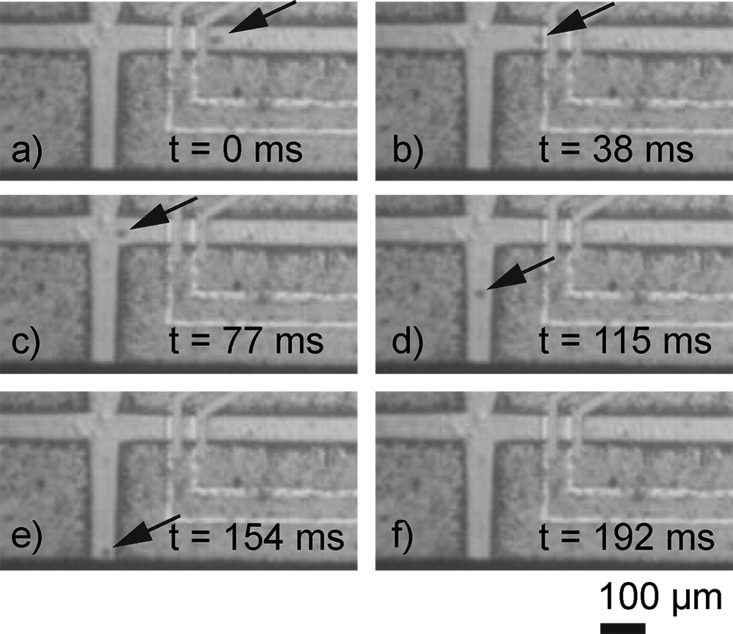
The systems capability to successfully print single cells is demonstrated in Fig. 10. A single HeLa cell approaches the sensor, the electrodes at the top and bottom of the channel, is detected and diverted to the nozzle region by the drop-on-demand dispensing and printing out of the nozzle orifice.
FIG. 10.
Printing of a single HeLa cell. The optical micrographs (a)–(f) show how a single HeLa cell approaches the sensor and is printed through the nozzle orifice. The last image (f) shows the chip after the single cell has been printed.
IV. CONCLUSION
The presented chip combines impedance-based cell detection, real-time signal processing, and drop-on-demand printing. Droplet volume was found to be adjustable in the range of 500 pl to 800 pl. The impedance sensor has been characterized with beads of known sizes, and the printing parameters were optimized. In particular, the influence of bead position within the channel on the resulting peak signal value in terms of , encoding the bead volume, has been investigated. It turned out that the signal, which is used to calculate the particle or cell volume is limited by CV's of 12%–17%. It varies depending on the vertical position of the particle within the channel. Furthermore, the delay ratio has been adjusted to achieve significantly higher yield than with random printing. Single polystyrene beads have been printed with an efficiency of 73% ± 11%. Finally, the method has been applied to cells instead of beads and reasonable cell viability has been qualitatively proven for printed HeLa and fibroblast cells. The presented approach may be used for clonal cell line production or cell isolation in single-cell genomics. In future works, impedance-based cell detection opens up the option for label-free single-cell sorting, based on cell size as well as dielectric properties of cells.
ACKNOWLEDGMENTS
This work has been financed by the European Commission (Project PASCA, www.pasca.eu, FP7 GA257073).
References
- 1.Fritzsch F. S. O., Dusny C., Frick O., and Schmid A., Annu. Rev. Chem. Biomol. Eng. 3, 129–155 (2012). 10.1146/annurev-chembioeng-062011-081056 [DOI] [PubMed] [Google Scholar]
- 2.Editorial, Nat. Methods 11, 1 (2013). 10.1038/nmeth.2801 [DOI] [Google Scholar]
- 3.Dalerba P., Kalisky T., Sahoo D., Rajendran P. S., Rothenberg M. E., Leyrat A. A., Sim S., Okamoto J., Johnston D. M., Qian D., Zabala M., Bueno J., Neff N. F., Wang J., Shelton A. A., Visser B., Hisamori S., Shimono Y., van de Wetering M., Clevers H., Clarke M. F., and Quake S. R., Nat. Biotechnol. 29, 1120–1127 (2011). 10.1038/nbt.2038 [DOI] [PMC free article] [PubMed] [Google Scholar]
- 4.Chen Y., Li P., Huang P.-H., Xie Y., Mai J. D., Wang L., Nguyen N.-T., and Huang T. J., Lab Chip 14, 626 (2014). 10.1039/c3lc90136j [DOI] [PMC free article] [PubMed] [Google Scholar]
- 5.Kirchhoff J., Raven N., Boes A., Roberts J. L., Russell S., Treffenfeldt W., Fischer R., Schinkel H., Schiermeyer A., and Schillberg S., Plant Biotechnol. J. 10, 936–944 (2012). 10.1111/j.1467-7652.2012.00722.x [DOI] [PubMed] [Google Scholar]
- 6.Shapiro E., Biezuner T., and Linnarsson S., Nat. Rev. Genet. 14, 618–630 (2013). 10.1038/nrg3542 [DOI] [PubMed] [Google Scholar]
- 7.Moon S., Kim Y.-G., Dong L., Lombardi M., Haeggstrom E., Jensen R. V., Hsiao L.-L., Demirci U., and Covas D., PLoS ONE 6, e17455 (2011). 10.1371/journal.pone.0017455 [DOI] [PMC free article] [PubMed] [Google Scholar]
- 8.Boland T., Xu T., Damon B., and Cui X., Biotechnol. J. 1, 910–917 (2006). 10.1002/biot.200600081 [DOI] [PubMed] [Google Scholar]
- 9.Liberski A. R., Delaney J. T., and Schubert U. S., ACS Comb. Sci. 13, 190–195 (2011). 10.1021/co100061c [DOI] [PubMed] [Google Scholar]
- 10.Schoendube J., Yusof A., Wright D., Kalkandjiev K., Zengerle R., and Koltay P., in Proceedings of Actuator, 2012. [Google Scholar]
- 11.Schoendube J., Wright D., Yusof A., Zengerle R., and Koltay P., in Proceedings of MicroTAS, 2012. [Google Scholar]
- 12.Cheung K. C., Di Berardino M., Schade-Kampmann G., Hebeisen M., Pierzchalski A., Bocsi J., Mittag A., and Tárnok A., Cytometry 77A, 648–666 (2010). 10.1002/cyto.a.20910 [DOI] [PubMed] [Google Scholar]
- 13.Gross A., Schoendube J., Niekrawitz S., Streule W., Riegger L., Zengerle R., and Koltay P., J. Lab. Autom. 18, 504–518 (2013). 10.1177/2211068213497204 [DOI] [PubMed] [Google Scholar]
- 14.Yusof A., Zengerle R., and Koltay P., in Proceedings of MEMS, 2011, p. 1059. [Google Scholar]
- 15.Feng L., Sun Y., Ohsumi C., and Arai F., Biomicrofluidics 7, 054113 (2013). 10.1063/1.4824394 [DOI] [PMC free article] [PubMed] [Google Scholar]
- 16.Tornay R., Chapuis V., Haguet V., Chatelain F., and Renaud P., in Proceedings of Transducers, 2007, p. 695. [Google Scholar]
- 17.Sun T. and Morgan H., Microfluid. Nanofluid. 8, 423–443 (2010). 10.1007/s10404-010-0580-9 [DOI] [Google Scholar]
- 18.David F., Hebeisen M., Schade G., Franco-Lara E., and Di Berardino M., Biotechnol. Bioeng. 109, 483–492 (2012). 10.1002/bit.23345 [DOI] [PubMed] [Google Scholar]
- 19.Schoendube J., Yusof A., Kalkandjiev K., Zengerle R., and Koltay P., J. Micromech. Microeng. 25, 025008 (2015). 10.1088/0960-1317/25/2/025008 [DOI] [Google Scholar]
- 20.Liang D., Steinert C., Bammesberger S., Tanguy L., Ernst A., Zengerle R., and Koltay P., Meas. Sci. Technol. 24, 025301 (2013). 10.1088/0957-0233/24/2/025301 [DOI] [Google Scholar]
- 21.Sun T., Green N. G., Gawad S., and Morgan H., IET Nanobiotechnol. 1, 69 (2007). 10.1049/iet-nbt:20070019 [DOI] [PubMed] [Google Scholar]
- 22.Spencer D. and Morgan H., Lab Chip 11, 1234 (2011). 10.1039/c1lc20016j [DOI] [PubMed] [Google Scholar]


