Abstract
βII-spectrin (SPTBN1) is an adapter protein for Smad3/Smad4 complex formation during TGF-β signal transduction. Forty percent of SPTBN1+/− mice spontaneously develop hepatocellular carcinoma (HCC), and most cases of human HCC have significant reductions in SPTBN1 expression. In this study, we investigated the possible mechanisms by which loss of SPTBN1 may contribute to tumorigenesis. Livers of SPTBN1+/− mice, compared to wild type mouse livers, display a significant increase in EpCAM+ cells and overall EpCAM expression. Inhibition of SPTBN1 in human HCC cell lines increased the expression of stem cell markers EpCAM, Claudin7 and Oct4, as well as decreased E-cadherin expression and increased expression of vimentin and c-Myc, suggesting reversion of these cells to a less differentiated state. HCC cells with decreased SPTBN1 also demonstrate increased sphere formation, xenograft tumor development and invasion. Here, we investigate possible mechanisms by which SPTBN1 may influence the stem cell traits and aggressive behavior of HCC cell lines. We found that HCC cells with decreased SPTBN1 express much less of the Wnt inhibitor Kallistatin and exhibit decreased β-catenin phosphorylation and increased β-catenin nuclear localization, indicating Wnt signaling activation. Restoration of Kallistatin expression in these cells reversed the observed Wnt activation. Analysis of publicly available expression array datasets indicates that SPTBN1 expression in human HCC tissues is positively correlated with E-cadherin and Kallistatin levels, and decreased SPTBN1 and Kallistatin gene expression is associated with decreased relapse-free survival. Our data suggest that loss of SPTBN1 activates Wnt signaling, which promotes acquisition of stem cell-like features, and ultimately contributes to malignant tumor progression.
Keywords: SPTBN1, β-catenin, stem cell, Wnt signaling, hepatocellular carcinoma
Introduction
Hepatocellular carcinoma (HCC) is the third leading cause of cancer deaths worldwide. In 2010, liver cancer caused 754,000 deaths, representing an increase of 62.4% since 1990 (1). This trend is set to continue, and an estimated 23,000 men and 8,000 women in the United States will be diagnosed with HCC in 2013(2). Most patients with HCC are diagnosed at an advanced stage and thus have a poor prognosis, with a 5-year survival rate of less than 5% (3). There is therefore an urgent need to understand the mechanisms of HCC progression, as this knowledge will promote the development of biomarkers and therapeutics for the disease.
Recent studies have highlighted the critical role that cancer stem cells (CSCs) play in tumor metastasis, therapeutic resistance and recurrence of various cancers (4). The presence of CSCs has been identified in various tumors and cancer cell lines. These stem cells, like other tissue specific stem cells, self-renew, express stem cell markers such as epithelial cell adhesion molecule (EpCAM) and Oct 4, and are tumorigenic. The critical roles that the TGF-β, Wnt, Notch and other signaling pathways are now known to play in the maintenance of stemness in cancer cells strengthen a growing body of evidence that cancer cells often reactivate latent developmental programs to regulate tumorigenesis (5–8). Emerging evidence suggests that cancer stem-like cells may be more invasive than more differentiated cancer cells (9).
The acquisition of an epithelial-mesenchymal transition (EMT) phenotype is a critical process involved in the transition of early stage carcinomas into invasive malignancies, a transition that is often associated with the loss of epithelial differentiation and gain of a mesenchymal phenotype (10). Induction of EMT stimulates cancer cells to adopt stem cell characteristics (11).
Wnt/β-catenin signaling is essential for stem cell regulation and tumorigenesis. Binding of Wnt to the Frizzled family of receptors and to low-density lipoprotein receptor-related protein 5 (LRP5) or LRP6 co-receptors stimulates Wnt/β-catenin signaling, which regulates β-catenin phosphorylation and context-dependent transcription (12). HCC cell lines express several canonical and noncanonial Wnt signaling receptors, but only Wnt3 was strongly and uniformly expressed in all cell lines tested (13). Activation of Wnt signaling results in dephosphorylation and nuclear translocation of β-catenin, which in turn transactivates downstream genes (12).
βII-spectrin (SPTBN1, previously also known as ELF or β2SP; the official name in mice is Spectrin beta 2, isoform 2 (SPNB2)), the most common nonerythrocytic member of the β-spectrin gene family, functions as an adapter protein for Smad3/Smad4 complex formation during TGF-β signal transduction, and is required for embryonic liver development (14). SPTBN1 also plays a role in liver regeneration, platelet formation, and heart development (15–17). SPTBN1 is emerging as a potent regulator of tumorigenesis. In the SPTBN1+/− mouse model, downregulation of SPTBN1 confers susceptibility to liver cancer at an incidence rate of approximately 40%–70% within 15 months (18). SPTBN1+/− mouse livers exhibit significantly increased mRNA levels of several Wnt-related genes, including LRP6, Wnt3a, and Wnt10a, which all play critical roles in HCC pathogenesis (19). Similarly, in clinical data, significant reductions in SPTBN1 expression are found in most cases of human HCC, gastric cancer, and lung cancers (20).
In this study, we show that SPTBN1+/− mice have twice the number of EpCAM-positive (EpCAM+) liver cells compared to WT mice. Consistent with the effect of SPTBN1 loss on stemness, we show for the first time that SPTBN1 regulates the Wnt inhibitor kallistatin to modulate β-catenin phosphorylation and nuclear translocation.
Materials and Methods
Cell culture and Mouse maintenance
HCC cell lines PLC/PRF5, SNU449 and SNU398 were originally obtained from the American Type Culture Collection (Manassas, VA) and cultured as recommended. Mouse embryonic fibroblasts (MEFs) derived from SPTBN1+/− mice and wild type (WT) were derived as described (14). Animal care was in accordance with institutional guidelines and under approved animal care protocols (protocol number: 12-032-100060).
Fluorescence-activated cell sorting (FACS)
A single-cell suspension from livers of WT and SPTBN1+/− mice was obtained using a modified two-step collagenase perfusion method as described (21). Cells were blocked with anti-FcR antibody, co-stained with phycoerythrin (PE)-conjugated EpCAM antibody (SC53532 PE, Santa Cruz), and analyzed by FACSCalibur (Becton Dickinson).
RNA extraction, real-time quantitative RT-PCR
Total RNA was extracted using RNeasy Mini Kit (Qiagen #74106). cDNA was synthesized using First-Strand cDNA Synthesis kit (Fermentas, St. Leon-Roth, Germany). The real-time PCR reaction kit contained 0.2 μM sense primer, 0.2 μM antisense primer, 12.5 μl SYBR Green I (Toyobo, Osaka, Japan), and 5 μl of previously synthesized cDNA in a total volume of 25 μl. Primers used can be found in supplement materials.
Indirect Immunofluorescence
Cells were plated in 24 well plates and fixed with methanol (−20°C) for 10 min, permeabilized with 0.25% Triton X-100 and processed for indirect immunofluorescence. Cells were examined under an inverted fluorescence microscope (Olympus, Japan). Nuclear localization intensity measurement of β-catenin in MEFs was performed with image capture using a 60× oil lens on the Olympus FV 300 confocal microscope.
Western blot analysis
Cells were lysed and denatured at 95°C for 5 min in sample buffer. Equal amounts of protein was separated on an SDS-polyacrylamide gel and transferred onto a nitrocellulose membrane (Invitrogen, Carlsbad, CA, USA). Membranes were blocked in 5% milk solution overnight and incubated with primary antibodies (antibodies used can be found in supplement materials).
Tumor sphere formation assay
Single cells (5,000/well) were seeded in triplicate onto a 6-well ultra-low attachment plate (Corning) in serum-free DMEM/F-12 supplemented with 10 ng/mL epidermal growth factor, 5 mg/mL insulin, 0.5 mg/mL hydrocortisonum, and bovine pituitary extract (Invitrogen). After 10 to 14 days of culture, the number of tumor spheres formed (diameter >100μm) was counted under a microscope.
Cell adhesion assay
Cells (2 ×10⁴/well) were allowed to adhere to type IV collagen (Sigma, St. Louis, MO, USA) coated 96-well plate for 1 h in a 37°C 5% CO2 incubator. Attached cells were fixed with 4% paraformaldehyde, stained with 100 μl of 0.5% crystal violet, and lysed with 100 μl of 1% acetic acid solution in ethanol before reading at A570 using a multifunction reader (Tecan GENios, Zurich, Switzerland).
Cell Invasion/migration assays
Invasion assays were performed in a 24-well transwell chamber (Corning, NY, USA). The 8-mm pore inserts were coated with 20 μl of Matrigel (Becton Dickinson Labware, Bedford, MA). Cells were added to coated filter (5×10⁴ cells/filter) in 200 μl of serum-free medium in triplicate wells. 500 μl of 10% FBS media was added in the lower compartments. After 36 h incubation at 37 °C in a 5% CO2 incubator, upper surface of the filter was wiped off using a cotton swab. Cells that migrated through the filter were fixed, stained with 0.5% crystal violet, photographed, and counted. Five random images of the cells were captured for graphic presentation. Cells in each image were counted, and mean standard deviation values were calculated. The migration assays were conducted in a similar fashion, except that the plates were not coated with Matrigel and the plates were incubated for 18 h.
Tumor xenografts in nude mice
Six-week-old female athymic nude mice were purchased from Harlan (Indianapolis, IN, USA) and maintained in our institutional animal facilities, which are approved by the American Association for Accreditation of Laboratory Animal Care. Four to six mice per group were injected subcutaneously in the flank area with 5×10⁶ human HCC PLC-Consh cells or PLC-SPTBN1sh cells in 100 μl of PBS. Tumor volume was calculated according to the formula V =0.5×a2 ×b, where a represents the smallest superficial diameter and b represents the largest superficial diameter.
Analysis of gene array database from human HCC
Two public HCC study publications were obtained from the Gene Expression Omnibus (GSE6764 and GSE14520) (22). The raw data set of gene expression profiling from these studies as well as the public clinical data was processed and uploaded into our Georgetown Database of Cancer (G-DOC) (23). Then, correlation coefficients (r) of SPTBN1, E-cadherin and Kallistatin, and p-values (P<0.05 was considered significant) were obtained using Pearson correlation tests. Prognostic relevance on loss of SPTBN1 and Kallistatin gene expression in HCC patients was assessed by survival analysis. Survival curves were determined by using the Kaplan–Meier method, and were analyzed by using the log-rank test and Cox proportional Hazards model. Detailed analysis of gene array data is submitted as Supplementary Material.
Immunohistochemical (IHC) staining of SPTBN1 and Kallistatin in human HCC tissue samples
Fifty-two paraffin-embedded HCC specimens, from patients who had curative resection of HCC, were obtained from Georgetown University Medical Center. Informed consent was obtained from all patients under an approved IRB protocol (# 1992-048). The tissue slides were stained with primary antibodies for SPTBN1 and Kallistatin (Santa Cruz Biotechnology, Inc., Santa Cruz, CA). Protein expression scores based on intensity and distribution for each protein in both cancer cell and surrounding non-cancerous liver cells were obtained. The methodology describing IHC staining and analysis is submitted as Supplementary Material.
Statistical analysis
Mean values were calculated (n≧3) and presented as mean ± SEM. One-way ANOVA and the Student’s t-test were used to compare the means between different groups. Pearson’s correlation coefficients were obtained for the association between continuous variables. The Chi-square test was used to compare categorical variables. Kaplan-Meier curves, Log-rank test, and Cox proportional hazard model were used to analyze the survival data. Statistical significance was defined as P < 0.05. SAS computer software version 9.3 (SAS Inc, Cary NC) was used for data analysis.
Results
EpCAM expression is increased in SPTBN1+/− mouse liver tissue
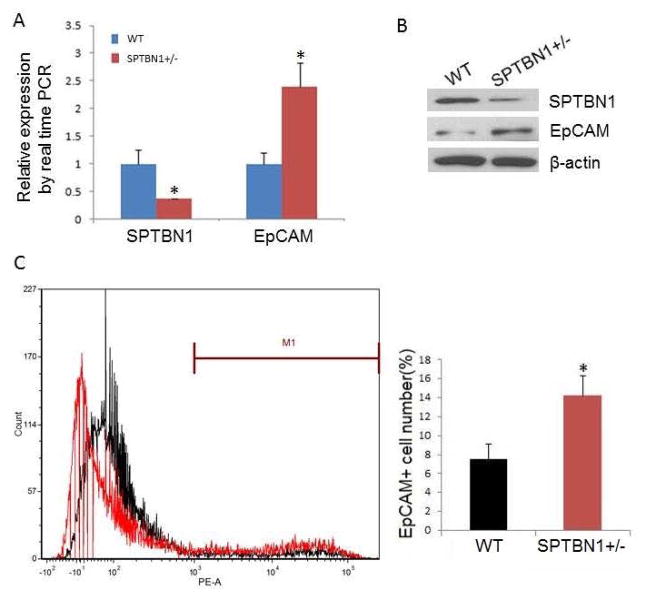
As shown in Fig. 1A and 1B, mRNA and protein levels of EpCAM in SPTBN1+/− mouse liver were almost two times higher than in WT mouse liver. Fluorescence-activated cell sorting (FACS) demonstrated that the number of EpCAM positive cells doubled in SPTBN1+/− mouse liver compared to WT (Fig. 1C).
Figure 1.
EpCAM levels increase in mouse liver with decreased SPTBN1 expression. A. mRNA levels of SPTBN1 and EpCAM by real time PCR in liver from both WT and SPTBN1 +/− mice (n =5),*P<0.01. B. Western blot of SPTBN1 and EpCAM in WT and SPTBN1 +/− mouse livers. C. EpCAM+ cells were sorted from the livers of WT and SPTBN1+/− mice by FACS using antibody to EpCAM. The left panel of Figure 1C depicts the number of the EpCAM+ liver cells sorted from WT mouse liver (black) and SPTBN1+/− mouse liver (red). This data was quantified and blotted, *P<0.01 compared to WT (Fig 1C, right panel).
Knockdown of SPTBN1 expression in PLC/PRF/5 and SNU449 cell lines promotes stem cell-like traits
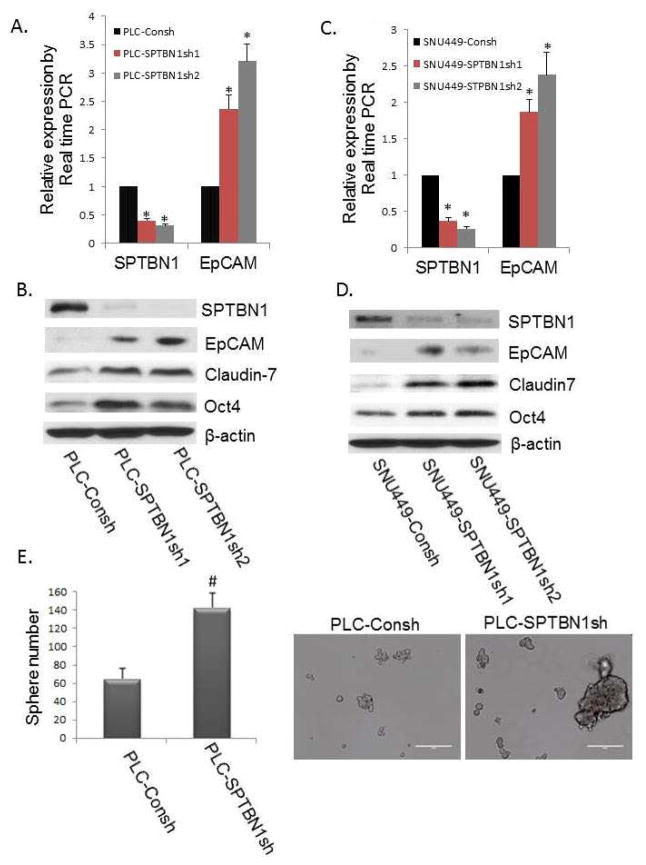
To determine if reduced SPTBN1 elevated the expression of stem/progenitor cell markers in HCC cell lines, as was observed in the primary liver tissue of SPTBN1+/− mice, we examined the expression of stem/progenitor cell markers such as EpCAM, Claudin7, and Oct 4, which were all increased in the SPTBN1 knockdown HCC cell lines (Figure 2).
Figure 2.
Reduction of SPTBN1 promotes stem cell like traits in the PLC/PRF/5 and SNU449 HCC cell lines. A and C: Comparison of the EpCAM mRNA levels by real time PCR in the two HCC cell lines with stable knockdown of SPTBN1 expression generated with two different shRNA constructs (indicated by SPTBN1sh1 and SPTBN1sh2) compared with control cells carrying the shRNA control vector (indicated by Consh) in which there is no knockdown of SPTBN1. The left sides of Figure 2A and 2C show decreased SPTBN1 expression resulting from stable knockdown of the SPTBN1 gene in PLC/PRF/5 (A) or SNU449 cells (C) compared with the Consh shRNA containing control cells. The right panels illustrate increased EpCAM expression in HCC cells in SPTBN1 knockdown cells compared with control cells (*P<0.01). B and D: Western Blot of stem/progenitor cell markers, including EpCAM, Claudin7, and Oct4 in PLC/PRF/5 cells (B) and SNU449 cells (D) without or with stable knockdown of SPTBN1 expression. E. Inhibition of SPTBN1 expression in PLC/PRF/5 cells (carrying stable SPTBN1 shRNA knockdown constructs) promoted sphere formation compared with control cells (PLC-Consh). Twice as many spheres (size of sphere >100 μM) and an increased number of larger spheres (size of sphere > 200 μM) were formed by SPTBN1 knockdown PLC/PRF/5 cells as compared to unaltered cell lines carrying only control PLC-Consh (P<0.05).
This reproducible increase in stem cell markers in both SPTBN1 deficient mouse liver tissue and HCC cell lines prompted us to evaluate the stem cell phenotype of the SPTBN1 knockdown cells using a sphere formation assay. Twice as many spheres (>100μM) and an increased number of larger spheres (> 200μM) were formed by SPTBN1-reduced PLC/PRF/5 cells as compared to unaltered cell lines (Figure 2E). These data provide additional evidence that SPTBN1 inhibition promotes stem cell-like traits in PLC/PRF/5 and SNU449 cell lines.
Loss of SPTBN1 decreases E-cadherin, increases vimentin and promotes malignant behaviors of HCC cell lines
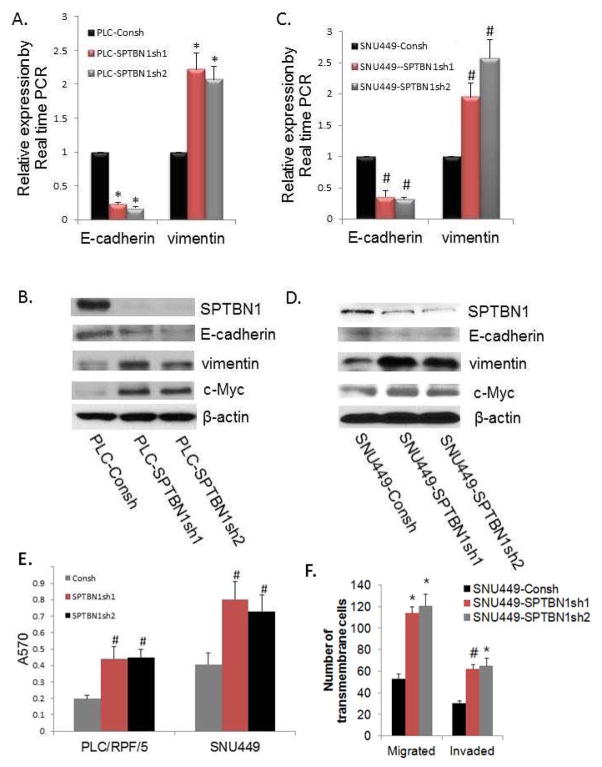
we show that loss of SPTBN1 decreases the EMT marker E-cadherin while increasing vimentin at mRNA and protein levels in PLC/PRF/5 cells (Figure 3A, B) and SNU449 cells (Figure 3C, D). The expression of the Wnt-target gene c-Myc was also increased in the SPTBN1 knockdown cells.
Figure 3.
Loss of SPTBN1 decreases levels of E-cadherin while increasing levels of vimentin, c-Myc, and promotes malignant behaviors of HCC cell lines.. A and C: Comparison of levels of the E-cadherin and vimentin mRNA by real time PCR in PLC/PRF/5 cells (A) or SNU449 cells (C) without or with stable knockdown of SPTBN1 expression, *P <0.01compared to PLC-Consh. #P<0.05 compared to SNU449-Consh. B and D: Western Blot of E-cadherin, vimentin, and c-Myc in PLC/PRF/5 cells (B) or SNU449 cells (D) without or with stable knockdown of SPTBN1. (E) Loss of SPTBN1 promotes adhesion capacity of PLC/RPF/5 and SNU449 cells. # P<0.05 compared to control group. (F) Loss of SPTBN1 promotes both migration and invasivion of SNU449 cells, *P<0.01, #P<0.05 compared to control group. HCC cells with decreased SPTBN1 migrate and invade twice as much as WT cells.
Given that loss of SPTBN1 promotes stem cell-like traits, we hypothesized that loss of SPTBN1 also increases HCC cell invasion. As shown in Fig. 3E and F, the adhesive, migratory, and invasive potential of PLC/PRF/5 and SNU449 was significantly promoted by blocking SPTBN1 expression.
Loss of SPTBN1 promotes tumor formation and invasion of HCC cells in vivo
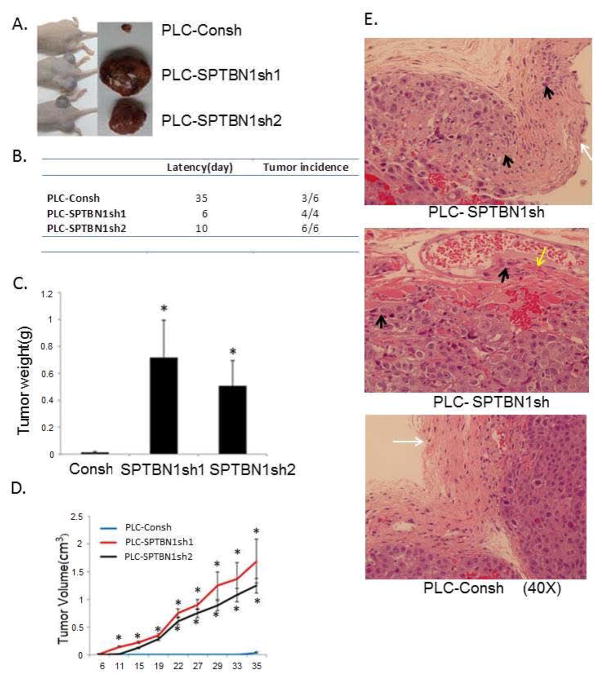
To substantiate the role of SPTBN1 in regulating HCC growth and invasion in vivo, PLC/PRF/5 cells with or without SPTBN1 knockdown were inoculated into the flanks of nude mice by subcutaneous injection. As shown in Figure 4A–D, every inoculation containing SPTBN1 knockdown cells developed into a rapidly growing tumor within 6–10 days and continued to grow. Only half of the inoculations containing cells with unaltered SPTBN1 expression developed tumors at 35 days, and these tumors were small and grew slowly. Knockdown of SPTBN1 also promotes tumor invasion in vivo, as demonstrated by the invasion of cancer cells into the capsule or muscle layer of the tumor (Figure 4E). Tumors that developed from cells with normal SPTBN1 expression retained intact capsules. These findings confirm the invasive properties of SPTBN1 knockdown HCC cells.
Figure 4.
Loss of SPTBN1 promotes tumor formation and invasion of HCC cells in vivo. A. Comparison of the gross morphology of the HCC tumors developed in nude mice injected with PLC/PRF/5 cells with and without stable knock down of SPTBN1. Two PLC/PRF/5 cell clones with stable transfection of SPTBN1 shRNA were used for the in vivo experiments. B. Latency of tumor development and the number of tumor growing in nude mice injected with PLC/PRF/5 cells with and without stable knock down of SPTBN1 gene. C and D. Comparison of tumor weight at time of sacrifice (C) and tumor volume by serial measurement (D) of the tumors derived from mice implanted with PLC/PRF/5 cells with and without stable knock down of SPTBN1 gene. n=6,*P<0.001 compared with control group. E. Hematoxylin and eosin stain of tumor tissues collected from tumor bearing nude mice. The pictures were taking at magnification of 40×. Black arrows point to tumor cells invaded into capsule or muscle. White arrow points to the capsule, yellow arrow points to muscle.
Loss of SPTBN1 promotes β-Catenin dephosphorylation and nuclear localization
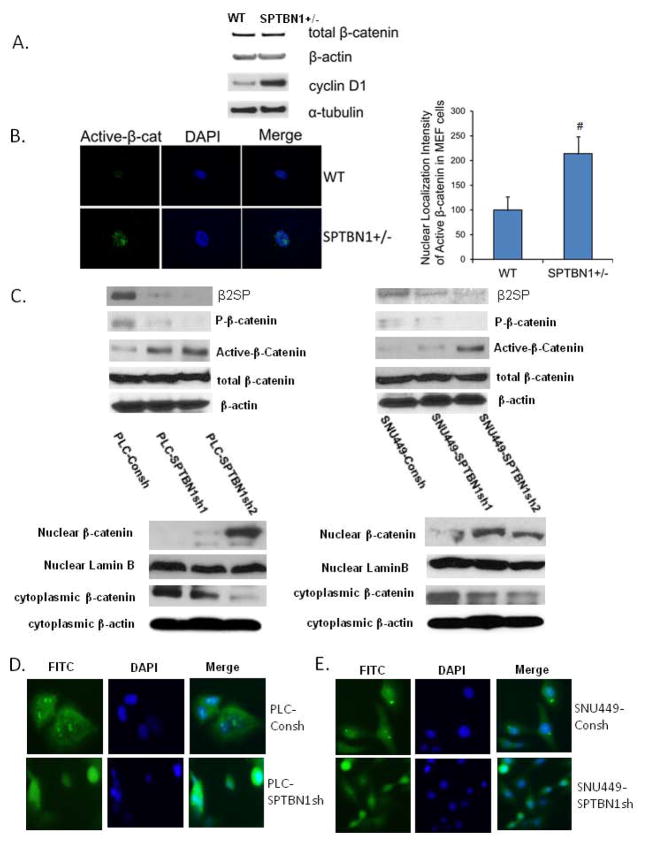
Loss of SPTBN1 promotes HCC stem cell-like traits, tumorigenesis and invasiveness, and EpCAM, Oct-4, E-cadherin, and c-Myc are all downstream of Wnt/β-catenin signaling (24). We hypothesized that loss of SPTBN1 may regulate the Wnt/β-catenin pathway. As shown in the upper panel of Figure 5C and D, while loss of SPTBN1 did not affect total β-catenin levels it did increase the levels of dephosphorylated β-catenin (the active form) in PLC/PRF/5 and SNU449. The lower panels of Figures 5C show that loss of SPTBN1 also increases β-catenin in nuclear extracts of PLC/PRF/5 and SNU449. Nuclear localization of β-catenin was also assessed by IHC. Our data suggest that loss of SPTBN1 promotes β-catenin nuclear localization, as shown in Figure 5D and E. To confirm this relationship, we examined localization of activated β-catenin in MEFs derived from SPTBN1+/− mice (Figure 5A, B). As was the case with the HCC cells, decreased SPTBN1 markedly increased levels of activated β-catenin in the nucleus without changing total β-catenin levels. Taken together these data indicate that loss of SPTBN1 activates Wnt signaling.
Figure 5.
Loss of SPTBN1 promotes β-catenin dephophorylation and nuclear localization. A. Western blot analysis from SPTBN1+/− MEF cells using antibodies against β-catenin and its downstream gene cyclin D1. B. localization and quantification of activated β-catenin in SPTBN1+/− MEF cells. Left pictures: Image was captured using a 60× oil lens on the Olympus FV 300 confocal microscope. Decreased SPTBN1 markedly increased levels of activated β-catenin in the nucleus without changing total β-catenin levels in MEF cells. Right column: Nuclear localization intensity measurement. Metamorph Image analysis software version 7.0 was used for the confocal image quantification. Average intensity was calculated from integrated intensity and area for each selected area. C. upper panel: Comparison of the levels of phosphorylated β-catenin and dephosphorylated β-catenin (active-β-catenin) and total β-catenin in PLC/PRF/5 (left panel) and SNU449 (right panel) cells with and without stable knock down of SPTBN1 gene. Loss of SPTBN1 has no effect on β-catenin expression but decreases β-catenin phosphorylation and increases active β-catenin levels in PLC/PRF/5 and SNU449 cells. lower panel: Comparison of the level of β-catenin in nuclear protein extracts isolated from PLC/PRF/5 cells (left panel) or SNU449 cells (right panel) with and without stable knock down of SPTBN1 gene. Loss of SPTBN1 increases nuclear β-catenin level in nuclear extracts of PLC/PRF/5 and SNU449 cells. D and E. Immunofluorescence staining of β-catenin in PLC/PRF/5 (D) and SNU449 (E) cells with and without stable knockdown of SPTBN1 gene. Loss of SPTBN1 promotes β-catenin nuclear localization.
Loss of SPTBN1 activates Wnt signaling via downregulation of the Wnt inhibitor Kallistatin
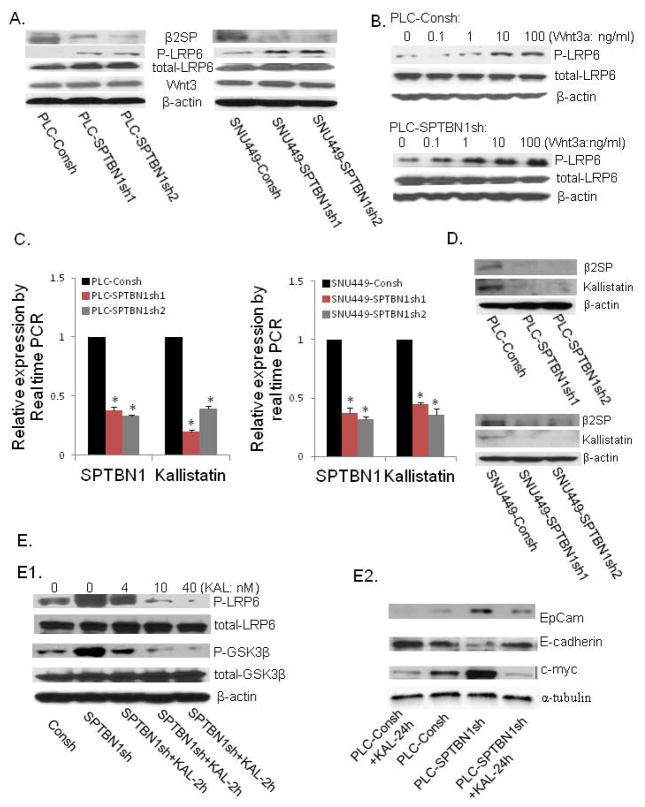
As shown in Figure 6A, although decreased SPTBN1 causes an increase in LRP6 phosphorylation, indicating the activation of Wnt signaling, there is no increase in Wnt ligand (Wnt3) and receptor (LRP6). Then we questioned whether loss of SPTBN1 sensitizes HCC cells to Wnt ligand induced Wnt activation. We treated HCC cells with different concentrations of Wnt3a and measured the level of LRP6 phosphorylation and found that SPTBN1-deficient HCC cells were more sensitive to Wnt3a than control cells (Figure 6B)
Figure 6.
A. Decreasing SPTBN1 expression increased LRP6 phosphorylation and had no effect on the expression of Wnt ligand (Wnt3) and the total level of β-catenin in PLC/PRF/5 (left panel) and SNU449 (right panel) cells. B. Loss of SPTBN1 enhanced sensitivity of LRP6 to a lower concentration of Wnt ligand. While pretreatment with 1ng/ml of Wnt3a for 2h activated the Wnt pathway in PLC- SPTBN1sh cells (lower panel), 10ng/ml of Wnt3a was needed to activate this pathway in PLC-Consh cells (upper panel). C and D. Loss of SPTBN1 decreased the mRNA and protein levels of Kallistatin in PLC/PRF/5 and SNU449 cell lines. *P<0.01 compared with control group. E. The effect of kallistatin on Wnt signal. E1. Decreasing SPTBN1 expression activated Wnt signaling with increased phosphorylation of LRP6 and GSK3β, while pretreated with kallistatin for 2 hours reversed this effect in dose dependent manner (0, 4, 10, 40nM respectively). E2. Pretreatment with Kallistatin (40nM) for 24 hours decrease the level of EpCAM, c-myc, and increase the level E-cadherin (lane 1 is compared to lane 2); Pretreatment with Kallistatin (40nM) for 24 hours can reverse the upregulation of EpCAM, c-myc; and downregulation of E-cadherin resulted from SPTBN1 inhibition (lane 4 is compared to lane 3). KAL=kallistatin.
Kallistatin, a recently identified Wnt inhibitor that interacts with LRP6, is expressed primarily in the liver (25). Kallistatin expression is markedly decreased after loss of SPTBN1 in PLC/PRF/5 and SNU449 cells (Figure 6C and D). Consistent with a role for Kallistatin in mediating the effects of SPTBN1, Wnt activation induced by loss of SPTBN1 was inhibited when cells were treated for 2h with Kallistatin (Fig. 6E1) Pretreatment of PLC-Consh control cells with Kallistatin (40nM) for 24 hours resulted in decreased expression of EpCAM and c-myc, and increased expression of E-cadherin (Fig 6E2). Treatment of SPTBN1 knockdown PLC/PRF/5 cells with Kallistatin (40nM) for 24 hours can salvage at least partly the effect of SPTBN1 loss by decreasing the level of EpCAM and c-myc, and increasing the level E-cadherin (Fig 6E2). These data further support a role for Kallistatin in mediating SPTBN1 induced inhibition of Wnt signaling.
Rescue of the SPTBN1 knockdown phenotype in HCCs by exogenous SPTBN1 or Kallistatin
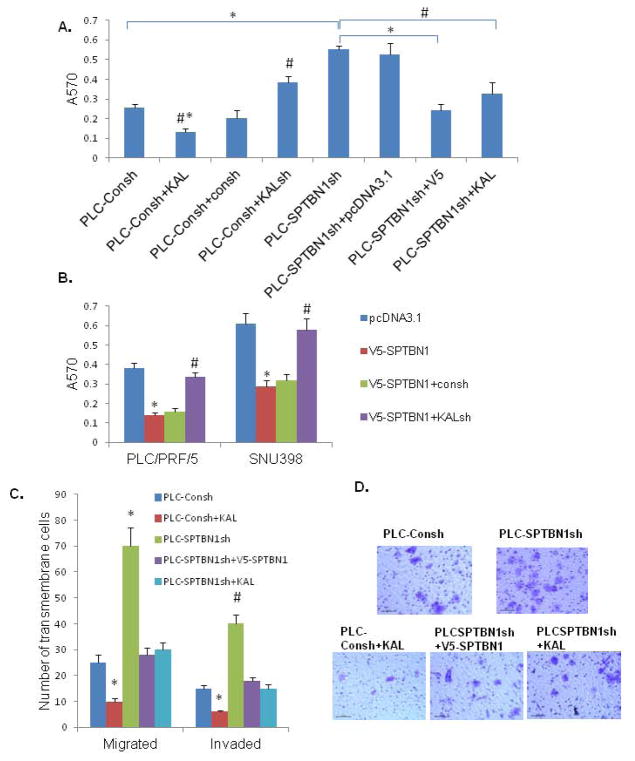
To fully demonstrate the roles of SPTBN1 and Kallistatin in achieving aggressive HCC phenotype, we tested the adhesion, migration and invasion of HCC cells when SPTBN1/or kallistatin is increased or decreased. We found the aggressive HCC phenotype induced by loss of SPTBN1 is reversed with exogenous SPTBN1 or Kallistatin (Fig 7A, C and D). On the other hand, exogenous expression of SPTBN1 inhibits the aggressive phenotype of HCC cells, which is reversed by knock-down of endogenous Kallistatin (Fig 7B).
Figure 7.
Loss of SPTBN1 promotes malignant behaviors of HCC cell lines, which can be reversed by induction of Kallistatin or SPTBN1. A. As shown in PLC/PRF/5 HCC cells, pretreated with Kallistatin decreases the adhesion capacity of HCC cell (#P<0.05 when bar 2 compared with bar1 and bar3,* P<0.01 when bar 2 compared with bar 4–8); Knock-down Kallistatin increases the adhesion capacity of HCC cells (#P<0.05 when bar 4 compared with bar 3 and bar1). Knock-down SPTBN1 increases the adhesion capacity of HCC cells (*P<0.01, bar 5 compared with bar 1), that is reversed by over-expression of SPTBN1 (*P<0.01, bar 7 compared with bar 5) or pretreated with Kallistatin (#P<0.05 bar 8 compared with bar 5). B. As demonstrated in two HCC cell lines, PLC/PRF5 and SNU398, the adhesion capacity of HCC cells is inhibited by over-expression of SPTBN1 (*P<0.01, V5-SPTBN1 compared with pcDNA3.1 group), which is reversed by knocking-down Kallistatin gene (#P<0.05 when KALsh compared with Consh). C. As demonstrated in PLC/PRF/5 cells, HCC cells with decreased SPTBN1 migrate and invade two to three times as much as control cells (*P<0.01, #P<0.05 when SPTBN1sh compared with Consh), which can be reversed by over-expression of SPTBN1 or pretreated with Kallistatin (*P<0.01, #P<0.05 when SPTBN1sh compared with V5-SPTBN1 and KAL group respectively). Kallistatin inhibited malignant behaviors of PLC-Consh cells (*P<0.01 when bar2 compared to other group). D. Representative image of cells in the migration assay stained with 0.5% crystal violet.
Correlation analysis of SPTBN1, E-cadherin and Kallistatin gene expression, and recurrence-free survival using human gene array databases
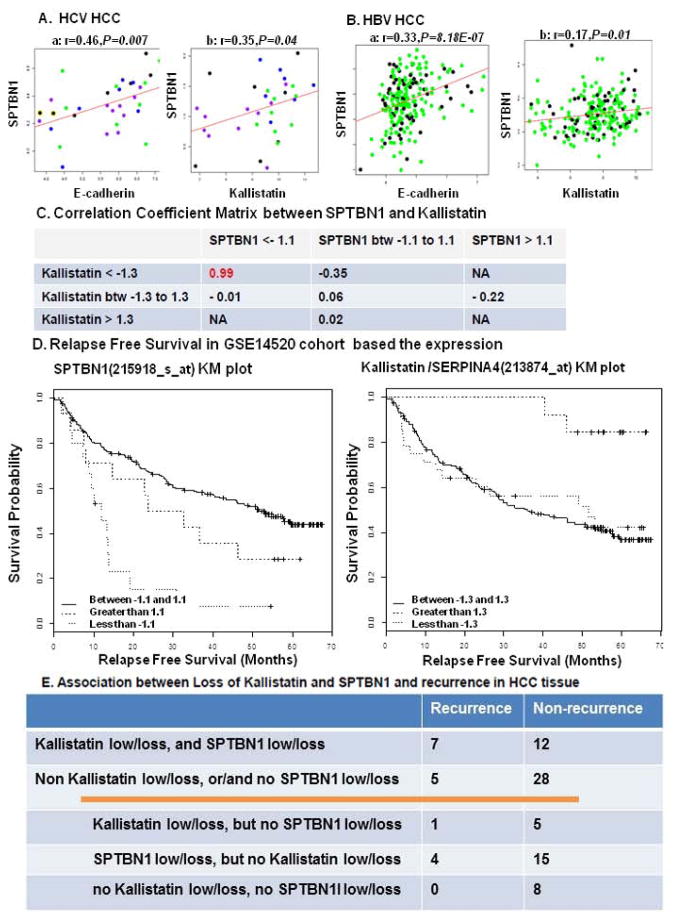
We then studied the clinical relevance of SPTBN1 and Kallistatin expression. SPTBN1 gene expression is positively and significantly correlated with E-cadherin and kallistatin gene expression in both HCV induced HCC (Fig 8A–a and b, Gene Expression Omnibus GSE6764) and HBV induced HCC (Fig. 8B–a and b, Gene Expression Omnibus GSE14520). We then found a strong association between the decreased levels of SPTBN1 (< −1.1) and SERPINA4 (the gene that encodes Kallistatin) (< −1.3) genes (Correlation Coefficient = 0.99, Figure 8C). The cohorts of patients with decreased level of e SPTBN1 (< −1.1) or SERPINA4 (the gene that encodes Kallistatin) (< −1.3) genes are significantly correlated with decreased relapse free survival (p <0.001 and 0.0193 respectively (Figure 8D).
Figure 8.
The correlation of SPTBN1, E-cadherin and kallistatin was analyzed using published human gene array databases. A. GSE6764 correlation analysis was done on all 33 tumor samples from the Wurmbach study, including very early, early, advanced and very advanced HCC, which are shown as blue, green, black, and purple in the dot graph, respectively. B. GSE14520 study was done on 156 tumor samples with chronic carrier (CC) Hep B status and 56 tumor samples with active viral replication chronic carrier (AVR-CC) Hep B status, represented in green and black, respectively. The expression of SPTBN1 is positively and significantly correlated with E-cadherin and kallistatin in both HCV induced HCC and HBV induced HCC. “r” stands for correlation coefficient and “P” is for P value. B shows a positive correlation between decrease in kallistatin expression and decrease in SPTBN1 expression in HCC. We used the mean of the gene expression value as a reference to calculate fold change for each sample. We then separated the patients into sub-groups (low, medium and high expression) based on various-fold change cut offs ranging from a minimum-fold change value of 1 to maximum of 2. C and D demonstrate that loss of kallistatin or SPTBN1 suggests a decreased relapse free Survival (curve less than −1.3 in comparison to curve greater than 1.3 for kallistatin, curve less than −1.1 in comparison to curve 1.1 to −1.1 for SPTBN1). E shows the relationship between case number of recurrence and loss of SPTBN1 and Kallistatin protein evaluated by IHC stain in HCC patients after curative cancer resection.
Association between loss of Kallistatin and SPTBN1 from HCC tissues and recurrence of HCC
Fifty-two patients had their HCC resected and the carcinoma recurred in 12 of these patients during the first five years following surgery. As shown in the contingency table, tissue from 19 cases indicated loss of Kallistatin and SPTBN1, and 7 of these 19 patients demonstrated cancer recurrence, while 12 patients did not. Thirty-three cases did not show loss of both Kallistatin and SPTBN1 protein together, and among these patients, 5 experienced tumor recurrence, while 28 did not. Of the same 33 cases, 6 showed loss of Kallistatin but no loss of SPTBN1; one of these 6 patients experienced recurrence. Nineteen cases showed loss of SPTBN1 but no loss of Kallistatin and 4 of these 19 patients experienced recurrence. The remaining 8 patient cases showed no loss of SPTBN1 or Kallistatin and none of these patients experienced recurrence. From the Chi-square test, the p-value for the difference in recurrence rate between the two patient-cohorts was 0.07, which is not significant, but the trend suggests a possible association between the loss of Kallistatin and SPTBN1 protein in primary HCC tumors and their recurrence.
Discussion
Recently, SPTBN1 has emerged as a potent regulator of tumorigenesis. We have reported that mice haploinsufficient for SPTBN1 (SPTBN1+/−) spontaneously develop HCC (18). Most cases of human HCC, gastric cancer, and lung cancer have low levels of SPTBN1 expression (20). While these studies point to SPTBN1 as a tumor suppressor, it is unclear how the loss of SPTBN1 protein in HCC tumors affects HCC development.
Tumorigenesis could possibly arise via an expansion and transformation of a pre-existing stem cell population within an organ. Transplantation of freshly isolated EpCAM+ cells from either fetal or postnatal livers into livers of NOD/SCID mice results in the formation of human liver tissue (28). Increased number of EpCAM(+) cells is found in injured liver, suggesting the expansion of stem cell population in liver under chronic damage (26). EpCAM+ HCC cells, but not EpCAM− HCC cells, can efficiently initiate invasive tumors in NOD/SCID mice (27). By sorting EpCAM+ cells from SPTBN1+/− and WT mice, we found that the number of EpCAM+ cells doubled in SPTBN1+/− mouse liver. Real time PCR and western blotting also demonstrated increased EpCAM expression in SPTBN1+/− mouse liver. We therefore hypothesized that loss of SPTBN1 results in the acquisition of stem cell features that may contribute to the development of HCC in SPTBN1+/− mice. We then tested this hypothesis in human HCC.
Using HCC cell lines PLC/PRF/5 and SNU449, we examined the role of SPTBN1 in human HCC development. Our results suggest that loss of SPTBN1 has the potential to increase the expression of cancer stem cell markers EpCAM, Claudin-7, and Oct-4 and significantly enhance tumor sphere formation. These findings support the stem cell-like properties of SPTBN1 knockdown HCC cell lines. Additionally, SPTBN1 suppression promotes adhesion, migration, and invasion of PLC/PRF/5 and SNU449 cells, features that are critical for malignancy, which can be rescued by exogenous expression of SPTBN1. On the other hand, inhibition of the HCC phenotype by exogenous expression of SPTBN1 is lost if the level of SPTBN1 is suppressed, as shown in both PLC/PRF/5 and SNU398 HCC cell lines. The capacity of these cells, which lack endogenous SPTBN1, to become invasive is supported by our in vivo xenograft model, which demonstrated that loss of SPTBN1 promotes tumor growth and invasion of surrounding tissues.
EMT, a process by which epithelial cells lose their polarity and acquire a migratory mesenchymal phenotype, is a crucial process in the induction of tumor invasion and metastasis. The loss of E-cadherin expression associated with this phenotype is a fundamental event in EMT and a crucial step in the progression of papilloma to invasive carcinoma (29). Other commonly used molecular markers for EMT include increased expression of N-cadherin and vimentin and production of the transcription factors Snail1/2, Twist, and/or EF1/ZEB1, which inhibit E-cadherin production (30). Our results show that loss of SPTBN1 in PLC/PRF/5 and SNU449 decreases E-cadherin expression and increases vimentin levels as well as levels of the β-catenin target gene c-Myc. In mice, disruption of SPTBN1 and SMAD4 gene expression leads to gastrointestinal tumors that display an aberrant E-cadherin and β-catenin interaction (31). These data support a role for SPTBN1 as a tumor suppressor, at least partly via the suppression of EMT.
EpCAM, E-cadherin and c-Myc are target genes of Wnt/β-catenin signaling, which indirectly suggests an influence of SPTBN1 on this pathway (32). The canonical Wnt pathway, known to be a critical regulator of self-renewal in stem cells, is also constitutively activated and implicated in the induction of EMT in cancer (33). The Wnt/β-catenin pathway is dysregulated in 30–40% of human HCC and in more than 80% of hepatoblastomas (34). The binding of Wnt family proteins (such as Wnt1, Wnt3 and Wnt3a) to the Frizzled (Fz) family of receptors and to LRP5 or LRP6 co-receptors inhibits proteolytic degradation of β-catenin, causing nuclear accumulation of β-catenin followed by abnormal cell proliferation and tumorigenesis (12). In contrast, Wnt pathway activity is inhibited by a wide range of molecules including the secreted antagonists of Wnt such as Fz-related proteins (FRPs), Cerberus, Wnt inhibitory factor (WIF) and Dickkopf (Dkk) (35). Kallistatin, a plasma protein of the serine proteinase inhibitor family that exerts pleiotropic effects to inhibit angiogenesis, inflammation, and tumor growth, was recently identified as a unique inhibitor of the Wnt pathway (36). Kallistatin is highly expressed in liver, and antagonizes Wnt/β-catenin signaling and cancer cell motility via binding to low-density lipoprotein receptor-related protein 6 (LRP6) (37).
We also found that while loss of SPTBN1 did not regulate Wnt ligand expression, it did increase activation of β-catenin and its nuclear translocation, and subsequent activation of the Wnt/β-catenin pathway. Mechanistically, loss of SPTBN1 enhanced the sensitivity of LRP6 to a lower concentration of Wnt ligand, suggesting that loss of SPTBN1-induced Wnt activation occurs by reducing the expression of a Wnt inhibitor. Our data show that loss of SPTBN1 dramatically decreased Kallistatin expression in both SNU449 and PLC/PRF/5 cells. Moreover, Kallistatin can rescue the effect of SPTBN1 inhibition by inhibiting Wnt activation and reversing expression of the Wnt targeted genes E-cadherin, EpCAM and c-myc, as well as the aggressive HCC phenotype. Furthermore, suppression of the aggressive HCC phenotype by exogenous SPTBN1 is lost when Kallistatin is inhibited. Taken together, our data suggest that loss of SPTBN1 promotes Wnt signaling activation by downregulating Kallistatin. The data suggest a role for Kallistatin as a therapeutic target in HCC that display decreased levels of SPTBN1. To further illustrate the influence of SPTBN1 on the Wnt related genes in human HCC, we also analyzed the correlation of SPTBN1, E-cadherin and Kallistatin gene expression in HCC with clinical outcomes using published human HCC array data. The expression of SPTBN1 is significantly and positively correlated with E-cadherin and Kallistatin in both HCV-and HBV-induced HCC, which is consistent with the effect of SPTBN1 on HCC cell lines. Interestingly, we observed an association between loss of Kallistatin and loss of SPTBN1. More importantly, loss of SPTBN1 and Kallistatin is associated with shorter relapse-free survival compared to patients without loss of SPTBN1 and Kallistatin. Furthermore, IHC analysis of SPTBN1 and Kallistatin protein levels in HCC samples from patients who underwent curative HCC resections show that loss of SPTBN1 and Kallistatin protein associates with higher recurrence rate. Biomarkers detected by IHC staining of paraffin slides of tumor tissue is commonly used in clinical pathology practice for the purpose of cancer diagnosis and anti-cancer therapy selection. Our data warrant further study of Kallisatin and SPTBN1 as biomarkers thatcan predict HCC recurrence.
In conclusion, this study provides evidence that loss of SPTBN1 in HCC activates Wnt signaling, which regulates downstream genes important for development of the stem cell phenotype. Reduced expression of Kallistatin, a Wnt signaling inhibitor, in HCC, may also play a role in the activation of Wnt signaling. Our data suggest that SPTBN1 may be used as biomarker to predict pharmacologic responses to Wnt/β-catenin signaling antagonists, and warrants further study of Kallistatin as a therapeutic target and biomarker for HCC recurrence after curative cancer resection.
Supplementary Material
Acknowledgments
Financial Support
This work was supported by ACS grant 118525-MRSG-10-068-01-TBE (ARH), NIH grants 5R01CA129813 (SWB), 1P01CA130821 (SWB), Shanghai Natural Science Foundation No. 14ZR1401500. The experiments were carried out with the help of Share Resource including histopathology, microscopy and imaging, genomics and epigenomics and flow cytometry, which was supported by NIH-P30 CA51008 and by NCATS 8 UL1 TR000101.
We would like to thank Marion L. Hartley, PhD, for editing this paper. We would like to thank China Scholarship Council (CSC)-Georgetown University Post-doc Fellowship Program for providing the support.
List of Abbreviations
- HCC
hepatocellular carcinoma
- CSCs
cancer stem cells
- EpCAM
epithelial cell adhesion molecule
- MEFs
mouse embryonic fibroblasts
- IHC
Immunohistochemistry
- FACS
Fluorescence-activated cell sorting
- PE
phycoerythrin
- G-DOC
Georgetown Database of Cancer
- EMT
Epithelial-mesenchymal transition
- LRP5
low- density lipoprotein receptor-related protein 5
- SPTBN1+/−
haploinsufficient in SPTBN1
- Fz
Frizzled
- FRPs
Fz-related proteins
- WIF
Wnt inhibitory factor
- Dkk
Dickkopf
- CC
chronic carrier
- AVR CC
active viral replication chronic carrier
Contributor Information
Xiuling Zhi, Email: zhixiuling@fudan.edu.cn.
Ling Lin, Email: ll285@georgetown.edu.
Shaoxian Yang, Email: yangshaoxian@hotmail.com.
Krithika Bhuvaneshwar, Email: kb472@georgetown.edu.
Hongkun Wang, Email: Hongkun.Wang@georgetown.edu.
Yuriy Gusev, Email: yugusev.gu@gmail.com.
Mi-Hye Lee, Email: ml663@georgetown.edu.
Bhaskar Kallakury, Email: KALLAKUB@gunet.georgetown.edu.
Narayan Shivapurkar, Email: nms35@georgetown.edu.
Katherine Cahn, Email: klc54@georgetown.edu.
Xuefei Tian, Email: xz243@georgetown.edu.
John L. Marshall, Email: marshalj@georgetown.edu.
Stephen W. Byers, Email: byerss@georgetown.edu.
Aiwu R. He, Email: arh29@georgetown.edu.
References
- 1.Lozano R, Naghavi M, Foreman K, Lim S, Shibuya K, Aboyans V, Abraham J, et al. Global and regional mortality from 235 causes of death for 20 age groups in 1990 and 2010: a systematic analysis for the Global Burden of Disease Study 2010. Lancet. 2012;380:2095–2128. doi: 10.1016/S0140-6736(12)61728-0. [DOI] [PMC free article] [PubMed] [Google Scholar]
- 2.American CS. Cancer Facts & Figures 2013. 2013. [Google Scholar]
- 3.Thomas MB, Zhu AX. Hepatocellular carcinoma: the need for progress. J Clin Oncol. 2005;23:2892–2899. doi: 10.1200/JCO.2005.03.196. [DOI] [PubMed] [Google Scholar]
- 4.Kong D, Li Y, Wang Z, Sarkar FH. Cancer Stem Cells and Epithelial-to-Mesenchymal Transition (EMT)-Phenotypic Cells: Are They Cousins or Twins? Cancers (Basel) 2011;3:716–729. doi: 10.3390/cancers30100716. [DOI] [PMC free article] [PubMed] [Google Scholar]
- 5.Fuxe J, Vincent T, Garcia DHA. Transcriptional crosstalk between TGF-beta and stem cell pathways in tumor cell invasion: role of EMT promoting Smad complexes. Cell Cycle. 2010;9:2363–2374. doi: 10.4161/cc.9.12.12050. [DOI] [PubMed] [Google Scholar]
- 6.Scheel C, Eaton EN, Li SH, Chaffer CL, Reinhardt F, Kah KJ, Bell G, et al. Paracrine and autocrine signals induce and maintain mesenchymal and stem cell states in the breast. Cell. 2011;145:926–940. doi: 10.1016/j.cell.2011.04.029. [DOI] [PMC free article] [PubMed] [Google Scholar]
- 7.Espinoza I, Pochampally R, Xing F, Watabe K, Miele L. Notch signaling: targeting cancer stem cells and epithelial-to-mesenchymal transition. Onco Targets Ther. 2013;6:1249–1259. doi: 10.2147/OTT.S36162. [DOI] [PMC free article] [PubMed] [Google Scholar]
- 8.Merchant AA, Matsui W. Targeting Hedgehog--a cancer stem cell pathway. Clin Cancer Res. 2010;16:3130–3140. doi: 10.1158/1078-0432.CCR-09-2846. [DOI] [PMC free article] [PubMed] [Google Scholar]
- 9.Xia H, Cheung WK, Ng SS, Jiang X, Jiang S, Sze J, Leung GK, et al. Loss of brain-enriched miR-124 microRNA enhances stem-like traits and invasiveness of glioma cells. J Biol Chem. 2012;287:9962–9971. doi: 10.1074/jbc.M111.332627. [DOI] [PMC free article] [PubMed] [Google Scholar]
- 10.Kong D, Li Y, Wang Z, Sarkar FH. Cancer Stem Cells and Epithelial-to-Mesenchymal Transition (EMT)-Phenotypic Cells: Are They Cousins or Twins? Cancers (Basel) 2011;3:716–729. doi: 10.3390/cancers30100716. [DOI] [PMC free article] [PubMed] [Google Scholar]
- 11.Mani SA, Guo W, Liao MJ, Eaton EN, Ayyanan A, Zhou AY, Brooks M, et al. The epithelial-mesenchymal transition generates cells with properties of stem cells. Cell. 2008;133:704–715. doi: 10.1016/j.cell.2008.03.027. [DOI] [PMC free article] [PubMed] [Google Scholar]
- 12.Angers S, Moon RT. Proximal events in Wnt signal transduction. Nat Rev Mol Cell Biol. 2009;10:468–477. doi: 10.1038/nrm2717. [DOI] [PubMed] [Google Scholar]
- 13.Yuzugullu H, Benhaj K, Ozturk N, Senturk S, Celik E, Toylu A, Tasdemir N, et al. Canonical Wnt signaling is antagonized by noncanonical Wnt5a in hepatocellular carcinoma cells. Mol Cancer. 2009;8:90. doi: 10.1186/1476-4598-8-90. [DOI] [PMC free article] [PubMed] [Google Scholar]
- 14.Tang Y, Katuri V, Dillner A, Mishra B, Deng CX, Mishra L. Disruption of transforming growth factor-beta signaling in ELF beta-spectrin-deficient mice. Science. 2003;299:574–577. doi: 10.1126/science.1075994. [DOI] [PubMed] [Google Scholar]
- 15.Thenappan A, Shukla V, Abdul KF, Li Y, Shetty K, Liu P, Li L, et al. Loss of transforming growth factor beta adaptor protein beta-2 spectrin leads to delayed liver regeneration in mice. Hepatology. 2011;53:1641–1650. doi: 10.1002/hep.24111. [DOI] [PMC free article] [PubMed] [Google Scholar]
- 16.Patel-Hett S, Wang H, Begonja AJ, Thon JN, Alden EC, Wandersee NJ, An X, et al. The spectrin-based membrane skeleton stabilizes mouse megakaryocyte membrane systems and is essential for proplatelet and platelet formation. Blood. 2011;118:1641–1652. doi: 10.1182/blood-2011-01-330688. [DOI] [PMC free article] [PubMed] [Google Scholar]
- 17.Lim JA, Baek HJ, Jang MS, Choi EK, Lee YM, Lee SJ, Lim SC, et al. Loss of beta2-spectrin prevents cardiomyocyte differentiation and heart development. Cardiovasc Res. 2013 doi: 10.1093/cvr/cvt222. [DOI] [PMC free article] [PubMed] [Google Scholar]
- 18.Kitisin K, Ganesan N, Tang Y, Jogunoori W, Volpe EA, Kim SS, Katuri V, et al. Disruption of transforming growth factor-beta signaling through beta-spectrin ELF leads to hepatocellular cancer through cyclin D1 activation. Oncogene. 2007;26:7103–7110. doi: 10.1038/sj.onc.1210513. [DOI] [PMC free article] [PubMed] [Google Scholar]
- 19.Thenappan A, Li Y, Kitisin K, Rashid A, Shetty K, Johnson L, Mishra L. Role of transforming growth factor beta signaling and expansion of progenitor cells in regenerating liver. Hepatology. 2010;51:1373–1382. doi: 10.1002/hep.23449. [DOI] [PMC free article] [PubMed] [Google Scholar]
- 20.Baek HJ, Kim SS, Da SF, Volpe EA, Evans S, Mishra B, Mishra L, et al. Inactivation of TGF-beta signaling in lung cancer results in increased CDK4 activity that can be rescued by ELF. Biochem Biophys Res Commun. 2006;346:1150–1157. doi: 10.1016/j.bbrc.2006.05.195. [DOI] [PubMed] [Google Scholar]
- 21.Seglen PO. Preparation of isolated rat liver cells. Methods Cell Biol. 1976;13:29–83. doi: 10.1016/s0091-679x(08)61797-5. [DOI] [PubMed] [Google Scholar]
- 22.Wurmbach E, Chen YB, Khitrov G, Zhang W, Roayaie S, Schwartz M, Fiel I, et al. Genome-wide molecular profiles of HCV-induced dysplasia and hepatocellular carcinoma. Hepatology. 2007;45:938–947. doi: 10.1002/hep.21622. [DOI] [PubMed] [Google Scholar]
- 23.Madhavan S, Gusev Y, Harris M, Tanenbaum DM, Gauba R, Bhuvaneshwar K, Shinohara A, et al. G-DOC: a systems medicine platform for personalized oncology. Neoplasia. 2011;13:771–783. doi: 10.1593/neo.11806. [DOI] [PMC free article] [PubMed] [Google Scholar]
- 24.Yamashita T, Budhu A, Forgues M, Wang XW. Activation of hepatic stem cell marker EpCAM by Wnt-beta-catenin signaling in hepatocellular carcinoma. Cancer Res. 2007;67:10831–10839. doi: 10.1158/0008-5472.CAN-07-0908. [DOI] [PubMed] [Google Scholar]
- 25.Chao J, Tillman DM, Wang MY, Margolius HS, Chao L. Identification of a new tissue-kallikrein-binding protein. Biochem J. 1986;239:325–331. doi: 10.1042/bj2390325. [DOI] [PMC free article] [PubMed] [Google Scholar]
- 26.Okabe M, Tsukahara Y, Tanaka M, Suzuki K, Saito S, Kamiya Y, Tsujimura T, et al. Potential hepatic stem cells reside in EpCAM+ cells of normal and injured mouse liver. Development. 2009;136:1951–1960. doi: 10.1242/dev.031369. [DOI] [PubMed] [Google Scholar]
- 27.Yamashita T, Ji J, Budhu A, Forgues M, Yang W, Wang HY, Jia H, et al. EpCAM-positive hepatocellular carcinoma cells are tumor-initiating cells with stem/progenitor cell features. Gastroenterology. 2009;136:1012–1024. doi: 10.1053/j.gastro.2008.12.004. [DOI] [PMC free article] [PubMed] [Google Scholar]
- 28.Schmelzer E, Zhang L, Bruce A, Wauthier E, Ludlow J, Yao HL, Moss N, et al. Human hepatic stem cells from fetal and postnatal donors. J Exp Med. 2007;204:1973–1987. doi: 10.1084/jem.20061603. [DOI] [PMC free article] [PubMed] [Google Scholar]
- 29.Thiery JP, Acloque H, Huang RY, Nieto MA. Epithelial-mesenchymal transitions in development and disease. Cell. 2009;139:871–890. doi: 10.1016/j.cell.2009.11.007. [DOI] [PubMed] [Google Scholar]
- 30.Lee JM, Dedhar S, Kalluri R, Thompson EW. The epithelial-mesenchymal transition: new insights in signaling, development, and disease. J Cell Biol. 2006;172:973–981. doi: 10.1083/jcb.200601018. [DOI] [PMC free article] [PubMed] [Google Scholar]
- 31.Katuri V, Tang Y, Li C, Jogunoori W, Deng CX, Rashid A, Sidawy AN, et al. Critical interactions between TGF-beta signaling/ELF, and E-cadherin/beta-catenin mediated tumor suppression. Oncogene. 2006;25:1871–1886. doi: 10.1038/sj.onc.1209211. [DOI] [PMC free article] [PubMed] [Google Scholar]
- 32.Yamashita T, Budhu A, Forgues M, Wang XW. Activation of hepatic stem cell marker EpCAM by Wnt-beta-catenin signaling in hepatocellular carcinoma. Cancer Res. 2007;67:10831–10839. doi: 10.1158/0008-5472.CAN-07-0908. [DOI] [PubMed] [Google Scholar]
- 33.Reya T, Clevers H. Wnt signalling in stem cells and cancer. Nature. 2005;434:843–850. doi: 10.1038/nature03319. [DOI] [PubMed] [Google Scholar]
- 34.Buendia MA. Genetics of hepatocellular carcinoma. Semin Cancer Biol. 2000;10:185–200. doi: 10.1006/scbi.2000.0319. [DOI] [PubMed] [Google Scholar]
- 35.Bafico A, Liu G, Yaniv A, Gazit A, Aaronson SA. Novel mechanism of Wnt signalling inhibition mediated by Dickkopf-1 interaction with LRP6/Arrow. Nat Cell Biol. 2001;3:683–686. doi: 10.1038/35083081. [DOI] [PubMed] [Google Scholar]
- 36.Zhang B, Abreu JG, Zhou K, Chen Y, Hu Y, Zhou T, He X, et al. Blocking the Wnt pathway, a unifying mechanism for an angiogenic inhibitor in the serine proteinase inhibitor family. Proc Natl Acad Sci U S A. 2010;107:6900–6905. doi: 10.1073/pnas.0906764107. [DOI] [PMC free article] [PubMed] [Google Scholar]
- 37.Zhang J, Yang Z, Li P, Bledsoe G, Chao L, Chao J. Kallistatin antagonizes Wnt/beta-catenin signaling and cancer cell motility via binding to low-density lipoprotein receptor-related protein 6. Mol Cell Biochem. 2013;379:295–301. doi: 10.1007/s11010-013-1654-2. [DOI] [PMC free article] [PubMed] [Google Scholar]
Associated Data
This section collects any data citations, data availability statements, or supplementary materials included in this article.


