Abstract
Objective(s):
To clarify the protective effects of Cichorium glandulosum (CG) extracts on thioacetamide (TAA)-induced rat hepatic fibrosis.
Materials and Methods:
The dry roots of CG were smashed and percolated with 95% ethanol, and the residual was prepared into petroleum ether extract (CG-V), ethyl acetate extract (CG-VI) and n-butyl alcohol extract (CG-VII). Thirty-six Wistar rats were randomly divided into a normal group, a model group, a CG-V group (15 mg/kg), a CG-VI group (3 mg/kg), a CG-VII group (6 mg/kg) and a positive drug group (silibinin capsule, 8 mg/kg). Organ indices and serum levels of glutamic-oxaloacetic and glutamic-pyruvic transaminases of intragastrically administered rats were obtained. Expressions of FN, Smad3, IGFBPrP1 and TGF-β1 genes were detected by Western Blot and immunohistochemical assays. Apoptosis was examined by TUNEL assay.
Results:
Hepatic fibrosis of treatment groups was evidently mitigated. Expressions of FN, Smad3 and TGF-β1 in administration groups were higher than those in normal group, and moreover were significantly higher in CG-V and CG-VII groups than those of model group. Apoptotic index of model group was significantly higher than that of normal group, but indices of CG-V and CG-VII groups were significantly lower than that of model group. Significantly more FN, Smad3 and IGFBPrP1 were expressed in treatment groups than those in normal group.
Conclusion:
CG extracts may function by altering TGF-β/Smads signal transduction pathway.
Keywords: Apoptosis, Cichorium glandulosum, Hepatic fibrosis
Introduction
Cichorium glandulosum (CG), which is a Compositae family plant, is a commonly used traditional Uighur medicine capable of cleansing liver and being cholagogue, strengthening stomach, promoting digestion, inducing diuresis and reducing edema. Therefore, CG has been applied to treat jaundice with damp-heat pathogen, stomach ache, anorexia, edema and oliguresis (1, 2). Hepatic fibrosis occurs in the midst of multiple chronic liver diseases course, which the delay or blockade of it may prevent cirrhosis (3). Triterpenoids, lactucin and lactucopicrin, etc., together with sesquiterpene lactones are primarily extracted from the roots of CG by petroleum ether, ethyl acetate, and n-butyl alcohol, respectively (4, 5). Researchers have extracted and separated the active ingredients to test their performance In vivo, in animal experiments (6, 7). The overground part of CG was extracted by 60% ethanol to considerably alleviate the pathological hepatic changes in mice who had been succumbed to acute liver injury caused by intragastrically administration of CCl4 or BCG vaccine in combination with lipopolysaccaride. Besides, the root extracts of CG could protect mice from acute liver injury induced by CCl4 and D-galactose (8, 9). This study tested the protective effects of the three extracts of CG on thioacetamide (TAA)-induced hepatic fibrosis in rats, aiming to figure out the effective extraction position and to provide scientific evidence for the future researches on active ingredients and novel drugs development.
TAA-induced hepatic fibrosis animal models must resemble human ones in the hemodynamics, morphology and biochemical metabolism aspects (10, 11), and also be similar to virus-induced cirrhosis (3). Many chronic liver diseases share the pathological process of hepatic fibrosis. Currently, hepatic fibrosis still contributes to the high incidence and morbidity rates of cirrhosis as the latter is irreversible. Thus, researchers are dedicated to find out specific treatment targets that contribute to the development of hepatic fibrosis. In this study, TAA-induced hepatic fibrosis rats were intragastrically administered with the extracts of CG to obtain the liver and spleen indices, as well as serum indicators, and to observe the pathological changes of liver tissues. The liver-protection function of CG was further confirmed by immunohistochemical and Western Blot assays.
Materials and Methods
All animal experiments were performed with the approval of the Institutional Animal Care and Use Committee of Shihezi University.
Experimental animals
Male Wistar rats weighing 300±20 g were purchased from Xinjiang Medical University Animal Center (License No: SCXK (New) 2003-0001). The rats, which were routinely fed and allowed to drink water freely, were subjected to experiments after breeding adaptation.
Drugs and reagents
CG (batch number: 201201015) was purchased from a local plantation (Hetian, Xinjiang Province) and identified by Associate Professor Peng Li in Shihezi University. The dry roots of CG (40 kg) were smashed and percolated with 95% ethanol. After evaporation of ethanol, the residual was extracted by petroleum ether (CG-V), ethyl acetate (CG-VI) and n-butyl alcohol (CG-VII) respectively, giving corresponding extracts after evaporation of the solvents.
The drugs and reagents used in this study include: TAA (analytical grade, Tianjin Guangfu Fine Chemical Research Institute), formaldehyde (HCHO, analytical grade), vegetable oil (commercially available soybean oil, COFCO Food Sales & Distribution Co, Ltd.), 0.9% NaCl normal saline, distilled water, silibinin capsule (Tianjin Tasly Pharmaceutical Co, Ltd., production batch No: 110511), sodium pentobarbital (sold by Shanghai Chemical Reagent Procurement & Supply Station and distributed by Xinhua Chemical Plant), glutamic-oxaloacetic transaminase kit (AST, production batch No: 20111224), glutamic-pyruvic transaminase kit (ALT, production batch No.: 20111223), Coomassie brilliant blue protein kit (production batch No.: 20111227) (all kits were purchased from Nanjing Jiancheng Bioengineering Institute), anti-Smad3 antibody 100 µg/tube (Abcam), anti-IGFBP7 antibody 100 µg/tube (Abcam), anti-FN 100 µg/tube (Santa Crue Biotechnology, batch No: G2511), anti-TGF-β1 100 µg/tube (Abcam), 0.45 um PVDF film (Millipore, batch No: K1HA1391LK), horseradish peroxidase-labeled goat anti-mouse IgG 0.1 ml/tube (Zhongshan Golden Bridge Biotech Co, Ltd, batch No: 101843) and horseradish peroxidase-labeled goat anti-rabbit IgG 0.1 ml/tube (Zhongshan Golden Bridge Biotech Co, Ltd, batch No: 101305).
Animal grouping and treatment
Thirty-six Wistar rats were randomly divided into a normal group, a model group, a petroleum ether extract treatment group (CG-V, 15 mg/kg), an ethyl acetate extract treatment group (CG-VI, 3 mg/kg), an n-butyl alcohol extract treatment group (CG-VII, 6 mg/kg) and a positive drug group (silibinin capsule, 8 mg/kg). Immediately after modeling, all groups except for the normal one were intraperitoneally injected with 100 mg/kg thioacetamide twice a week. The modeling was initiated in the fifth week. The normal and model groups were administered with distilled water, and the other groups were intragastrically treated with 5 ml/kg thioacetamide. The experiments were persistently performed once a day for 8 weeks. The rats were subjected to abdominal aortic blood sampling after 12 weeks, which were centrifuged to collect the plasma to be stored at -70°C prior to liver function detection. The liver, thymus and spleen were weighed, and the liver was fixed in 10% HCHO for histopathological detection.
Examination items
Calculation of organ indices
The liver and spleen were resected after laparotomy, and washed with 4°C normal saline. They were weighed to calculate the corresponding indices after absorbing excess water with paper filter. Organ index = organ mass (g) /individual body mass (g) × 100%.
Detection of biochemical indicators
The blood was collected, maintained in 37°C water bath for 1 h and centrifuged at 3,000 r/min for 15 min to separate the serum. A small piece of liver tissue in the same part of the right lobe was disconnected, rinsed with ice brine, subjected to fat and connective tissues removing, dried with absorbent paper and weighed, and thereafter transferred in a 10 ml centrifuge tube. After adding appropriate amount of cold normal saline, the solution was homogenized at 20,000 r/min for 10 sec. Then the tissue was prepared into a 10% homogenate after being repeated three times with 30 sec of intermittence. Subsequently, the resulting product was subjected to refrigerated centrifuge at 3,500 r/min and 4°C for 10 min, from which the supernatant was collected. All indicators were measured according to the kit instructions.
Histopathological examination
The liver tissue in the identical position of the right lobe was resected and fixed in 10% HCHO solution, and then subjected to regular HE and Masson staining to inspect the histopathological changes under a light microscopy. The expressions of FN, Smad3 and TGF-β1 genes in liver tissues were analyzed by immunohistochemical staining.
Western Blot
The expressions of FN, Smad3 and TGF-β1 in rat liver tissues were detected.
Statistical analysis
The measurement data were expressed as ±SD. All groups were compared by the analysis of variance with the inspection level of α=0.05. All data were statistically analyzed by SPSS 17.0. The graphs were processed by GraphPad Prism 5.0.
Results
Influences of CG on liver and spleen indices
Compared with that of the normal group, the liver index of the model group was significantly higher, which was significantly decreased by CG-VII treatment (P<0.05). Meanwhile, CG-VI and CG-VII treatments reduced the spleen index of the model group (P<0.01). Positive drug remarkably decreased the liver and spleen indices. The results are shown in Table 1.
Table 1.
Influences of CG on the liver and spleen indices of hepatic fibrosis rats ( ±SD, n=6)
| Group | Dose (mg/kg/day) | Liver index | Spleen index |
|---|---|---|---|
|
| |||
| Normal | - | 0.019±0.0004 | 0.0018±0.0002 |
| Model | - | 0.036±0.0048* | 0.0042±0.0003 |
| CG-V | 15 | 0.025±0.0019 | 0.0035±0.0004**▲ |
| CG-VI | 3 | 0.028±0.0058 | 0.0022±0.0004**▲▲ |
| CG-VII | 6 | 0.023±0.0061▲ | 0.0021±0.0006**▲▲ |
| Positive drug | 8 | 0.024±0.0043▲ | 0.0022±0.0003**▲▲ |
Compared with the normal group,
P<0.05,
P<0.01; compared with the model group,
P<0.05,
P<0.01.
CG-V: ether extract; CG-VI: ethyl acetate extract; CG-VII: n-butyl alcohol extract
Influences of CG on the activities of serum AST and ALT
Compared with those of the normal group, the serum AST and ALT activities of the model group were significantly enhanced, suggesting that the modeling was successful. The AST and ALT activity of the treatment groups were significantly lower than those of the model group (P<0.05 & P<0.01, respectively). Positive drug also evidently decreased the AST and ALT activities. The results are listed in Table 2.
Table 2.
Effects of CG on the serum AST and ALT activities of hepatic fibrosis rats ( ±SD, n=6)
| Group | Dose (mg/kg/day) | AST (U/L) | ALT (U/L) |
|---|---|---|---|
|
| |||
| Normal | - | 24.84±3.09 | 19.70 ±4.18 |
| Model | - | 58.96±18.47* | 99.09±3.39** |
| CG-V | 15 | 28.28±4.04▲ | 18.18±7.34▲▲ |
| CG-VI | 3 | 26.52±4.22▲ | 25.86±4.32▲▲ |
| CG-VII | 6 | 25.12±1.98▲ | 16.42±3.17▲▲ |
| Positive drug | 8 | 26.57±3.04 | 23.16±4.22▲▲ |
Compared with the normal group,
P<0.05,
P<0.01; compared
P<0.05,
P<0.01.
CG-V: ether extract; CG-VI: ethyl acetate extract; CG-VII: n-butyl alcohol extract
Histopathological examination
HE staining
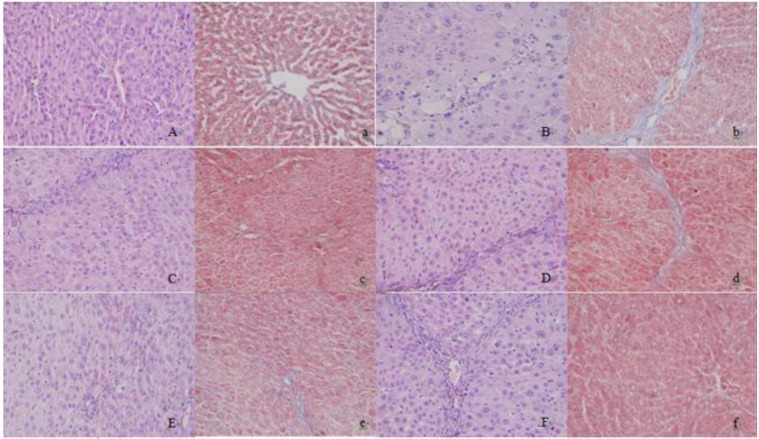
In the normal group, the hepatic lobules were completely and clearly structured with normal hepatic sinusoids and portal areas. There were no inflammatory cells, and the liver cells were normally shaped (Figure 1-A). In the model group, there were no obvious hepatic sinusoids, and the liver cells swelled with ballooning degeneration. The cytoplast was loose and pale-colored (Figure 1-B). Compared with those of the model group, the sinusoids of the positive drug group were more apparent, the cytoplasm of liver cells was more uniform, and the ballooning degeneration was evidently reduced (Figure 1-F). CG-V and CG-VII repaired the pathological lesions of TAA-induced acute liver damages, alleviated the cloudy swelling of liver cells and inflammatory cell invasion, and facilitated the regeneration of liver cells. The results indicated that CG protected rats from TAA-induced hepatic fibrosis.
Figure 1.
Histopathological changes of liver tissues in hepatic fibrosis rats (HE, Masson, × 200). A, a: normal group; B, b: model group; C, c: petroleum ether extract treatment group; D, d: ethyl acetate extract treatment group; E, e: n-butyl alcohol extract treatment group; F, f: positive drug group (A-F: HE staining; a-f: Masson staining)
Masson staining
In the normal group, the liver tissues were usual without collagen fibrosis proliferation, and the liver tissues were completely structured (Figure 1-a). Compared with normal group, more collagen fibers were detected in the liver tissues of the model group, which resulted in collagen deposition and were obviously extended outward and interconnected. Consequently, the lobular structure was undermined without forming false hepatic lobules (Figure 1-b). Compared with those in the model group, the collagen fibers in the CG-V and CG-VII treatment groups were remarkably decreased, suggesting that CG protected the rats from TAA-induced hepatic fibrosis. The positive drug group had significantly decreased collagen fibers than the mode group.
Immunohistochemical staining
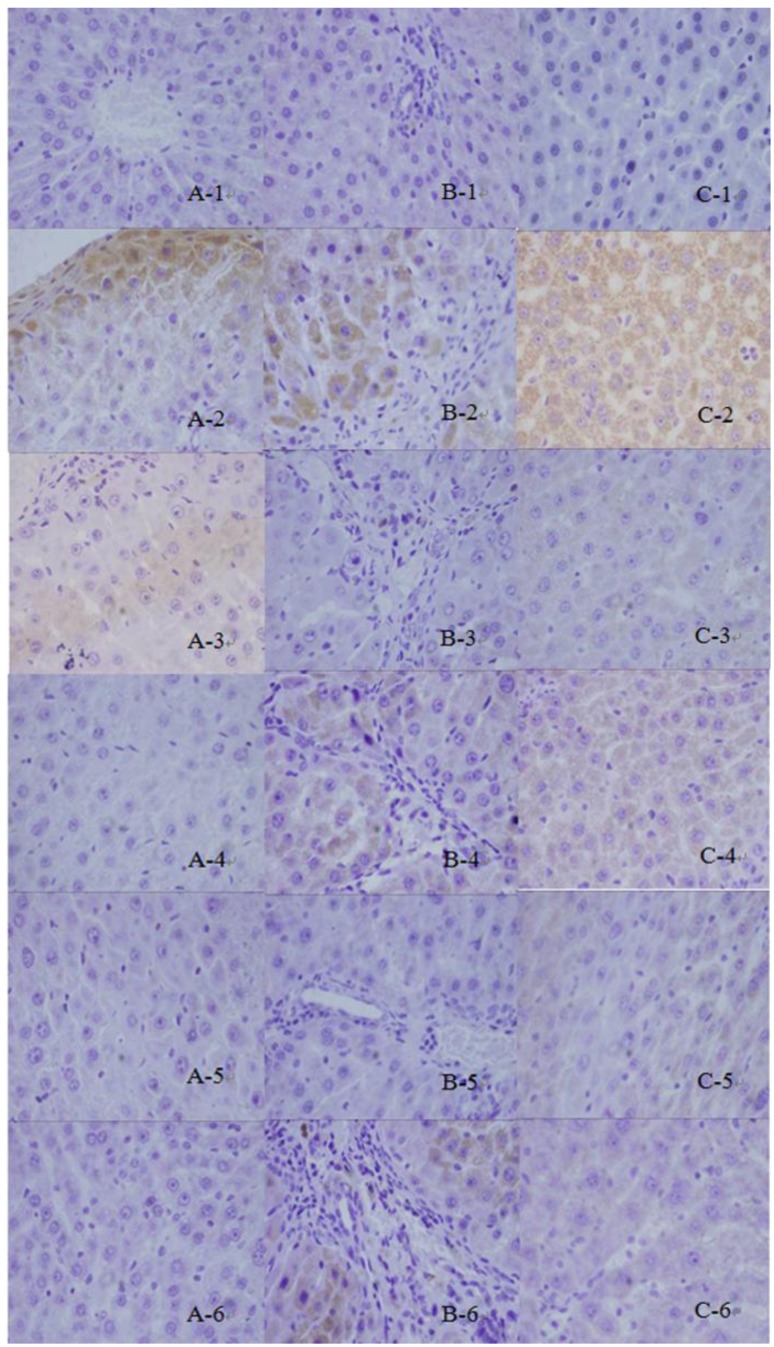
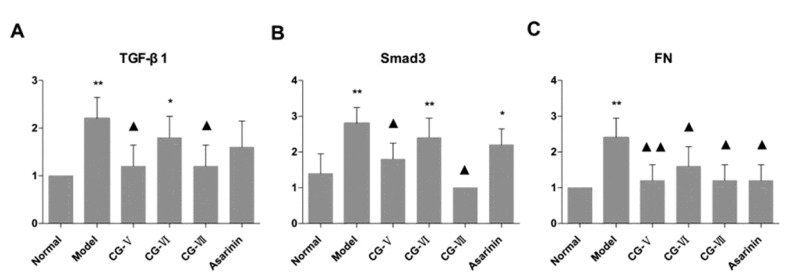
FN was positively expressed weakly in the portal and central vein area and subcutaneous sinus of the normal group. In the model group, the brown granules (Figure 2A-1) that indicate positive expression were primarily distributed in the widened portal area owing to the proliferated fibrous tissues and fibrous septa. The hepatic lobules were isolated and surrounded by the ribbon-like shaped positively expressed brown granules (Figure 2A-2). The results of the CG-V and CG-VII groups were significantly different from those of the model group (P<0.01, P<0.05, respectively). The results are displayed in Figure 3.
Figure 2.
Expressions of TGF-β1, Smad3 and FN in thioacetamide -induced hepatic fibrosis rats. 1: normal group; 2: model group; 3: petroleum ether extract treatment group; 4: ethyl acetate extract treatment group; 5: n-butyl alcohol extract treatment group; 6: positive drug group (a: Fibronectin, b: Smad3, c: TGF-β1)
Figure 3.
Influences of Cichorium glandulosum on the expressions of TGF-β1, Smad3 and FN in thioacetamide -induced hepatic fibrosis rats (n=6)
Smad3 was mildly expressed in the normal group (Figure 2B-1) and its expression was dramatically increased in the model group. The brownish yellow cytoplasmic granules that indicate positive staining, were mainly located in the portal areas and fibrous septa (Figure 2B-2). The interstitial cells which dominated the positively expressed ones, were moderately expressed in the treatment groups. Meanwhile, the treatment groups were apparently less prone to positive staining than the model group. Hepatic parenchymal cells were not considerably expressed. The positively expressed cells in the portal area, portal vein and around central vein of the treatment groups were significantly less than those in the model group. The expression results of the CG-V and CG-VII groups were different from those of the model group (P<0.05). The results are illustrated in Figure 3.
In the normal group, a small amount of TGF-β1 was positively expressed in the interstitial cells of liver tissues (Figure 2C-1). The expression of TGF-β1 in the model group was obviously enhanced and exhibited a brownish yellow cytosolic distribution. The color was evidently deepened around the lobular central vein, portal area, fibrous septa and hepatic sinusoidal Disse cavity space. In addition, they were more frequently scattered in the stellate interstitial cells and inflammatory cell cytoplasm, particularly in the portal area (Figure 2C-2). In the treatment groups, a small number of cells were positively expressed in the portal area and fibrous septa, and the color was significantly lighter than that of the model group. In the meantime, the number of positively expressed interstitial cells was reduced. The differences between the CG-V and CG-VII groups as well as the model group were statistically significant (P<0.05). The results are shown in Figure 3.
FN, Smad3 and IGFBPrP1 expressions in liver tissues examined by Western Blot
FN
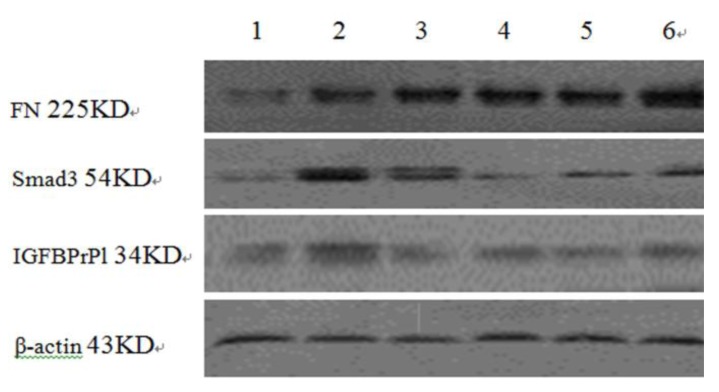
The expressions of FN in all treatment groups were enhanced, which was abnormal in the CG-V group (Figure 4 and 5, Table 3).
Figure 4.
Expressions of Fibronectin, Smad3 and IGFBPrP1 in TAA-induced hepatic fibrosis rats. 1: normal group; 2: model group; 3: petroleum ether extract treatment group; 4: ethyl acetate extract treatment group; 5: CG-VII group; 6: positive drug group
Figure 5.
Influences of Cichorium glandulosum on the expressions of Fibronectin, Smad3 and IGFBPrP1 in hepatic fibrosis rats ( ±SD, n=6). Compared with the normal group, *P<0.05, **P<0.01; compared with the model group, P<0.05, ▲▲P<0.01
Table 3.
Expressions of IGFBPrP1, Smad3 and Fibronectin in TAA-induced rats ( ±SD, n=6)
| Group | Dose (mg/kg/day) | IGFBPrP1 | Smad3 | FN |
|---|---|---|---|---|
|
| ||||
| Normal | — | 0.27±0.04 | 0.21±0.07 | 2.04±0.17 |
| Model | — | 0.75±0.08** | 1.04±0.30* | 4.41±2.44 |
| CG-V | 15 | 0.35±0.09 | 0.38±0.08 | 0.68±0.34 |
| CG-VI | 3 | 0.47±0.17 | 0.19±0.09▲ | 3.54±1.03 |
| CG-VII | 6 | 0.26±0.04▲ | 0.33±0.09▲ | 2.32±0.43 |
| Positive drug | 8 | 0.37±0.11▲ | 0.54±0.35▲ | 1.80±0.03 |
Compared with the normal group,
P<0.05,
P<0.01; compared with the model group,
P<0.05,
P<0.01
CG-V: ether extract; CG-VI: ethyl acetate extract; CG-VII: n-butyl alcohol extract;TAA: thioacetamide; FN: Fibronectin
Smad3
Less Smad3 was expressed in all treatment groups. The expression level of Smad3 in the model group was significantly elevated compared with that in the normal group (P<0.05), and the expression levels in the CG-VI, CG-VII and positive drug groups were significantly lower than that in the model group (P<0.05) (Figure 4 and 5, Table 3).
IGFBPrP1
The expressions of IGFBPrP1 in the normal and model groups differed significantly (P<0.05), and significantly less IGFBPrP1 was expressed in the CG- VII and positive drug groups than that in the model group (P<0.05) (Figure 4 and 5, Table 3).
Stem cell apoptosis examined by TdT-mediated dUTP nick end labeling (TUNEL) assay
Compared with that of the normal group, the apoptotic index of the model group was significantly raised, which was significantly lowered by CG-V treatment (P<0.05). Compared with the model group, the apoptotic index of the positive drug group only slightly decreased (Table 4).
Table 4.
Influences of CG on cell apoptosis of TAA-induced hepatic fibrosis rats ( ±SD, n=6)
| Group | Dose (mg/kg/day) | Apoptotic index |
|---|---|---|
|
| ||
| Normal | - | 52.00±17.89 |
| Model | - | 62.00±13.04 |
| CG-V | 15 | 38.00±8.37▲ |
| CG-VI | 3 | 62.00±8.37 |
| CG-VII | 6 | 31.00±8.37▲ |
| Positive drug | 8 | 60.00±7.07 |
Compared with the normal group, * P <0.05, ** P <0.01; compared with the model group,
P <0.05,
P <0.01.
CG-V: ether extract; CG-VI: ethyl acetate extract; CG-VII: n-butyl alcohol extract
Discussion
The onset of hepatic fibrosis, which involves complicated protocols comprising many cytokines and signal pathways, can only be clarified after being aware of the interaction patterns. TAA is strongly hepatotoxic, which could cause liver lobule necrosis in case of short-term contact and biliary duct proliferation, hepatic fibrosis and cirrhosis with elapsed time (12). The hepatic fibrosis model established by intraperitoneally injection of the mildly carcinogenic TAA is facile, reliable, time-saving, easily successful and stable. With increasing induction time, compared with those of the normal group, the expressions of collagenic fiber and FN in the model group were enhanced, those of IGFBPrP1, TGF-β1 and Smad3 were significantly enhanced, and the expression of TGF-β/Smad3 signal pathway was up-regulated (13, 14).
It is well acknowledged that TGF-β1 is one of the most effective cytokines favoring fibrosis, which its transduction is governed by Smad3 pathway (6). This study examined the changes of TGF-β1/Smad3 expression in TAA-induced hepatic fibrosis rats, aiming to provide theoretical evidence for exploring the mechanism of clinical onset and the relevant treatment strategy. The experiment results revealed that the CG extracts may deactivate the serum AST and ALT in hepatic fibrosis rats. The HE and Masson stained sections of the treatment groups present normal liver tissues, and well-defined hepatic lobules and hepatic sinusoids. In contrast, the liver tissue structures in the model group were interrupted, and the liver tissues and hepatic sinusoids were replaced by numerous connective tissues. TGF-β/Smad3 signal pathway, which determines the development of hepatic fibrosis, can be utilized to prevent and treat hepatic fibrosis after being blocked (11, 15). As one of the well-established, most powerful profibrotic cytokines, TGF-β1 can directly promote the production of collagen and FN -which is a precursor for fibrosis that is involved in the formation of new fibrous tissues- and is related to the repair of the liver injury and rise of serum HA content (16). Smad3, which is the most important pathway for the signal transduction of TGF-β1, is indispensable for TGF-β1-induced transdifferentiation of epithelial cells, ECM and expression of connective tissue growth factor (17, 18). Moreover, IGFBPrP1 has also been reported as a novel factor that induces hepatic fibrosis (19). Therefore, in current study, the expressions of four proteins closely related to the TGF-β/Smad3 signal transduction pathway and controlling the pathological development of hepatic fibrosis were tested. The expression of all of them in the treatment groups were lowered, especially in the n-butanol treatment group. Simultaneously, n-butanol markedly reduced the apoptotic index of hepatocyte.
Conclusion
In summary, CG extracts resisted hepatic fibrosis by down-regulating the expressions of the TGF-β/Smads signaling pathway-related FN, IGFBPrP1, Smad3 and TGF-β1 proteins in liver tissues. This pathway may be one of the critical mechanisms accounting for the fibrosis resistance. Sesquiterpene lactones extracted by n-butyl alcohol may be the main pharmacologically active ingredients in CG and are still in need of further investigation.
Acknowledgment
This study was financially supported by the National Natural Science Foundation of China (No. 81060255).
References
- 1.Chinese Pharmacopoeia Commission. Pharmaco-poeia of the People's Republic of China . Beijing: Chemical Industry Press; 2011. [Google Scholar]
- 2.Pharmacography of Uighur, Part One. 2005. p. 100.
- 3.Peng XX, Wang TL. Clinical pathology of liver diseases. Beijing: Chemical Industry Press; 2010. 7 pp. [Google Scholar]
- 4.Wu HK, Aisa HA, Rakhmanberdyeva RK, Zhauynbaeva KS, Xin XL. Polysaccharides from Cichorium glandulosum seeds. Chem Nat Comp. 2008; 44:79–80. [Google Scholar]
- 5.Wu HK, Xin XL, Su Z, Aisa HA. 2-Isopropyl-6-methylpyrimidin-4(3H)-one and taraxasterol from the stems of Cichorium glandulosum. Chem Nat Comp . 2011;47:664–666. [Google Scholar]
- 6.Houglum K, Bedossa P, Chojkier M. TGF-beta and collagen-alpha 1 (I) gene expression are increased in hepatic acinar zone 1 of rats with iron overload. Am J Physiol. 1994; 267:908–913. doi: 10.1152/ajpgi.1994.267.5.G908. [DOI] [PubMed] [Google Scholar]
- 7.Friedman SL. Mechanisms of hepatic fibrogenesis. Gastroenterology . 2008; 134:1655–1669. doi: 10.1053/j.gastro.2008.03.003. [DOI] [PMC free article] [PubMed] [Google Scholar]
- 8.Yang WJ, Luo YQ, Aisa HA, Xin XL, Totahon Z, Mao Y, et al. Hepatoprotective activities of a sesquiterpene-rich fraction from the aerial part of Cichorium glandulosum. Chin Med . 2012; 7:21. doi: 10.1186/1749-8546-7-21. [DOI] [PMC free article] [PubMed] [Google Scholar]
- 9.Upur H, Amat N, Bla eković B, Talip A. Protective effect of Cichorium glandulosum root extract on carbon tetrachloride-induced and galactosamine-induced hepatotoxicity in mice. Food Chem Toxicol . 2009; 47:2022–2030. doi: 10.1016/j.fct.2009.05.022. [DOI] [PubMed] [Google Scholar]
- 10.Friedman SL. Hepatic stellate cells: protean, multifunctional, and enigmatic cells of the liver. Physiol Rev . 2008; 88:125–172. doi: 10.1152/physrev.00013.2007. [DOI] [PMC free article] [PubMed] [Google Scholar]
- 11.Pietrangelo A, Gualdi R, Casalgrandi G, Montosi G, Ventura E. Molecular and cellular aspects of iron-induced hepatic cirrhosis in rodents. J Clin Invest . 2007; 95:1824–1831. doi: 10.1172/JCI117861. [DOI] [PMC free article] [PubMed] [Google Scholar]
- 12.Seki E, De Minicis S, Gwak GY, Kluwe J, Inokuchi S, Bursill CA, et al. CCR1 and CCR5 promote hepatic fibrosis in mice. J Clin Inves. 2009; 119:1858–1870. doi: 10.1172/JCI37444. [DOI] [PMC free article] [PubMed] [Google Scholar]
- 13.Ye RG, Lu ZY, editors. Internal medicine. 6th ed. Beijing: People's Medical Publishing House; 2006. pp. 430–436. [Google Scholar]
- 14.Ding M, Potter JJ, Liu XP, Torbenson MS, Mezey E. Selenium supplementation decreases hepatic fibrosisin mice after chronic carbon tetrachloride administration. Biol Trace Elem Res. 2010; 133:83–97. doi: 10.1007/s12011-009-8414-x. [DOI] [PMC free article] [PubMed] [Google Scholar]
- 15.Liang TJ, Yuan JH, Tan YR, Ren WH, Han GQ, Zhang J, et al. Effect of ursodeoxycholic acid on TGF beta1/Smad signaling pathway in rat hepatic stellate cells. Chin Med J . 2009; 122:1209–1213. [PubMed] [Google Scholar]
- 16.Houglum K, Bedossa P, Chojkier M. TGF-beta and collagen-alpha 1 (I) gene expression are increased in hepatic acinar zone I of rats with iron overload. Am J Physiol . 2010; 267:908–913. doi: 10.1152/ajpgi.1994.267.5.G908. [DOI] [PubMed] [Google Scholar]
- 17.Pietrangelo A, Gualdi R, Casalgrandi G, Montosi G, Ventura E. Molecular and cellular aspects of iron. induced hepatic cirrhosis in rodents. J Clin Invest . 1995; 95:1824–1831. doi: 10.1172/JCI117861. [DOI] [PMC free article] [PubMed] [Google Scholar]
- 18.Liang TJ, Yuan JH, Tan YR, Ren WH, Han GQ, Zhang J, Wang LC, Qin CY. Effect of ursodeoxycholic acid on TGFbetal/Smadsignaling pathway in rat hepatic stellate cells. Chin Med J . 2009; 122:1209–1213. [PubMed] [Google Scholar]
- 19.Li D, Friedman SL. Liver fibrogenesis and the role of hepatic stellate cells: new insights and prospects for therapy. J Gastroenterol Hepatol. 1999;14:618–633. doi: 10.1046/j.1440-1746.1999.01928.x. [DOI] [PubMed] [Google Scholar]


