

Abstract
Gold nanoparticles have garnered interest as both radiosensitzers and computed tomography (CT) contrast agents. However, the extremely high concentrations of gold required to generate CT contrast is far beyond that needed for meaningful radiosensitization, which limits their use as combined therapeutic–diagnostic (theranostic) agents. To establish a theranostic nanoplatform with well-aligned radiotherapeutic and diagnostic properties for better integration into standard radiation therapy practice, a gold- and superparamagnetic iron oxide nanoparticle (SPION)-loaded micelle (GSM) is developed. Intravenous injection of GSMs into tumor-bearing mice led to selective tumoral accumulation, enabling magnetic resonance (MR) imaging of tumor margins. Subsequent irradiation leads to a 90-day survival of 71% in GSM-treated mice, compared with 25% for irradiation-only mice. Furthermore, measurements of the GSM-enhanced MR contrast are highly predictive of tumor response. Therefore, GSMs may not only guide and enhance the efficacy of radiation therapy, but may allow patients to be managed more effectively.
1. Introduction
External beam radiation therapy is an integral part of current treatment strategies for a variety of cancer types, both for initial therapy and recurrence. Increasingly, more targeted approaches using stereotactic radiosurgery are also being used to maximize the dose to the tumor volume while limiting off-target side effects. Moreover, a wide range of radiosensitizers, including existing chemotherapeutic agents, are being explored to specifically enhance ionizing radiation within tumor tissue without going above the relative dose limitations of surrounding normal tissue.[1,2] Some of the most promising nanotechnology candidates being evaluated as radiosensitizers utilize high-Z materials (i.e. high atomic number), such as gold nanoparticles (AuNPs), to significantly enhance the dose of radiation therapy.[3–7] AuNP-mediated radiosensitization is due to the greater absorption and deposition of energy in surrounding tissues from photo-electrons, Auger electrons, and characteristic X-rays.[8–14] It has been shown that the administration of AuNPs can lead to a statistically significant increase in mean survival in tumor-bearing mice compared with radiation therapy alone.[15–18]
Accurate dosimetry planning prior to radiation treatment requires radiation oncologists and radiation physicists to consider a number of critical factors including the mapping of tumor margins, which can often be difficult to assess using current imaging techniques. AuNPs have long been exploited as X-ray and computed tomography (CT) contrast agents[19,20] and recently have been used to assist with the delineation of tumors boundaries to guide external beam irradiation, thereby simultaneously serving as both a therapeutic and imaging agent.[15] The results from these studies have been encouraging, with tumor bearing mice exhibiting enhanced tumor contrast and improved mean survival when treated with AuNPs in combination with radiation therapy, compared with radiation therapy alone.[15] However, a significant limitation of this approach is the considerable mismatch between the lower detection limit of gold on CT systems (mM concentration range) and the tumoral concentration required for gold-mediated radiosensitization (μM range). This disparity therefore would require the administration of supratherapeutic doses—on the order of grams Au/kg body weight[8]—to perform imaging studies prior to initiating radiotherapy treatment.
Magnetic resonance (MR) imaging is an integral component of the workup for many tumors and is increasingly utilized for treatment planning. Consequently, nanoplatforms that include MR contrast agents could be organically integrated into standard radiation therapy practice. Superparamagnetic iron oxide nanoparticles (SPIONs) are a popular class of MR contrast agent that generate contrast by rapidly de-phasing the magnetic moments of proximal water molecules.[21] SPIONs are capable of generating T2-weighted contrast enhancement in MR imaging at nanomolar concentrations and can therefore be detected by MR at far lower concentrations than AuNPs can be detected via CT.[21]
Herein, we report the design and testing of a multifunctional nanoplatoform consisting of Gold- and SPION-loaded polymeric Micelles (“GSMs”) with well-aligned radiotherapeutic and diagnostic (“RadioTheranostic”) properties. The AuNPs and SPIONs were encapsulated within the hydrophobic core of micelles formed with the biodegradable, amphiphilic di-block co-polymer poly(ethylene glycol)-b-poly(ε-capralactone) (Figure 1a). The physical-chemical properties of GSMs and their contrast- and radio-enhancement characteristics were first evaluated in terms of their imaging, therapeutic, and prognostic benefits.
Figure 1.

Characterization of gold- and SPION-loaded polymeric micelles (GSMs). a) Schematic of GSMs. Gold and SPION are self-assembled into the hydrophobic core of micelles, stabilized with the amphiphilic di-block co-polymer PEG-b-PCL. b) Dynamic light scattering profile of GSMs in phosphate buffered saline, pH 7.4. The average hydrodynamic diameter is 100 nm. c) Transmission electron microscopy (TEM) image of a single GSM. The electron micrograph reveals the incorporation of two size populations of nanoparticles (gold, 2.2 nm; SPION, 14 nm) tightly packed within the hydrophobic core (all scale bars = 100 nm). d–e) Energy dispersive X-ray spectroscopy analysis on GSM with Au and Fe signals, respectively. f) CT phantoms of GSMs and gold-loaded polymeric micelles (GPMs). GSMs have a lower detection limit of 500 μg Au/mL. g) MR phantoms of GSMs and GPMs. GSMs have a lower detection limit of 12.5 μg Au/mL (3.48 μg Fe/mL).
2. Results
2.1. Physical Characterization of GSMs
Dodecanethiol-terminated AuNPs and oleic acid-stabilized SPIONs were synthesized with mean diameters of approximately 2.2 nm and 14 nm respectively, as measured by transmission electron microscopy (TEM) (Supp. Figure S1). Using an oil-in-water emulsion method, GSMs were then prepared with a mean hydrodynamic diameter of 100 nm and low polydispersity (PDI <0.25) as determined by dynamic light scattering (DLS; Supp. Figure S2). The PDI was further reduced to <0.10 following purification and filtration (Figure 1b). Although the different sizes of the AuNPs and SPIONs allow TEM to provide a cursory determination that both particle types have been incorporated into the micelles (Figure 1c), the presence of both Au and Fe was further verified through energy dispersive X-ray spectroscopic analysis of the micelles (Figure 1d and e). Furthermore, the spatial arrangement of particles in the micelles was examined using tomographic electron microscopy (Supp. Video S1). These data illustrate that SPIONs can be found throughout the entire GSM volume, interspersed with the smaller AuNPs, and are not restricted to either the center or the periphery of the hydrophobic core.
Notably, GSMs were highly stable in storage (PBS, 4 °C) for at least 30 days, with no apparent change in the median hydrodynamic diameter or size distribution, as determined by DLS (Supp. Figure S3). GSMs were also stable in serum with no noticeable change in size over the course of 24 h at 37 °C. GSMs that were incubated in serum for 24 h exhibited a slight increase in size following resuspension in PBS, compared to stock GSMs stored in PBS (Supp. Figure S4). This could suggest the formation of a thin protein corona, although additional analysis is required.
The average mass ratio of gold-to-iron in these samples was 5.53 ± 0.50:1, as determined by inductively coupled plasma optical emission spectroscopy (ICP-OES). GSMs were easily mass-producible and yielded a longitudinal relaxivity r1 = 0.046 ± 0.021 mM−1s−1 and a transverse relaxivity r2 = 236.9 ± 11.7 mM−1s−1 at 1.41T (60 MHz) (Supp. Figure S5). The r2/r1 ratio of 5150 is substantially higher than commercial contrast agents—AMI-25 (Feridex, Endorem) has an r2/r1 of ~4, SHU 555A (Resovist) has an r2/r1of ~6, and AMI-121 (Lumirem, Gastromark) has an r2/r1 of ~23[21]—and perhaps all other SPIONs reported to date.[22] The large ratio stems from an infinitesimal r1 value that may be explained by the shielding of the hydrophobic SPIONs from surrounding water. The zeta potential of GSMs was determined to be −1.55 ± 0.19 mV.
2.2. Assessment of GSM Imaging Characteristics
To assess the lower detection limits of GSMs via CT (Figure 1f) and MR (Figure 1g), phantom images were acquired using decreasing concentrations of GSMs dispersed in deionized water. GSMs were compared to micelles containing AuNPs only, i.e. gold-loaded polymeric micelles (GPMs),[15] to determine the effects of substituting SPIONs for gold on CT contrast.
The concentration at which both GSMs and GPMs showed a statistically significant difference in Hounsfield units from baseline (HU of deionized water = 0) was 500 μg Au/mL (at 55 kVp, 0.5 mA), which was consistent with previous studies.[23] There was no significant difference in the Hounsfield units between the GSM or GPM wells, indicating that, at this Au:Fe ratio, the addition of Fe had no substantial effect on CT contrast. Figure 1g shows that the lower detection limit for detecting GSMs by T2 weighted MR was 12.5 μg Au/mL (3.48 μg Fe/mL). No MR contrast from baseline was detected using GPMs for all concentrations, which was expected given that GPMs do not contain any paramagnetic material. Therefore, 40-fold less GSMs were required for detection via MR imaging than either GSMs or GPMs for detection via CT imaging.
2.3. Evaluation of GSM Radiosensitizing Properties
To evaluate the radiosensitization effects of GSMs in vitro, HT1080 human fibrosarcoma cells were irradiated (4 Gy) or mock irradiated in the presence of GSMs (100 μg Au/mL), GPMs (100 μg Au/mL), or no micelles, and analyzed for double strand breaks (γ-h2ax staining) (Figure 2a). The number of DNA double strand breaks correlates with the overall absorbed radiation dose.[24,25] It was found that the number of γ-h2ax foci/100 μm2 (observed as bright fluorescent spots) was enhanced by 1.4 and 2.2 times at 6 h and 12 h post-radiation respectively (Figure 2b), when either GPMs or GSMs were applied, compared with radiation alone. Both GSMs and GPMs provide statistically similar amounts of radiosensitization in vitro. Immunofluorescent images revealed very low levels of γ-h2ax foci in unirradiated cells, regardless of the presence of GPMs or GSMs.
Figure 2.

In vitro evaluation of radiation induced DNA double-strand breaks and cell survival in the presence and absence of GSMs/GPMs. a) Immunofluorescent imaging of γ-h2ax foci in HT1080 cells incubated with GSMs (100 μg Au/mL), GPMs (100 μg Au/mL) or without micelles in the absence (top) or presence (bottom) of irradiation (4 Gy, 150 kVp). b) Quantitative analysis of γ-h2ax foci density (# foci/μm2) for n > 100 cells in each treatment group. Error bars represent 95% confidence intervals. The number of γ-h2ax foci/100 μm2 (observed as bright fluorescent spots) was enhanced by 1.4 and 2.2 times at 6 h and12 h post-radiation, respectively. c) Clonogenic assay of HT1080 cells treated with and without GSMs (25, 50, 100, and 200 μg Au/mL) and given radiation doses of 0, 2, 4 and 6 Gy (150 kVp). Error bars represent the mean survival ± standard error of at least three replicates. d) Plot of sensitizer enhancement ratio (SER) vs. concentration of GSMs. The SER increases linearly as the GSMs concentration is also increased (R2 = 0.993).
Clonogenic assays were performed on HT-1080 cells that were treated with increasing GSM concentrations, revealing a dose dependent response to both radiation dose and GSM concentration in vitro (Figure 2c). The sensitizer enhancement ratio (SER), a measure of how effectively a radiosensitizer reduces tumor cell proliferation, increased linearly (Figure 2d, R2 = 0.993, slope p < 0.001) as the concentration of GSMs was increased. The SER for a GSM dose of 100 μg Au/mL was 1.32, which is comparable to the SER for other AuNP formulations reported in the literature.[18,26]
2.4. GSM Pharmacokinetics and Pharmacodynamics
To evaluate the pharmacokinetic and pharmacodynamic properties of GSMs, the blood clearance profile (Figure 3a), organ biodistribution (Figure 3b and Supp. Table S1), and blood chemistries (Supp. Table S2) were acquired following intravenous injection of GSMs into HT-1080 tumor-bearing, nu/nu mice. The clearance of GSMs from circulation followed a bi-exponential profile with a 1.45 h half-life for the distribution phase and a 17.5 h half-life for the elimination phase (Figure 3a).
Figure 3.

Blood clearance profile and biodistribution of GSMs. a) ICP-OES analysis of gold content in blood at various times following the intravenous administration of GSMs to mice (n = 3). b) ICP-OES analysis of gold distribution at 24 hours and 8 days following the administration of GSMs. The percent injected dose per gram of tissue was calculated by measuring the concentration of gold in excised organs via ICP-OES.
The organ biodistribution of GSMs, as percent injected dose per gram of tissue (%ID/g), was acquired 24 h and 8 days post-injection of GSMs. The high proportion of GSMs found in the spleen and liver suggest that GSMs are cleared primarily through the reticuloendothelial system, as has been previously observed for other PEG-PCL micelle formulations.[15] It is interesting to note the there is high GSM uptake within the inguinal lymph nodes, an observation consistent with GSM extravasation and/or trafficking of cells from other lymphoid organs.
Gold is primarily excreted within feces, with very little found in the urine. Similar amounts of gold are found in the feces on both day 1 and day 8 post-injection, suggestive of continual excretion. Accordingly, the concentration of Au found in the spleen and the liver decreases significantly over the course of a week. This result is very encouraging, as most tissue bio-distribution studies that have been performed following the injection of AuNPs composed of a single, large gold core (>10 nm) have indicated very poor excretion profiles.[27–30] For example, it has been found that there is only a 9% fall in the content of gold in the liver from day 1 to 6 months, following the intravenous injection of 40 nm AuNPs.[30] It is hypothesized that the encapsulation of very small (2.2 nm) AuNPs into a larger GSM construct may facilitate more rapid dissolution and excretion than larger, single-particle systems.
The intravenous injection of GSMs (400 mg Au/kg) into healthy mice led to no signs of illness, change in activity, or weight loss (Supp. Figure S6). Notably, the amount of gold administered was well below the LD50, which was previously reported to be 3.2 g Au/kg,[19] and well within the dosage range of clinically approved intravenous contrast agents. For example, Iodixanol (VISIPAQUE) is typically administered at doses ranging from 300 to 1200 mg of I/kg body weight. Additionally, the dose utilized in this study was lower than what was used in prior studies that employed gold as a radiosensitizer (i.e. 650–1350 mg Au/kg).[4,15,18] A toxicological analysis of mice 1 day and 8 days following the administration of GSMs (400 mg Au/kg) revealed blood chemistries that were not statistically different from those of saline injected controls (Supp. Table S2).
2.5. In Vivo Imaging and Therapy
HT-1080 cells were injected subcutaneously into the back left flank (2 × 10⁶ cells in 0.1 mL of PBS) of 6-week old female nu/nu mice. Tumors were grown until the mean tumor diameter was approximately 7–8 mm. Next, tumor-bearing mice were split into four cohorts: (i) no treatment (n = 8); (ii) GSMs only (400 mg Au/kg, n = 7); (iii) radiation therapy (RT) only (6 Gy, n = 8); (iv) GSMs plus RT 24 h post-injection (n = 7). Animals in the GSM+RT cohort were imaged using MRI and CT both prior to and 24 h following GSM injection. After imaging, mice underwent tumor localized radiation therapy and were followed for 90 days with their tumor sizes measured periodically.
Representative pre- and post-contrast images of a single mouse using both CT and MRI are shown in Figure 4a. Image analysis of tumor contrast is provided in Figure 4b. Note that at this GSM dosage no enhancement is visible with CT imaging, but the tumor is hypointense on MRI, consistent with SPIONs accumulation, effectively delineating the proximal edge of the tumor. To quantitatively determine the amount of GSMs delivered to the tumor, an analogous study was performed (n = 3), whereby the tumors were harvested 24 hours post-injection and the gold content was analyzed by ICP-OES. It was determined that the tumors possessed 6.64%ID of Au/g tumor (6.64% ID of Fe/g – assuming intact GSMs). After adjusting for tumor volume, the average concentration of gold within the tumor was calculated to be 0.55 ± 0.17 mg Au/ml (99 ± 3 μg Fe/mL). This is at the lower detection limit for gold (i.e. ~0.5 mg/mL), but well above the lower detection limit for SPION (i.e. ~3.48 μg Fe/mL). These tumor concentrations are also well above the 0.1 mg Au/ml needed for a radiosensitization effect, based on in vitro analysis. A silver enhancement stain performed on tumor histology sections of mice injected with GSMs confirmed the presence of AuNPs throughout the tumor. No silver enhancement was observed in mice that were administered saline (Figure 4c).
Figure 4.
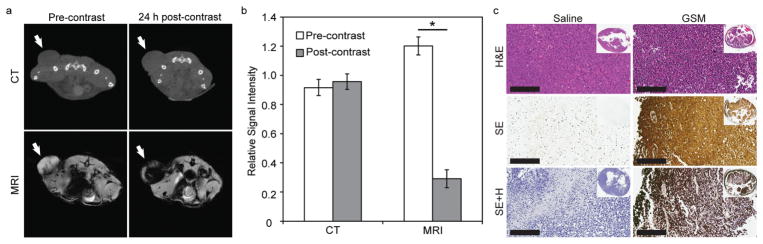
GSM-enhanced imaging and analysis of nu/nu nude mice with HT1080 flank tumors. a) Representative CT (top) and MR (bottom) images in the axial plane prior to injection (precontrast) and 24 h post-injection (postcontrast) of GSMs (400 mg Au/kg) (n = 7). Tumors are indicated by white arrows. b) Quantitative analysis of CT and MR images. Signal intensity of each tumor was normalized to adjacent paraspinal muscle. Statistically significant values of p < 0.05 are indicated with an asterisk. c) Representative histologic sections of HT1080 tumors excised from mice 24 hours after i.v. injection with saline (left) or GSMs (right). Sections were stained with H&E (top), silver enhancement (middle), or silver enhancement with hematoxylin counter stain (bottom). Inset: gross tumor section of representative histological slices.
Following imaging, mice were monitored for tumor growth and were sacrificed when the tumors reached the predetermined threshold volume (1300 mm3). The survival time was measured from the time of radiation (or mock irradiation). Mice that received GSMs prior to radiation therapy exhibited a statistically significant (p < 0.05) improvement in mean survival (75.6 ± 9.2 days), compared to mice treated with radiation alone (50.4 ± 10.6 d) (Figure 5a). It should be noted that all mouse groups appeared to tolerate GSMs very well over the course of study with no observable changes in behavior or symptoms of hepatic or gastrointestinal toxicity, such as loss of appetite, diarrhea, or vomiting. The mean survival times for the control and GSM-only mice were not statistically different at 20.0 ± 2.5 days and 25.7 ± 2.6 days, respectively. The general observable trend in tumor response post radiation therapy was tumor growth delay, followed by either a partial response or a complete response of the tumor (Figure 5b). A significantly larger (p < 0.05) proportion of mice from the GSM+RT group derived a complete response with no discernable tumor (71%) compared to the mice in the RT-only group (25%). Note that of the two surviving mice in the RT-only group, one mouse derived a complete response and the other mouse had a residual, palpable but stable mass at the end of the study period.
Figure 5.
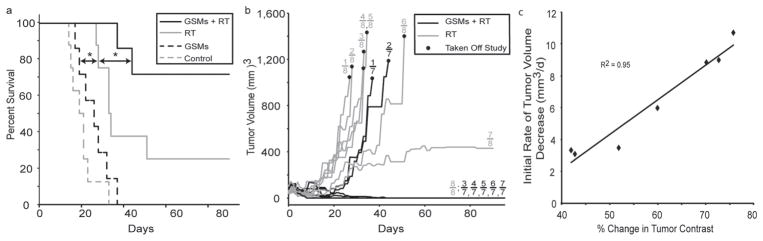
Kaplan-Meier survival and tumor response. a) A survival analysis was performed for HT1080 tumor bearing mice receiving no treatment (n = 8, dotted gray line), GSMs only (n = 7); (dotted black line), radiation therapy (RT) only (n = 8, solid gray line), or radiation therapy 24 h post-intravenous injection of GSMs (n = 7, solid black line). GSMs were administered at a dose of 400 mg Au/kg. The radiation dose administered was 6 Gy at 150 kVp. The asterisk indicates statistical significance (p < 0.05). b) Average tumor volumes of mice following treatment with GSMs and radiation therapy (solid black lines) or radiation therapy alone (solid gray lines). c) Plot of initial rate of tumor volume decrease versus the % change in tumor contrast for all mice (n = 7) receiving GSMs (400 mg Au/kg) plus radiation therapy (6 Gy, 150 kVp).
To evaluate the predictive value of GSM–enhanced MR imaging, we compared the tumor contrast enhancement to the rate of tumor volume decrease following irradiation. The analysis revealed a strong correlation (R2 = 0.95) between contrast enhancement and tumor response (Figure 5c). This relationship is consistent with the in vitro data linking GSM dose to the efficacy of radiosensitization and provides a promising mechanism to guide follow-up treatment accordingly.
3. Discussion
The GSMs reported here address the aforementioned disparity between the dose of gold-only particles needed to obtain therapeutic benefit and the dose needed for imaging enhancement. The MR imaging enhancement provided by GSMs was highly robust, due to their high transverse relaxivity (r2 = 233 mM−1s−1) and consequent nanomolar sensitivity. This is similar to the characteristics of SPION-only formulations[31] and allowed tumor borders to be readily identified and the extent of GSM uptake to be assessed. Therefore, GSMs could potentially enable radiation oncologists to more accurately plan both the geometric and dosimetric aspects of radiation therapy.
Unlike many other dual imaging-treatment nanoparticles, which use chemotherapeutics as their payload,[32,33] GSMs are not inherently cytotoxic and only exert their therapeutic effects in the presence of ionizing radiation. Coupled the lower concentrations needed to achieve image enhancement, these properties render GSM extraordinarily safe. Accordingly, the administration of GSMs did not result in any significant changes in weight, blood chemistry, or behavior.
At the radiation energies tested, GSMs provided a potent dose-dependent enhancement of DNA double strand breaks and SER in vitro. They also significantly increased survival and improved tumor responses in vivo, compared with radiation treatment alone. The linear relationship between the contrast enhancement and therapeutic response further supports the dose dependent radiosensitization of tumor cells. The GSM-mediated radiation enhancement effects could potentially allow physicians to increase the efficacy of a given overall dose of radiation therapy administered, with no incremental risk to normal tissues.
While MR contrast and therefore GSM localization correlated with the initial rate of tumor volume decrease, there was no apparent correlation observed between the level of image contrast and overall therapeutic outcome. This dissociation of initial response and clinical end point may be due to differences in the tumor microenvironment (e.g. hypoxia, inflammatory reaction, heterogeneous vasculature), which predispose certain tumors to either an early, necrotic response or a delayed apoptotic response to radiation therapy. The relationship between gold-enhanced radiation therapy and the mechanism of tumor cell death warrants further investigation.
The accumulation of GSMs in tumors is mediated by the EPR effect. However, EPR has been shown to vary from tumor to tumor with the level of tumor vascularization.[34–36] Differences in vascularization lead to variations in the tumoral delivery of nanoparticle-based therapeutic agents and thus a large variability in nanoparticle treatment efficacy.[37] However, because GSM-enhanced MR imaging can be used to quantify the tumor penetrance, tumor dosimetry planning can be adjusted accordingly.
While EPR alone may not be sufficient to produce widespread dissemination of GSMs throughout all tumors, the administration of GSMs over the course of a fractionated radiation therapy regiment may promote the spatially targeted delivery of GSMs into the tumor. Recent MRI studies have shown that radiation can increase the permeability of tumors to gadolinium in human patients.[38] Additionally, it has recently been shown that radiation therapy can enhance the delivery of nanopolymers (diameter ≈ 40–70 nm),[39] pegylated near-infrared fluorescent probes,[40] and pegylated AuNPs (diameter ≈ 23 nm)[18] to tumors in murine models. These data suggest that targeted radiation therapy can enhance the uptake of circulating nanoformulations by increasing vascular and interstitial permeability.
At 150 kVp, the most likely mechanism for the dose enhancement effects of gold is the photoelectric effect,[8,9] leading to extensive DNA damage. The attenuation of x-rays with depth at this energy makes the treatment of superficial tumors by external beam radiation, the enhancement of brachytherapy, and the enhancement of intra-operative radiation therapy three possible applications for GSMs. Furthermore, other research has already illustrated the efficacy of gold nanoparticles in enhancing radiation therapy at higher, megavoltage energies (e.g. 6 MV) more commonly seen in the clinical treatment of deep-seated tumors.[26,41] As the photoelectric cross-section is nearly zero at these higher energies, the likely radiosensitization mechanism is not photoelectric, but potentially relies on the generation of reactive oxygen species to cause cellular damage or on other scattering mechanisms.[42,43] The use of platinum (atomic number ZPt = 78) to enhance proton beam therapy suggests that GSMs (ZAu = 79) may also have a role in enhancing proton-mediated radiation therapy.[44]
In conclusion, incorporating GSMs with radiation therapy could augment cancer treatment by facilitating imaging, increasing the efficacy of therapy, and helping to predict response. Moreover, since GSMs are prepared using a highly modular synthetic pathway, additional components, including standard and alternative therapeutics could readily be incorporated into the micelle’s core while targeting moieties (e.g. tumor-specific antibodies or Fab’s) can be coupled onto the unobstructed micelle surface, further broadening the range and types of tumors that can be effectively treated. The extravasation properties of these particles may also make them useful in treating diseases localized to regional lymph nodes, such as Hodgkin’s lymphoma. Therefore, it is envisioned that translation of GSM to oncology could have far reaching implications.
4. Experimental Section
Synthesis of Hydrophobic 2.2 nm Gold Nanoparticles
Dodecanethiol-capped gold nanoparticles, 2.2 nm in diameter, were prepared by the reduction of gold salts in a two-phase reaction, as previously described by Brust, et al.[45] Briefly, a 30 mM solution of HAuCl4 (30 mL) was mixed with 80 mL of a 50 mM solution of tetraoctylammonium bromide in toluene, with the addition of 170 mg (84 mmol) of 1-dodecanethiol. While this two-phase solution was stirring vigorously, a 25 mL aqueous solution of 400 mM NaBH4 was added dropwise at a rate of 1 mL per minute. The resulting mixture was then allowed to stir for three hours. Next, the aqueous phase was removed from the organic phase, which contained the AuNPs. The organic solution was then diluted with three volumes of 95% ethanol, and the mixture was precipitated overnight at −20 °C. The resulting precipitate was then collected via centrifugation and the supernatant removed. Finally, the gold nanoparticles were resuspended in toluene to a final concentration of ~40 mg/mL.
Synthesis of Hydrophobic 14 nm SPION
Oleic acid stabilized SPIONs were prepared by thermal decomposition as previously described by Park, et al.[46] After allowing the reaction to cool to room temperature, two volumes of acetone were added and the resulting mixture was centrifuged to precipitate the nanoparticles. The particles were then washed in 10 mL hexane and precipitated again using 35 mL of acetone followed by centrifugation. This washing procedure was repeated until the supernatant was clear. The particles were then allowed to air dry and dissolved in toluene at ~40 mg/mL.
Synthesis of Gold-Superparamagnetic Iron Oxide Polymeric Micelles (GSMs)
GSMs were prepared using an oil-in-water emulsion-based self-assembly method. First, polyethylene glycol (4k) – polycaprolactone (3k) was dissolved in toluene to a concentration of 50 mg/mL. A solution (205 μL) containing AuNPs (4 mg), SPION (1 mg), and PEG-PCL (4 mg) was then injected into a glass vial containing 4 mL of dH2O and the sample was sonicated (Branson Ultrasonics, Danbury, CT, USA) until a homogenous mixture was obtained. The toluene was then allowed to evaporate overnight. For large scale preparation, this synthesis was easily scaled up by a factor of 10 using a sonic dismembrator (Fisher Scientific, Waltham, MA, USA).
Purification of Size-Specific GSMs
GSM samples were first centrifuged at 1000 relative centrifugal force (rcf) for 30 minutes to remove large aggregates. The resulting supernatant then underwent diafiltration using a MidGee hoop cross flow cartridge with 750 kDa molecular weight cutoff (GE Healthcare, Piscataway, NJ, USA) in order to remove small impurities and exchange the solution into PBS. GSMs were then passed through a 0.22 μm SFCA filter (Millipore, Billercia, MA, USA) to remove oversized particles. Finally, this filtered solution was centrifuged at 31 000 rcf for one hour, and the pellet was resuspended in PBS. Micelles were then concentrated as needed using 50 K MWCO centrifugal filter units (Millipore, Billercia, MA, USA) and exchanged into cell culture media as necessary.
The concentrations of gold and iron in a given micelle sample were measured by Genesis ICP-OES (Spectro Analytical Instuments GMBH; Kleve, Germany) at the Department of Earth and Environmental Sciences, University of Pennsylvania, PA, USA. Analytical standards were purchased from RICCA Chemical Company (Arlington, TX, USA), and nitric acid and hydrochloric acid were purchased from Fisher Scientific. All dilutions were done using deionized water (≥18 MΩ-cm) obtained from a Millipore water purification system.
Metal Nanoparticle and GSM Physicochemical Characterization
AuNP and SPION size distributions were verified by TEM. Stock samples were diluted in dH2O and deposited on 200-mesh carbon coated copper grids (Polysciences, Warrington, PA, USA) for TEM imaging with a JEOL 1010 transmission electron microscope. Mean particle diameters and standard deviations were assessed by measuring the diameters of 50 individual particles in ImageJ. GSM size distributions and zeta potentials were measured in PBS by dynamic light scattering using a Zetasizer Nano-ZS (Malvern Instruments, Worcestershire, UK). GSMs were also imaged by TEM, using the same method used for individual metal nanoparticles. GSM relaxivities (r1 and r2) were measured using a Bruker mq60 tabletop MR relaxometer (1.41 T, 60 MHz). The gold and iron content of the GSMs was assessed using both a Genesis ICP-OES and energy dispersive X-ray spectroscopy (EDS) mapping using a JEOL 2010F transmission electron microscope.
Determination of Contrast Sensitivity Limit
The radiologic sensitivity was determined for both CT and MRI imaging modalities using 100 nm GSMs. A 384-well plate (well volume of 100 ul) was prepared using GSMs (100 nm diameter) in dH2O with concentrations ranging from 0 to 3000 μg Au/mL. The same setup was duplicated in parallel on the same plate using 100 nm Au-only micelles (GPMs) as a nanoparticle control. A row of pure dH2O was included between the rows of GSMs and GPMs as a no-particle control. The CT image was taken at 55 kVp, 5 mAs using the SARRP at the Perelman School of Medicine of the University of Pennsylvania. The MR image was taken with a 9.0T magnet at the Small Animal Imaging Facility of the University of Pennsylvania using a gradient echo multislice (GEMS) sequence, TR = 200 ms, and TE = 5 ms. Images were analyzed using ImageJ software. For the CT phantom, Hounsfield units were computed for each well based upon a linear transformation setting HUair = –1000 and HUdH2O = 0. In order to reduce image noise, the final CT phantom image was constructed by averaging together all of the image slices containing a full view of all pertinent wells from five separate CT scans of the phantom. For the MRI image, the contrast ratio (CR) was computed as the ratio of the average well intensity for micelle and water containing wells, respectively. Statistical analysis (α = 0.05) was then performed to determine the lowest concentrations at which the GSMs gave a contrast signal significantly different from baseline (i.e. CR = 1 or HU = 0) in each modality. A similar analysis was performed for the Au-only micelles.
Cell Culture and Tumor Model
HT-1080 mammalian fibrosarcoma cells were cultured and maintained at 37 °C and 5% CO2 in minimum essential media (MEM), supplemented with 10% fetal bovine serum (FBS) and 1% penicillin/streptomycin. Six-week old female nu/nu nude mice (Charles River Laboratory, Charles River, MA, USA) were maintained according to the regulations of the Institutional Animal Care and Use Committee of the University of Pennsylvania. Mice were anesthetized using isoflurane and, for xenograft tumor models, HT-1080 cells (2 × 10⁶ cells in 0.2 mL PBS) were injected into the left flank by subcutaneous injection.
In Vitro Assessment of Radiosensitization
The radiosensitization effects of GSM were assessed using a γ-h2ax assay to quantify the number of DNA double strand breaks (DSBs) per unit cell area. The assay was performed using HT-1080 cells, plated at 100 000 cells per well in 4-well chamber slides (Nunc Lab-Tek II CC2 Chamber Slide System, Thermo Scientific, Waltham, MA). Three different treatment conditions were evaluated: 100 nm GSMs at a concentration of 100 μg Au/mL, 100 nm AuNP-only micelles (GPMs) at 100 μg Au/mL, and no micelles. After a 24-hour incubation period, the samples were irradiated with 4 Gy of radiation (150 kVp, 10 mAs) using the Small Animal Radiation Research Platform (SARRP) at the Perelman School of Medicine of the University of Pennsylvania. Three cohorts of treatment slides were used, one each for the time points T = 0 hours (no radiation), T = 6 hours post-radiation, and T = 12 hours post-radiation. At each time point, cells were fixed in 10% neutral buffered formalin (Sigma-Aldrich) for 10 minutes. After being rinsed with PBS, the nuclei were stained with Hoechst 33342 (25 μM) for 15 minutes. Slides were then permeabilized with 0.5% TritonX-100 in PBS and exposed to a blocking buffer composed of PBS, 0.5% TritonX-100, 5% normal chicken serum, and 1% BSA, for 30 minutes at room temperature. Cells were then incubated overnight in a humidified chamber at 4 °C with mouse monoclonal anti-phosphohistone γ-h2ax primary antibody (JBW301, Upstate) at 1:1500 dilution in PBS (with 0.5% triton X-100 and 1% BSA). After approximately 24 hours, slides were washed with PBS, and a chicken anti-mouse Alexa 594 secondary antibody (Molecular Probes) was applied at 1:1000 dilution in PBS (with 0.5% triton X-100 and 1% BSA) for 1 hour. Finally, slides were incubated for 12 hours with ProLong Gold antifade reagent (Invitrogen) and coverslips applied. Fifteen images were captured of the each slide using a Deltavision deconvolution microscope (Applied Precision) equipped with a 60x (1.42 NA) oil-imersion lens and thermoelectrically cooled 12-bit monochrome CCD camera. Images were recorded as z-stacks with 0.3 μm steps. Each image was then processed and analyzed in order to quantify the number of foci (DSBs) per unit cell area using a custom imageJ macro developed by co-author M. Vido.
In vitro Characterization of Dose-Dependent Radiosensitization Effects
The dose dependence of 100 nm GSMs on radiosensitization was evaluated using a clonogenic assay. Briefly, HT-1080 cells were grown to confluence, as described above, and plated at increasing cell concentrations ranging from 200 cells to 4000 cells in 60mm × 15 mm petri dishes. Prior to irradiation at 150 kVp, 10 mA, the media was aspirated away and 3 mL of 100 nm GSMs in media were applied to each plate. Each plate was then exposed to 0 Gy, 2 Gy, 4 Gy, or 6 Gy of radiation, with plates originally seeded with higher cell concentrations receiving the higher doses of radiation. Following radiation, the GSM media was aspirated away and replaced with fresh media. The assay was completed once for each of the following GSM concentrations: 0 μg Au/mL, 25 μg Au/mL, 50 μg Au/mL, 100 μg Au/mL, and 200 μg Au/mL. After waiting 14 days, colonies were stained with methylene blue. The surviving fraction was then calculated as S = (number of colonies counted)/(cells seeded × plating efficiency). Survival curves were fit to the linear quadratic model, where S = exp[−(αD + βD2)], for the dose, D, and the constants, α and β. A sensitizer enhancement ratio was computed for each GSM treatment condition by first computing the mean inactivation dose (MID),[47] where , for . The SER for a given GSM concentration was then equal to the ratio SER = (MID for radiation alone) / (MID for radiation + GSMs). GSMs were sterilized before use in this assay by prior irradiation for 500 minutes at 11 Gy/min.
Blood Distribution, Clearance, and Tumor Delivery
Three nude mice with HT-1080 tumor xenografts were injected intravenously under anesthesia with 100-nm GSMs in PBS at dose of 400 mg Au/kg body weight. Post-injection, 10 μL blood samples were collected via the tail-nick method from each animal at the following times: 0.5, 1, 2, 4, 6, 8, and 24 hours. After the final aliquot of blood was collected the animals were sacrificed and the brain, thyroid, heart, lungs, liver, spleen, small bowel, large bowel, kidneys, inguinal lymph nodes, tumor, skin, bone, and muscle were removed from each animal. Organ samples were washed with dH2O to minimize contamination from any nanoparticles still circulating in the blood. The blood samples and organs were then analyzed for gold content by ICP-OES. Organ samples were weighed into Teflon PFA vials (Savillex, Minnetonka, MN, USA) and digested overnight at 37 °C with 70% nitric acid to digest the organic material. HCl was added the next day to dissolve the AuNPs. Blood samples were dissolved directly in aqua regia. Blood GSM content was calculated as the percent of the injected dose per gram of blood analyzed (%ID/g). Organ GSM content was similarly calculated as the percent of the injected dose present per gram of organ/tumor tissue.
Toxicity Studies
12 nude mice (female) were randomized into four groups of 3 animals per group receiving 650 mg Au/kg or sham-injected with phosphate buffered saline. Animals were weighed and observed regularly for clinical signs of toxicity. Animals were euthanized by CO2 1 day and 8 days after intravenous injections and 0.3 ml blood was removed from the right ventricle immediately after the cessation of breathing. Blood chemistry analytes included blood urea nitrogen (BUN), phosphate, total protein, albumin, globin, alanine aminotransferase (ALT), aspartate aminotransferase (AST), alkaline phosphatase, total bilirubin, cholesterol and direct bilirubin.
In vivo Testing of GSMs as a Radiosensitizer and MR Contrast Imaging Agent
Four cohorts of mice were prepared with HT-1080 fibrosarcoma tumors in their left, hind flank as described above. One cohort (n = 8) was preserved as an untreated control. The next cohort (RT-only, n = 8) was irradiated with 6 Gy of radiation at 150 kVp and 10 mA using the SARRP. Another cohort (GSM-only, n = 7) was injected intravenously with 100 nm GSMs in PBS at a dose of 400 mg Au/kg body weight. Prior to contrast administration, the final cohort (GSM+RT, n = 7) was first imaged by CT (55 kVp, 5 mAs) and MRI (GEMS sequence, 200 ms TR, 5 ms TE). Next, the GSM+RT mice were injected as described above with 100 nm GSMs. Twenty four hours later, post-injection images were acquired using MRI and CT, followed by a single 6 Gy irradiation at 150 kVp and 10 mA. Tumor volumes were monitored thrice weekly using a dial caliper, and the tumor volume was computed as V = (π/6)*A*B*C, for A, B, and C, the three tumor diameters. Mice were deemed ready to enter the treatment protocol when their average tumor diameter was between 7 and 8 mm. Mice were sacrificed if their average tumor volume rose above 1,300 mm3, if their tumors became severely ulcerated, or if the mice appeared emaciated (as per IACUC regulations). Progression was defined as occurring on the first of three consecutive days of increasing volume, following the initial period of tumor shrinkage after irradiation. Remission was defined as occurring on the first of three consecutive days of zero palpable tumor volume, following the initial period of tumor shrinkage following irradiation.
Pre- and post-contrast MR images were analyzed using ImageJ software. The average intensity inside a region of interest (ROI) drawn around the tumor and inside a region of nearby muscle was computed for each image. The relative signal intensity (rSI) was computed as the ratio of average intensity inside the tumor ROI to average intensity inside the muscle ROI for a given image. Finally, the contrast enhancement of a given mouse was then computed as the ratio of post-contrast and pre-contrast TC scores.
Using tumor volume data, the average initial rate of tumor shrinkage post-radiation was computed for the GSM+RT mouse cohort. The initial rate of tumor shrinkage was computed using the largest tumor volume reached before the tumor began shrinking and the tumor volume reached approximately 15 days later (or on the first day of tumor remission, if it occurred before 15 days). These average tumor shrinkage rates were then correlated to the contrast enchancement for the mice from which they were derived.
Numerical and Statistical Analysis
All numerical and statistical analysis was performed in Microsoft Excel. Where appropriate, a Student’s t-test was used to determine if differences were statistically significant. For the survival studies, the Prism 5 (GraphPad software) was used to perform log-rank survival analysis on data presented in Kaplan-Meier curves. All error bars are reported as standard error of the mean.
Supplementary Material
Acknowledgments
The authors gratefully acknowledge Dr. Cameron Koch, Walter T. Jenkins, and Lee Shuman for insightful discussions and technical support with the SARRP, Dewight Williams for assistance with the TEM, and David Vann for help with ICP-OES. This work was supported by NIH/NINDS (RC1 CA145075 and K08 NS076548, JD), NIH/NIBIB (R21 EB013754 and R01 EB012065, AT), NIH/NCI (R01 CA157766, AT; R01 CA175480, ZC; R01 CA181429; JD and AT) and the Burroughs Wellcome Career Award for Medical Scientists (1006792; JD).
Footnotes
Supporting Information is available from the Wiley Online Library or from the author.
Contributor Information
Casey McQuade, Department of Bioengineering, University of Pennsylvania, 210 S. 33rd Street, 240 Skirkanich Hall, Philadelphia, PA 19104, USA.
Ajlan Al Zaki, Department of Bioengineering, University of Pennsylvania, 210 S. 33rd Street, 240 Skirkanich Hall, Philadelphia, PA 19104, USA.
Yaanik Desai, Department of Bioengineering, University of Pennsylvania, 210 S. 33rd Street, 240 Skirkanich Hall, Philadelphia, PA 19104, USA.
Michael Vido, Department of Bioengineering, University of Pennsylvania, 210 S. 33rd Street, 240 Skirkanich Hall, Philadelphia, PA 19104, USA.
Timothy Sakhuja, Department of Bioengineering, University of Pennsylvania, 210 S. 33rd Street, 240 Skirkanich Hall, Philadelphia, PA 19104, USA.
Prof. Zhiliang Cheng, Department of Bioengineering, University of Pennsylvania, 210 S. 33rd Street, 240 Skirkanich Hall, Philadelphia, PA 19104, USA
Robert J. Hickey, Department of Chemistry, School of Arts and Sciences, University of Pennsylvania, Philadelphia, PA 19104, USA
Daniel Joh, Department of Radiation Oncology, Perelman School of Medicine, University of Pennsylvania, Philadelphia, PA 19104, USA.
So-Jung Park, Department of Chemistry and Nano Science, Global Top 5 Program, Ewha Womans University, 52 Ewhayeodae-gil, Seodaemun-gu, Seoul 120-750, Korea.
Prof. Gary Kao, Department of Radiation Oncology, Perelman School of Medicine, University of Pennsylvania, Philadelphia, PA 19104, USA
Prof. Jay F. Dorsey, Department of Radiation Oncology, Perelman School of Medicine, University of Pennsylvania, Philadelphia, PA 19104, USA
Prof. Andrew Tsourkas, Email: atsourk@seas.upenn.edu, Department of Bioengineering, University of Pennsylvania, 210 S. 33rd Street, 240 Skirkanich Hall, Philadelphia, PA 19104, USA
References
- 1.Moding EJ, Kastan MB, Kirsch DG. Nat Rev Drug Discov. 2013;12(7):526. doi: 10.1038/nrd4003. [DOI] [PMC free article] [PubMed] [Google Scholar]
- 2.Seiwert TY, Salama JK, Vokes EE. Nat Clin Pract Oncol. 2007;4(2):86. doi: 10.1038/ncponc0714. [DOI] [PubMed] [Google Scholar]
- 3.Eck W, Craig G, Sigdel A, Ritter G, Old LJ, Tang L, Brennan MF, Allen PJ, Mason MD. ACS Nano. 2008;2(11):2263. doi: 10.1021/nn800429d. [DOI] [PubMed] [Google Scholar]
- 4.Hainfeld JF, Slatkin DN, Smilowitz HM. Phys Med Biol. 2004;49(18):N309. doi: 10.1088/0031-9155/49/18/n03. [DOI] [PubMed] [Google Scholar]
- 5.Thakor AS, Luong R, Paulmurugan R, Lin FI, Kempen P, Zavaleta C, Chu P, Massoud TF, Sinclair R, Gambhir SS. Sci Transl Med. 2011;3(79):79ra33. doi: 10.1126/scitranslmed.3001963. [DOI] [PMC free article] [PubMed] [Google Scholar]
- 6.Thakor AS, Paulmurugan R, Kempen P, Zavaleta C, Sinclair R, Massoud TF, Gambhir SS. Small. 2011;7(1):126. doi: 10.1002/smll.201001466. [DOI] [PMC free article] [PubMed] [Google Scholar]
- 7.Zavaleta CL, Hartman KB, Miao Z, James ML, Kempen P, Thakor AS, Nielsen CH, Sinclair R, Cheng Z, Gambhir SS. Small. 2011;7(15):2232. doi: 10.1002/smll.201002317. [DOI] [PMC free article] [PubMed] [Google Scholar]
- 8.Hainfeld JF, Dilmanian FA, Slatkin DN, Smilowitz HM. J Pharm Pharmacol. 2008;60(8):977. doi: 10.1211/jpp.60.8.0005. [DOI] [PubMed] [Google Scholar]
- 9.Rahman WN, Bishara N, Ackerly T, He CF, Jackson P, Wong C, Davidson R, Geso M. Nanomedicine. 2009;5(2):136. doi: 10.1016/j.nano.2009.01.014. [DOI] [PubMed] [Google Scholar]
- 10.Matsudaira H, Ueno AM, Furuno I. Radiat Res. 1980;84(1):144. [PubMed] [Google Scholar]
- 11.Santos Mello R, Callisen H, Winter J, Kagan AR, Norman A. Med Phys. 1983;10(1):75. doi: 10.1118/1.595378. [DOI] [PubMed] [Google Scholar]
- 12.Spiers FW. Br J Radiol. 1949;22(261):521. doi: 10.1259/0007-1285-22-261-521. [DOI] [PubMed] [Google Scholar]
- 13.Cheng NN, Starkewolf Z, Davidson RA, Sharmah A, Lee C, Lien J, Guo T. J Am Chem Soc. 2012;134(4):1950. doi: 10.1021/ja210239k. [DOI] [PubMed] [Google Scholar]
- 14.McMahon SJ, Hyland WB, Muir MF, Coulter JA, Jain S, Butterworth KT, Schettino G, Dickson GR, Hounsell AR, O’Sullivan JM, Prise KM, Hirst DG, Currell FJ. Radiother Oncol. 2011;100(3):412. doi: 10.1016/j.radonc.2011.08.026. [DOI] [PubMed] [Google Scholar]
- 15.Al Zaki A, Joh D, Cheng Z, De Barros AL, Kao G, Dorsey J, Tsourkas A. ACS Nano. 2014;8(1):104. doi: 10.1021/nn405701q. [DOI] [PMC free article] [PubMed] [Google Scholar]
- 16.Hainfeld JF, Smilowitz HM, O’Connor MJ, Dilmanian FA, Slatkin DN. Nanomedicine. 2013;8(10):1601. doi: 10.2217/nnm.12.165. [DOI] [PMC free article] [PubMed] [Google Scholar]
- 17.Joh D, Kao G, Murty S, Stangl M, Sun L, Al Zaki A, Xu X, Hahn S, Dorsey J. Translational Oncol. 2013;6:722. doi: 10.1593/tlo.13433. [DOI] [PMC free article] [PubMed] [Google Scholar]
- 18.Joh DY, Sun L, Stangl M, Al Zaki A, Murty S, Santoiemma PP, Davis JJ, Baumann BC, Alonso-Basanta M, Bhang D, Kao GD, Tsourkas A, Dorsey JF. PLoS One. 2013;8(4):e62425. doi: 10.1371/journal.pone.0062425. [DOI] [PMC free article] [PubMed] [Google Scholar]
- 19.Hainfeld JF, Slatkin DN, Focella TM, Smilowitz HM. Br J Radiol. 2006;79(939):248. doi: 10.1259/bjr/13169882. [DOI] [PubMed] [Google Scholar]
- 20.Popovtzer R, Agrawal A, Kotov NA, Popovtzer A, Balter J, Carey TE, Kopelman R. Nano Lett. 2008;8(12):4593. doi: 10.1021/nl8029114. [DOI] [PMC free article] [PubMed] [Google Scholar]
- 21.Wang YJ, Hussain SM, Krestin GP. Eur Radiol. 2001;11(11):2319. doi: 10.1007/s003300100908. [DOI] [PubMed] [Google Scholar]
- 22.Vuong QL, Berret JF, Fresnais J, Gossuin Y, Sandre O. Adv Healthcare Mater. 2012;1(4):502. doi: 10.1002/adhm.201200078. [DOI] [PubMed] [Google Scholar]
- 23.Hainfeld JF, O’Connor MJ, Dilmanian FA, Slatkin DN, Adams DJ, Smilowitz HM. Br J Radiol. 2011;84(1002):526. doi: 10.1259/bjr/42612922. [DOI] [PMC free article] [PubMed] [Google Scholar]
- 24.Illiakis G. Bio Essays. 1987;13(12):641. [Google Scholar]
- 25.Ward JF. Int J Radiat Biol. 1990;57(6):1141. doi: 10.1080/09553009014551251. [DOI] [PubMed] [Google Scholar]
- 26.Chithrani DB, Jelveh S, Jalali F, van Prooijen M, Allen C, Bristow RG, Hill RP, Jaffray DA. Radiat Res. 2010;173(6):719. doi: 10.1667/RR1984.1. [DOI] [PubMed] [Google Scholar]
- 27.Balasubramanian SK, Jittiwat J, Manikandan J, Ong CN, Yu LE, Ong WY. Biomaterials. 2010;31(8):2034. doi: 10.1016/j.biomaterials.2009.11.079. [DOI] [PubMed] [Google Scholar]
- 28.Cho WS, Cho M, Jeong J, Choi M, Cho HY, Han BS, Kim SH, Kim HO, Lim YT, Chung BH. Toxicol Appl Pharmacol. 2009;236(1):16. doi: 10.1016/j.taap.2008.12.023. [DOI] [PubMed] [Google Scholar]
- 29.Niidome T, Yamagata M, Okamoto Y, Akiyama Y, Takahashi H, Kawano T, Katayama Y, Niidome Y. J Control Release. 2006;114(3):343. doi: 10.1016/j.jconrel.2006.06.017. [DOI] [PubMed] [Google Scholar]
- 30.Sadauskas E, Danscher G, Stoltenberg M, Vogel U, Larsen A, Wallin H. Nanomedicine. 2009;5(2):162. doi: 10.1016/j.nano.2008.11.002. [DOI] [PubMed] [Google Scholar]
- 31.Ai H, Flask C, Weinberg B, Shuai XT, Pagel MD, Farrell D, Duerk J, Gao J. Adv Mater. 2005;17:1949. [Google Scholar]
- 32.Hong G, Yuan R, Liang B, Shen J, Yang X, Shuai X. Biomed Microdevices. 2008;10(5):693. doi: 10.1007/s10544-008-9180-9. [DOI] [PubMed] [Google Scholar]
- 33.Nasongkla N, Bey E, Ren J, Ai H, Khemtong C, Guthi JS, Chin SF, Sherry AD, Boothman DA, Gao J. Nano Lett. 2006;6(11):2427. doi: 10.1021/nl061412u. [DOI] [PubMed] [Google Scholar]
- 34.Fukumura D, Jain RK. J Cell Biochem. 2007;101(4):937. doi: 10.1002/jcb.21187. [DOI] [PubMed] [Google Scholar]
- 35.Hobbs SK, Monsky WL, Yuan F, Roberts WG, Griffith L, Torchilin VP, Jain RK. Proc Natl Acad Sci USA. 1998;95(8):4607. doi: 10.1073/pnas.95.8.4607. [DOI] [PMC free article] [PubMed] [Google Scholar]
- 36.Yuan F, Chen Y, Dellian M, Safabakhsh N, Ferrara N, Jain RK. Proc Natl Acad Sci USA. 1996;93(25):14765. doi: 10.1073/pnas.93.25.14765. [DOI] [PMC free article] [PubMed] [Google Scholar]
- 37.Karathanasis E, Suryanarayanan S, Balusu SR, McNeeley K, Sechopoulos I, Karellas A, Annapragada AV, Bellamkonda RV. Radiology. 2009;250(2):398. doi: 10.1148/radiol.2502080801. [DOI] [PubMed] [Google Scholar]
- 38.Cao Y, Tsien CI, Shen Z, Tatro DS, Ten Haken R, Kessler ML, Chenevert TL, Lawrence TS. J Clin Oncol. 2005;23(18):4127. doi: 10.1200/JCO.2005.07.144. [DOI] [PubMed] [Google Scholar]
- 39.Baumann BC, Kao GD, Mahmud A, Harada T, Swift J, Chapman C, Xu X, Discher DE, Dorsey JF. Oncotarget. 2013;4(1):64. doi: 10.18632/oncotarget.777. [DOI] [PMC free article] [PubMed] [Google Scholar]
- 40.Baumann BC, Benci JL, Santoiemma PP, Chandrasekaran S, Hollander AB, Kao GD, Dorsey JF. Transl Oncol. 2012;5(4):230. doi: 10.1593/tlo.12136. [DOI] [PMC free article] [PubMed] [Google Scholar]
- 41.Jain S, Coulter JA, Hounsell AR, Butterworth KT, McMahon SJ, Hyland WB, Muir MF, Dickson GR, Prise KM, Currell FJ, O’Sullivan JM, Hirst DG. Int J Radiat Oncol Biol Phys. 2010;79(2):531. doi: 10.1016/j.ijrobp.2010.08.044. [DOI] [PMC free article] [PubMed] [Google Scholar]
- 42.Kang B, Mackey MA, El-Sayed MA. J Am Chem Soc. 2010;132(5):1517. doi: 10.1021/ja9102698. [DOI] [PubMed] [Google Scholar]
- 43.Pan Y, Leifert A, Ruau D, Neuss S, Bornemann J, Schmid G, Brandau W, Simon U, Jahnen-Dechent W. Small. 2009;5(18):2067. doi: 10.1002/smll.200900466. [DOI] [PubMed] [Google Scholar]
- 44.Porcel E, Liehn S, Remita H, Usami N, Kobayashi K, Furusawa Y, Le Sech C, Lacombe S. Nanotechnology. 2010;21(8):85103. doi: 10.1088/0957-4484/21/8/085103. [DOI] [PubMed] [Google Scholar]
- 45.Brust M, Walker M, Bethell D, Schiffrin DJ, Whyman R. J Chem Soc Chem Commun. 1994 doi: 10.1039/c39940000801. [DOI] [Google Scholar]
- 46.Park J, An K, Hwang Y, Park JG, Noh HJ, Kim JY, Park JH, Hwang NM, Hyeon T. Nat Mater. 2004;3(12):891. doi: 10.1038/nmat1251. [DOI] [PubMed] [Google Scholar]
- 47.Belli M, Simula S. Radiat Res. 1991;128(1):112. [PubMed] [Google Scholar]
Associated Data
This section collects any data citations, data availability statements, or supplementary materials included in this article.