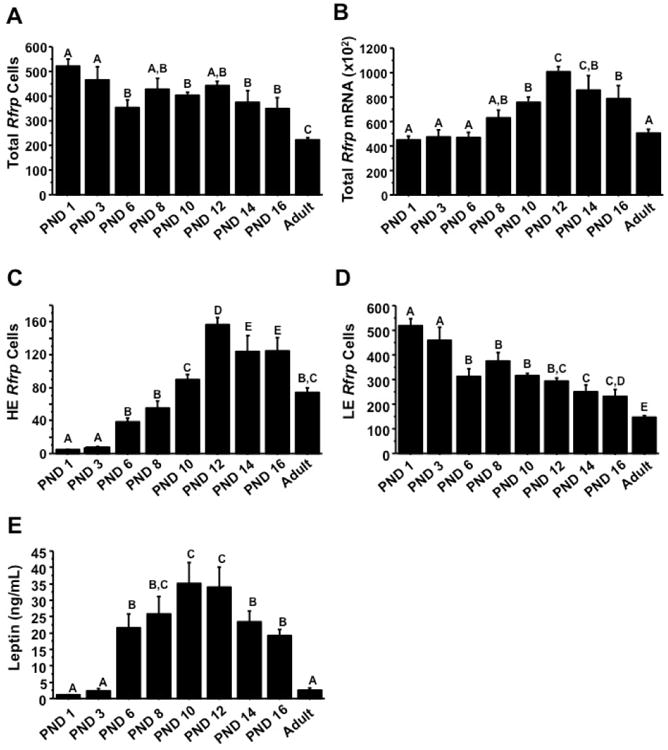
Figure 6.

Summary of changes in Rfrp expression over the first 16 days of postnatal life in female mice from single label in-situ hybridization. Rfrp mRNA was quantified on postnatal days (PND) 1, 3, 6, 8, 10, 12, 14, 16 and diestrous female adult mice. [A] Quantification of total number of Rfrp neurons during the first two weeks of life. Different letters indicate significantly different groups (p < 0.05). [B] Quantification of total Rfrp mRNA during the first two weeks of life. Different letters indicate significantly different groups (p < 0.05). [C] Quantification of the number of high expressing (HE) Rfrp neurons during the first two weeks of life. Different letters indicate significantly different groups (p < 0.05). [D] Quantification of the number of low expressing (LE) Rfrp neurons during the first two weeks of life. Different letters indicate significantly different groups (p < 0.05). [E] Average serum leptin levels of mice sacrificed across development on PND 1, 3, 6, 8, 10, 12, 14, 16 and a cohort of diestrous female adult mice. Different letters indicate significantly different groups (p < 0.05).
