

Abstract
Aberrant glycosylation of IgGs has been linked to human diseases, including liver disease. In this study, we have quantified plasma immunoglobulins in cirrhosis (CIR) and hepatocellular carcinoma (HCC) and employed a novel LC-MS-MRM assay to quantify glycoforms of IgG subclasses 1-4. Glycan oxonium ions and peptide-GlcNAc fragment ions were utilized to quantify the IgG glycoforms purified by affinity chromatography with normalization to the unique peptide for each IgG subclass. Our results indicate that HCC patients have increased circulating IgG1, IgG3, IgA1, and IgM compared to healthy controls; comparison of HCC and CIR patients shows that HCC patients have significantly higher concentration of IgG1 and IgM but lower concentration of IgG2. Increase in galactose-deficient core fucosylated glycoforms was consistently observed in CIR and HCC patients. The FA2G0 and FA2BG0 glycoforms increase approximately 2-fold in all IgG subclasses accompanied by a decrease in the FA2G2 glycoform. Fucosylation changes are less pronounced but we have detected increased degree of fucosylation in the IgG1 and IgG3 glycoforms. In conclusion, we have optimized a sensitive and selective LC-MS-MRM method for quantification of immunoglobulin subclasses and their site specific glycoforms, demonstrating that both quantities and glycoforms of immunoglobulins change significantly in liver disease progression to HCC.
Introduction
In the United States, hepatitis C viral (HCV) infection is the leading cause of chronic liver disease including cirrhosis and hepatocellular carcinoma (HCC), the most serious complication of the viral infection [1]. HCC is the third leading cause of cancer death in the world and a cancer with continuously increasing incidence in the United States [2;3]. Approximately 80% of HCC is associated with chronic viral infections world-wide [4] and, in the US, 50-60% of HCC patient are HCV infected [1].
Stimulation of immune response by HCV antigens leads to increase in specific subclasses of immunoglobulins dominated by the IgG1 and IgG3 subclasses [5]. The disease-associated shift in immunoglobulin distribution has been well documented [6-8]. Broadly neutralizing antibodies targeting the E1/E2 glycoprotein have been isolated but are not common due to the high variability and extensive glycosylation of the viral envelope [9-11]. Immune response is typically considered part of the pathogenesis of liver damage in chronic HCV infection but the mechanism remains undefined [12]. Nonetheless, antibody dependent cellular cytotoxicity (ADCC) was associated with antibodies to E2 envelope glycoprotein at all stages of HCV infection [13]. In addition to the HCV directed antibodies, liver disease leads to general increase in antibody titers in association with leakage of intestinal antigens [14-16] .Significant increase in serum IgA and IgG was reported at the stage of hepatic fibrosis [6;17]. And progressive increase of circulating serpin squamous cell carcinoma antigen-IgM complexes has been found to be associated with liver tumor development [8].
In addition to quantitative changes of specific immunoglobulin subclasses, N-glycosylation of immunoglobulins provides critical regulation of functional responses mediated by Ig-receptors and other interacting partners [18]. Glycosylation is a frequent and heterogeneous translational modification which regulates many biological processes including protein folding, stability, and host-pathogen interactions [19-21]. Each immunoglobulin has conserved glycosylation sites on their heavy chain (HC) while the glycosylation of the light chains is variable. We and others have shown that glycosylation of immunoglobulins changes in liver disease [19;22-25]. Immunoglobulins A and G have been found to be the major glycoproteins contributing to the observed changes in composition of total serum N-glycome in cirrhotic patients [22]. GlycoFibroTest stages fibrosis based on the log ratio of a-galactosylated biantennary glycan derived from immunoglobulins to triantennary complex glycan derived from liver secreted proteins [17]. And decreased galactosylation of anti-Gal IgG was associated with the progression of fibrosis to cirrhosis of hepatitis C viral etiology [15]. In all the above studies, glycosylation was monitored at the level of total IgG, primarily by analysis of the enzymatically detached glycans; the distribution of the glycosylation changes between subclasses of IgG in liver disease remains unknown. Because of the association of immunoglobulins with liver disease progression and because of the importance of glycosylation in regulation of IgG responses, we decided to quantify changes in the site specific glycoforms of IgG1-4 in liver disease. For this purpose, we have optimized LC-MS-MRM assays for simultaneous quantification of immunoglobulins and site specific glycoforms of IgG1-4 subclasses and report application of these assays to a pilot examination of liver disease progression from CIR to HCC.
Materials and methods
Study population
All participants including HCC patients (n=5), cirrhotic patients (n=5), and healthy individuals (n=5) were recruited under protocols approved by the Georgetown University’s Institutional Review Board in collaboration with the Department of Hepatology and Liver Transplantation, Georgetown University Hospital, Washington D.C. Liver disease of all cirrhotic and HCC participants was of HCV etiology. Liver cirrhosis and HCC diagnosis was established by the attending physician based on liver imaging and/or liver biopsy. All HCC patients had early stage disease (stage 1 and 2) in agreement with the 7th Edition of the American Joint Committee on Cancer Staging manual. All participants were age matched and the cirrhotic and HCC patients had comparable degree of liver damage as measured by MELD scores. The basic demographic and clinical information of the participants is summarized in Table 1.
Table 1.
Basic characteristics of study participants.
| Cirrhosis | HCC | Healthy control | P value* | |
|---|---|---|---|---|
| size | 5 | 5 | 5 | |
| Gender (M:F)* | 3:2 | 4:1 | 4:1 | |
| Race (CA:AA)* | 3:2 | 4:1 | 3:2 | |
| Age (mean±std) | 57±3.53 | 54±2.92 | 56.6±3.85 | 0.43 |
| MELD (mean±std) | 11±4.12 | 11.8±3.96 | 0.68 | |
| HCV | + | + | − | |
| INR | 1.26±3.70 | 1.34±0.25 | 0.59 | |
| Albumin (mg/L) | 3.38±0.43 | 3.38±0.67 | 0.83 | |
| WBC (K/CMM) | 5.86±2.54 | 4.80±1.73 | 0.35 | |
| ALT (IU/L) | 62.40±49.35 | 112.40±55.80 | 0.21 | |
| AST (IU/L) | 94.20±50.45 | 147.40±65.73 | 0.40 |
M:F=Male:Female; CA:AA=Caucasian:African-American; P value is based on non-parametric test (Wilcoxon-Mann Whitney test or Kruskal-Wallis test).
Isolation of immunoglobulins from human plasma
Immunoglobulins were isolated from human plasma by using Proteus protein A and G columns (AbD Serotec, Oxford, UK) according to the manufacturer’s instructions with minor modifications (Scheme 1). Isolation was performed at 10°C, buffer A (0.1 M di-sodium hydrogen phosphate containing 0.1 M NaCl, pH 7.0) diluted plasma was loaded on Protein A column by centrifugation, washed three times with buffer A, and bound immunoglobulins (except for IgG3 which does not bind to protein A) were eluted with buffer B (0.2 M glycine, pH 2.5). This immunoglobulin fraction was named Ig fraction A. To further increase the purity of IgG3, the flow through was loaded back onto the regenerated Protein A column, the flow through was consequently loaded on a Protein G column, washed and eluted with buffer B as described above. Collected fractions were dialyzed against de-ionized H2O overnight, concentrated on a CentriVap Centrifuge (Labconco, Kansas City, MO) to dryness, and reconstituted in 50 mM ammonium bicarbonate. Final concentration of proteins was measured by Nanodrop 1000 Spectrophotometer (Thermo Fisher Scientific, Wilmington, DE) at 280nm using IgG as reference.
Scheme 1.

Overview of immunoglobulin isolation from plasma.
To assure removal of IgG3 from Ig fraction A, we have prepared antihuman IgG3 affinity magnetic beads by incubating biotinylated mouse anti human IgG3 antibody (Sigma-Aldrich, St. Louis, MO) with streptavidin magnetic beads (Solulink, San Diego, CA) in Tris-buffered saline (TBS, pH 7.4) for 1.5 hr with mixing at room temperature. After three cycles of washing with TBS, isolated Ig fraction A reconstituted in 100 µl TBS was added to the magnetic beads for a 1.5 hr incubation at room temperature with mixing. The unbound fraction was collected for analysis of glycoforms of IgG2.
IgG3 genotyping
Genomic DNA was extracted from buffy coat and oligonucleotides (F 5’-ACCCAAGGATACCCTTATGATT , R 5’-GAGGCTCTTCTGCGTGAAGC ) were used as the primer set to amplify a 683 base pair DNA segment of the human IgG3 heavy chain gene as reported by Baldin et al. [26]. Amplification was conducted in a GeneAmp PCR System 9700 (Applied Biosystems, Carlsbad, CA) using Platinum Blue PCR Supermix (Invitrogen, Carlsbad, CA). The amplified IgG3 DNA samples were cleaned up by Qiaquick PCR Purification kit (Qiagen, Germantown, MD) according to the manufacturer’s instructions and sequencing of the DNA product was performed by GENEWIZ (Germantown, MD).
Tryptic and PNGase F digests
Plasma or immunoglobulins were reconstituted in 50 mM ammonium bicarbonate and digested with Trypsin Gold (Promega, Madison, WI) as previously described [27] without RapiGest. Digested proteins were subjected to LC/MS analysis without further processing to ensure reliable quantification. To determine the allele expression level in heterozygous IgG3, trypsin was deactivated by heating the protein solution at 99°C for 10 min. PNGase F (250 units) was then added and the digestion was conducted at 37°C for 18 hr.
Quantification of Immmunoglobulins and their glycoforms
One unique peptide was selected from each immunoglobulin for quantification of the subclasses [28]. Uniqueness of each selected peptide was confirmed by searching against UniProtKB/Swiss-Prot human protein database. The corresponding isotopically labeled peptides or peptides with single conservative amino acid replacements were synthesized by Dr. Koomen’s lab [28;29] except for the IgG4 standard, which was synthesized by New England Peptide (Gardner, MA). These labeled peptides served as internal standards for quantification of immunoglobulins. Purified full length native human IgG1, 2, and 4 (Abcam, Cambridge, MA), IgG3 (Athens Research & Technology, Athens, GA), IgA and IgM (Lee Biosolutions , St. Louis, MO) proteins were used to generate isotope dilution calibration curves. Quantitative analyses were performed in positive ion mode on a 4000 Q-trap mass analyzer (AB Sciex, Framingham, MA) coupled with a nanoAcquity chromatographic system (Waters Associates, Milford, MA) consisting of a UPLC 2G Symmetry C18 TRAP column (5µm, 180 µm × 20 mm) and a BEH C18 300 capillary analytical column (1.7µm particles, 75 µm × 150 mm). Peptide and glycopeptide separation was achieved by a 2 min trapping/washing step using 100% solvent A (2% acetonitrile containing 0.1% formic acid) at 15 µl/min followed by a 34 min acetonitrile gradient at a flow rate of 0.4 µl/min: 3 min from 0% to 13% solvent B (0.1% formic acid in acetonitrile); 28 min from 13% to 55% solvent B; and 3 min from 55% to 99% solvent B. Multiple reaction monitoring (MRM) mode was used for peptide and glycopeptide quantification with ion spray voltage set at 2400 V, curtain gas 13, ion source gas 1 30, and the interface heater temperature 180°C. Both entrance potential (EP) and collision cell exit potential (CXP) were set at 10 V, declustering potential (DP) was 75 V, and Q1/Q3 were set at unit resolution. The MRM transitions used for immunoglobulin monitoring are listed in Supplementary Table S1 with the glycoforms monitored in our experiments listed in Table 2. Precursor masses of each evaluated glycopeptide are listed in Supplementary Table S2. Oxonium ions at m/z 204, 138, 274 (sialylated glycans only), and peptide-GlcNAc fragments were selected for glycopeptide monitoring. Collision energy (CE) for each MRM transition was optimized by a 5 V step optimization followed by a 2 V step fine tuning. Instrument control and data acquisition were performed by AB Sciex Analyst software (version1.6.1).
Table 2.
Subclass specific glycoforms of IgG1-4 evaluated in this study.
A2G0 
|
A2G2S 
|
FA2G1S 
|
A2BG1S 
|
A2G1 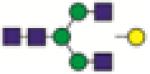
|
FA2G0 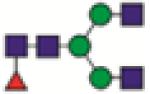
|
FA2G2S 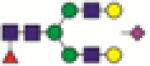
|
A2BG2S 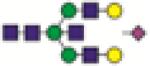
|
A2G2 
|
FA2G1 
|
FA2BG1S 
|
FA1G0 
|
A2BG0 
|
FA2G2 
|
FA2BG2S 
|
FA1G1 
|
A2BG1 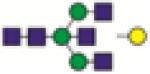
|
FA2BG0 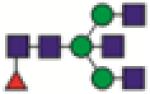
|
A2G2S2 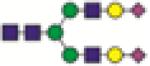
|
A1G1 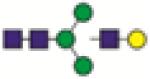
|
A2BG2 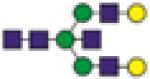
|
FA2BG1 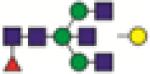
|
FA2BG2S2 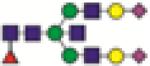
|
|
A2G1S 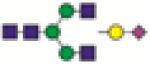
|
FA2BG2 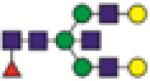
|
FA2G2S2 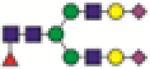
|
 N-acetylglucosamine
  mannose
  galactose
  fucose
  sialic acid
Data processing and Statistical analysis
LC-MS-MRM data was processed by Multi Quant 2.0 software (AB Sciex) with manual confirmation. Peak intensities were used for peptide and glycopeptide quantification and data normalization. MRM transitions used for quantification of the immunoglobulin subclass are highlighted in bold in Supplementary Table S1. For glycopeptide quantification, MRM transition of the glycopeptide precursor→204.1 was selected. The remaining MRM transitions were used as quality control to confirm the specificity of the targeted peptide (glycopeptide). The intensity of glycopeptide of each IgG subclass was normalized to that of its corresponding unique peptide. The concentrations of each immunoglobulin used in the study were within the linear portion of the calibration curves. Fucosylation degree is calculated by normalizing the sum of intensities of all fucosylated glycoforms to the sum of intensities of all subclass specific glycoforms. Degree of sialylation was calculated by normalizing the sum of intensities of all sialylated glycoforms to the sum of intensities of all subclass specific glycoforms.
Statistical analyses were performed with SAS releases 9.2 (SAS Institute, Cary, NC). All reported p values are two sided. Baseline variables on age and liver function tests in healthy control, CIR, and HCC groups were compared by non-parametric tests (Wilcoxon-Mann Whitney test or Kruskal-Wallis test). All the quantitative data were derived from duplicate measurements of each sample. Individual sample effect was regarded as random. Generalized Equation Estimation models (GEE) was applied to evaluate the differences of average Immunoglobulin subclass concentrations or average relative intensities of each glycoform from IgG1-4, among the three groups; the p values of pairwise comparisons between three groups were adjusted by the Bonferroni correction. Principal component analysis was utilized to summarize major variance (85% total population variance) and corresponding contributors (specific glycoforms) from glycoform profiles of IgG1-3; IgG4 was excluded from this comparison due to its low intensity. Glycoforms with major contribution to variance between IgG subclasses were verified by the generalized equation estimation model, stratified in healthy control, cirrhotic and HCC groups.
Results
Quantification of Ig by stable isotope dilution LC-MS-MRM
Elevation of plasma immunoglobulin concentrations in chronic HCV infection was reported previously [7]. We have used a novel stable isotope dilution LC-MS-MRM method to evaluate which classes of plasma immunoglobulins change in concentration during liver disease progression to HCC. We use isotopically labeled peptides specific for each immunoglobulin subclass (IgG1-4, IgA1, IgA2, and IgM) to ensure accuracy of quantification. Specific MRM transitions (Supplementary Table S1) of the internal standards were used to construct standard curves, based on serial dilution of the immunoglobulins of interest, and to quantify endogenous peptides by stable isotope dilution LC-MS-MRM methods [30]. In the case of IgM and IgA2, structural analogs of the endogenous peptides were used as internal standards as described previously [29]. Considering matrix effects, the same amount of healthy control plasma was added to each protein concentration. The resulting isotope dilution calibration curves (Supplementary Figure S1) show a linear response in a concentration range of at least 2 orders of magnitude with R2 greater than 0.999, except for IgG3 and IgA2. Peptides selected for these Ig subclasses have higher detection limits and their plasma concentrations are low which limits the range of linear response. However, the concentration range of IgG3 and IgA2 in all the examined plasma samples fell within the linear range of quantification.
The measured concentrations of immunoglobulins in plasma of each study group (Table 1) are listed in Supplementary Table S3. Figure 1 shows that concentration of IgG1 in plasma of cirrhotic patients significantly increased compared to healthy controls and further increased in patients with HCC. Similar trend was observed for IgG3 (but only the change from control to HCC reached significance), IgA1 (change between cirrhosis and cancer did not reach significance), and IgM (change between control and cirrhosis did not reach significance). In contrast, concentration of IgG4 and IgA2 did not change and IgG2 decreased in the HCC group. The multiplex LC-MS-MRM method of Ig subclass quantification has good performance and can be used efficiently for evaluation of immunoglobulin concentrations under any disease context. The results are based on a small set of samples but confirm clearly the reported non-uniform changes in Ig-subclass concentrations in liver disease [6;7]. But the quantification of immunoglobulins is not major aim of our study. We were primarily interested in the site specific glycoforms of IgG1-4 and we use the quantification of immunoglobulins to adjust the measurements, as described below.
Fig. 1.

Concentration of Ig in plasma of healthy control (CTRL, n=5), cirrhosis (CIR, n=5), and hepatocellular carcinoma (HCC, n=5) groups. *: p<0.05 based on pairwise comparison with Bonferroni adjustment in GEE model.
Isolation of Ig subclasses for quantification of glycoforms
IgGs are the most abundant immunoglobulin type that consists of four subclasses. Each IgG subclass has one highly occupied and conserved N-glycosylation site with specific amino acid sequence (Supplementary Table S2). Alterations in the glycosylation of total IgG in liver disease have been described [15;16] but alteration of subclass-specific glycoforms was not reported to our knowledge. To accomplish subclass-specific quantification of glycoforms, we have at first isolated total IgG and targeted identification based on the specific amino acid sequences. Because the canonical sequence of IgG3 and IgG4 is isobaric (differs only in order of AA in the sequence), we have devised an isolation scheme of these subclasses based on differential affinity to protein A and G (Scheme 1). The approach is efficient but we have noticed that the glycopeptide of IgG3 in some samples is actually the same as IgG2 due to a polymorphic variant frequent in population of European ancestry (Supplementary Figure S2). This variant is also utilized to a different degree in heterozygotes; in some people, majority of the translated protein is of the wild type sequence (Supplementary Figure S3 A-B) while others express both forms to a similar degree (Supplementary Figure S3 C-D). This complicates quantitative analysis and dictates that isolation of the protein subclasses has to be adjusted in agreement with genotype and utilization of the variant message (Supplementary Table S4).
To obtain clean subclass-specific protein information, we have adjusted the workflow by addition of further isolation of IgG3 on a specific antibody column and used this additional purification step in cases where enrichment on protein A and G was inefficient (Scheme 1). As shown in Scheme 1, IgG 1, 2, and 4 were isolated with IgA and IgM by protein A column and IgG3 was recovered from partial immunoglobulin depleted plasma by protein G column. We have verified by LC-MS-MRM quantification the concentration of each subclass in the isolated fractions. Another set of isotopic dilution calibration curves were generated using IgG standard as matrix to avoid different matrix effect from plasma for quantification of IgG subclasses in isolated fractions (Supplementary Figure S4). The quantitative results demonstrate > 99% purity of isolated IgG3 (data not shown) but the amount of IgG3 contaminating IgG2 was too high for IgG2 glycoform analysis in case of one sample in the HCC group (Supplementary Table S5).
Quantification of subclass specific glycoforms of IgGs
We have first examined changes in site occupancy (percent of the site occupied by glycans) with liver disease progression by analysis of the non-occupied glycopeptides for each IgG subclass. We were able to detect un-occupied IgG1 and IgG2 glycopeptides but their intensity is close to the detection limits (S/N =3) and does not differ among the three groups. The un-occupied glycopeptides for IgG3 and IgG4 were below detection limits. We conclude that occupancy for all subclasses is greater than 95% and does not change with disease status (data not shown).
To quantify subclass specific IgG glycoforms, we have selected initially a list of 26 glycoforms based on our prior analysis of detached glycans and from reports in the literature [31;32] (Table 2). Since the amount of IgG 1-4 subclasses vary among the samples, the intensity of glycopeptides was normalized to the intensity of the unique peptide corresponding to each IgG subclass. Among the 26 glycoforms, seven (FA2BG1S, FA2BGS, FA2G2S2, A2BG1S, A2BG2S, A2G2S2, and FA2BG2S2) were not detectable in any group by our current method. Some glycans were detectable but below quantification limit, some glycans were quantifiable but in a limited subset of the samples. We have therefore in the end compared 15 (IgG1), 9 (IgG2), 11 (IgG3), and 7 (IgG4) glycoforms detectable in all samples (bolded entries in Supplementary Table S2).
Majority of glycans associated with all IgG subclasses are bi-antennary and core fucosylated [31;32]. We have been able to quantify minor bisected and non-fucosylated glycoforms but, as expected, we did not detect any high mannose or tri- or more antennary glycoforms. Pairwise comparison with Bonferroni adjustment showed that nine glycoforms significantly differ among the groups in the case of IgG1 (Figure 2A). FA2G0 approximately doubles in cirrhosis and HCC compared to healthy controls while the FA2G2 glycoform decreases in cirrhosis and HCC. The non-fucosylated counterparts of these dominant glycoforms show decrease in the A2G2 glycoform in cirrhosis and HCC but the A2G0 does not increase in the liver disease groups compared to controls. In addition to FA2G0, the bisected FA2BG0 glycoform doubles in intensity in HCC and cirrhosis compared to controls. Other quantitative changes are less consistent and of lower magnitude. These observations are consistent with the previously reported glycoforms of total IgG [17;22]
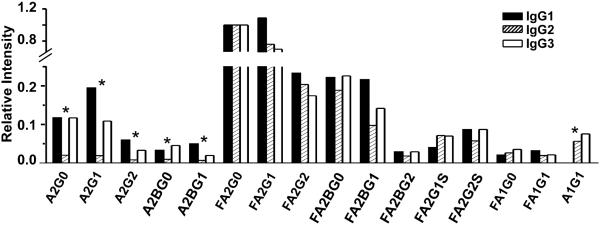
Fig. 2.

Changes in IgG subclass-specific glycoforms in liver disease. Average intensity (mean±SEM) of indicated glycoforms in three patient groups: A. IgG1 (n=5 per group), B. IgG2, CTRL (n=5), CIR (n=5), HCC (n=4); C. IgG3, CTRL (n=4), CIR (n=3), HCC (n=4); D. IgG4, CTRL (n=4), HCC (n=4).
Affinity separation of IgG3 allowed us to compare IgG2 glycoforms in all patient samples except one HCC patient with high IgG3 contamination. The changes in the glycoforms of the IgG2 subclass are quite consistent with the changes in IgG1 which is in contrast to the trends in quantitative changes of these IgG subclasses in the disease context (Figure 1). Overall, of the 9 quantified glycoforms of IgG2, three glycoforms (FA2G0, FA2G2, and FA2BG0) showed significant difference among the three groups (Figure 2B). The FA2G0 and FA2BG0 glycoforms again nearly double in liver disease (cirrhosis and HCC) compared to healthy controls.
Though the isolated IgG3 was confirmed to have high purity, the differences in genotype (Supplementary Table S4) complicate quantitative analysis. Among the 15 participants, three carry “Y” alleles, seven “F” alleles, and five are heterozygous. Further analysis showed that, four of the heterozygous participants express mainly the glycopeptide corresponding to IgG2 (F genotype). Thus, these participants were grouped with the F genotype homozygotes for the study of IgG3 glycoforms because they could be reliably normalized to the subclass specific peptide. Participants with “Y” genotype were not included in the comparison because of the normalization issue. We were able to quantify 11 glycoforms in all IgG3 samples of which seven show quantitative differences between groups (Figure 2C). The FA2G0 again approximately doubles in cirrhosis compared to controls and further increases in HCC compared to cirrhosis. We do not see a significant decrease in FA2G2 but FA2BG0 approximately doubles in cirrhosis and HCC. In addition, we observe significant increase in FA2G1, FA2BG1, and FA2G1S. In spite of these differences, the overall trend in the quantitative changes is similar to IgG1.
IgG4 is the least abundant immunoglobulin in the family. After excluding the participants carrying IgG3 genotype which interferes with IgG4 glycopeptide and the participants with IgG4 too low to quantify, there are only two participants left in the CIR group. Hence, glycosylation was compared only between the HCC and control groups. We were able to quantify seven glycoforms of IgG4, five of which differ significantly between the two groups (Figure 2D). The increases in FA2G0 and FA2BG0 together with decrease in FA2G2 are again the dominant changes in liver disease context.
While major focus of our analysis is the quantitative comparison of subclass-specific glycoforms between disease groups, we have also evaluated whether glycoforms differ substantially between the subclasses of individual participant. As described above, the general trend for changes in glycorforms between groups is similar across the subclasses of IgG1-4. Overall, all the IgG have more than 85% of their glycoforms core fucosylated and distribution of the fucosylated glycoforms among IgG subclasses is similar. However, principal component analysis of the major contributors to differences between the subclasses showed that the non-fucosylated glycoforms are different (Figure 3). The glycoform profiles of IgG1 and IgG3 are similar with the exception of A1G1, which was not detectable in IgG1. But in the case of IgG2, all the non-fucosylated glycoforms except A1G1 are barely detectable.
Fig. 3.
Contribution of specific glycoforms to variability between IgG subclasses. Indicated glycoforms of IgG1, 2 and 3 were compared in intensity in a healthy control participant. Glycoform intensities for each subclass were normalized to intensity of glycoform FA2G0 in the same IgG subclass and analyzed by principal component analysis. *: glycoforms that significantly contribute to differences among IgG subclasses.
In summary, the most noticeable glycosylation differences observed in all IgG subclasses was the liver disease-related increase in core fucosylated a-galactosylated glycoforms with or without bisecting GlcNAc. The bisected glycoform FA2BG0 is also elevated in the case of all IgG subclasses, but its galactosylated forms (FA2BG1 and FA2BG2) do not, in general, differ between study groups. Glycans without core fucose (A2G0, A2G1, A2G2) are of low intensity and quantifiable reliably only in case of IgG1; here the trend toward increase in A2G0 in liver disease is insignificant even though A2G2 remains higher in healthy controls.
Discussion
Recent studies show that modified N-glycosylation of immunoglobulins accompanies development of liver fibrosis and cirrhosis [15;17]. Immunoglobulins, besides liver secreted proteins, are the major constituent of the blood N-glycoproteome and reflect the changes associated with the progression of chronic viral infection to liver disease [16;22]. Liver damage in chronic HCV is typically considered immune system mediated because HCV itself is not cytopathic [12]. Immunotoxicity is a complex process which includes antibody dependent cellular cytotoxicity (ADCC) found to be associated with antibodies to E2 envelope glycoprotein at all stages of HCV infection [13]. The effector function of immunoglobulins heavily depends on their glycosylation [19;33]. This is connected, at least in part, to changes in structure of the Fc-region of Ig that depends on the type of glycan occupying the conserved N297 sequon [34].
It was shown that both quantities of IgG, IgA, and IgM and their glycoforms change in chronic viral infections and resulting liver disease [5;6;17;22]. But changes in glycoforms of specific subclasses of IgG in the context of liver disease remain undefined. We have therefore optimized LC-MS-MRM methods for quantification of immunoglobulins and subclass-specific IgG glycoforms for this pilot study of liver disease. LC-MS-MRM is the method of choice for mass spectrometric quantification of proteins [30;35;36]; our and other laboratories documented their utility for quantification of site-specific protein glycoforms [27;37-39]. We introduce unique peptides (Supplementary Table S1) to represent each immunoglobulin class and use the two stage mass selection (precursor and specific product ions) to achieve specific and sensitive Ig quantification in the complex plasma background (Supplementary Figure S1). Our results (Figure 1) confirm previously reported increase in plasma concentration of IgG1, IgG3, IgA1, and IgM in liver disease of HCV etiology [6]. We also detect HCC-specific increase in IgG1 and IgM, as well as decrease in IgG2, compared to cirrhosis but the known variability of Ig plasma concentrations and small sample size mean that sampling variation cannot be excluded. It is, however, interesting to compare the trends in quantity of IgG with the trends in the changes of site specific IgG1-4 glycoforms described below. Correlation analysis indicates a positive correlation between IgG1 and IgG3 with spearman correlation coefficient 0.46 (p<0.01). This might reflect co-regulation of the genes co-localized on chromosome 14 but separated from IgG2 and IgG4 [7].
Quantitative LC/MS methods for analysis of glycoforms of IgG1-4 subclasses have been recently reported [32;40;41]. High reproducibility of these LC-MS methods was documented on a study of pregnancy that showed increased galactosylation and sialylation of IgG in first two trimesters of pregnancy but did not detect differences between the IgG1-4 subclasses [32]. We now apply our optimized LC-MS-MRM methods, for the first time, to the analysis of site-specific glycoforms of IgG1-4 in liver cirrhosis and HCC. In our approach, we quantify the dominant oxonium ions (glycan fragments) but monitor also peptide-GlcNAc fragment to assure specificity of detection, as described previously [27]. This analysis is optimized to quantify differences between disease groups and is not designed to compare distribution of glycoforms (profile) within a group. The site specific glycoform quantification is achievable but polymorphisms of the IgG3 complicates analysis [42]. Thirteen G3m allotypes have been characterized on the constant CH2 and CH3 domains of IgG3 heavy chain and their allele frequency varies in different populations (Supplementary Figure S2). The related amino acid substitutions lead to 3 different sequences around the N-glycosylation site on IgG3 heavy chain: 1) EEQYNSTFR (isobaric of IgG4); 2) EEQFNSTFR (same as IgG2); or 3) TKPWEEQYNSTFR [18]. This complicates separation of the IgG2, 3 and 4 glycoforms based on the sequence phenotype (Supplementary Figure S4). We have therefore genotyped the participants and developed purification strategy based on protein-A affinity and mouse anti-human IgG3 magnetic beads (Scheme 1) to separate, at the protein level, IgG3 from the rest of IgGs [5]. This allowed us to complete quantification of IgG1-4 glycoforms but on a somewhat limited number of samples (Figure 2) because glycopeptide sequences could not be resolved for some samples (Supplementary Table S4-S5).
Our analysis showed that a-galactosylated core fucosylated glycoforms dominate the site-specific glycoform change in the liver disease context in all IgG subclasses (Figure 2), which is consistent with the previously reported measurement carried out on total IgG [17;22]. The most significant increase in the HCC and CIR groups is associated with FA2G0 glycoform. This change dominates the disease-related alterations and seems to be driven by the loss of galactose rather than increase in fucosylation as the FA2G2 glycoform increases in intensity in healthy controls across most of the comparison groups and subclasses (Figure 2). However, increase in the non-fucosylated biantennary a-galactosylated glycan A2G0 in IgG1 and IgG3 is much lower (if any) compared to the FA2G0 glycoform and some increase in fucosylation in liver disease was detectable. Degree of fucosylation increased in IgG1 (84±5% healthy controls, 89±3% CIR, and 93±3% HCC) and IgG3 (79±4% healthy controls, 90+9% CIR and 92±4% HCC) but remained constant and high in IgG2 (94±1% healthy controls, 96±2% CIR, and 96±1% HCC). Only fucosylated glycoforms were detected in the low abundant IgG4. Sialylation of the glycans is overall low and we did not find significant trends in the degree of glycoform sialylation. However, sialylated glycoforms A2G1S and A2G2S were clearly detected in IgG3 controls but not in CIR and HCC samples, suggesting decreased sialylation of IgG3 in liver disease (data not shown). These two glycoforms were not or marginally detectable in IgG2 and IgG1 samples of all study groups.
Specific glycoforms of IgG were associated with distinct functions [19]. Sialylation of the galactosylated N297 glycan shifts the structure between “open” and “closed” conformations which leads to altered (co)receptor interactions and downstream anti-inflammatory signaling [34;43]. One of the major reasons for loss of sialylation is a-galactosylation of IgG (sialic acid is attached to the galactose). A-galactosylation is associated with several chronic inflammatory diseases including rheumatoid arthritis [44], Crohn’s disease [45], or viral liver disease [17]. Loss of galactose leads to binding of mannan binding lectin and could contribute to pathogenesis by activation of the complement pathway [19;46]. Alternatively, anti-inflammatory activity of IgG has recently been associated with galactosylation-mediated modulation of interaction with FcγRIIB and dectin-1, a C-type human lectin highly expressed on dendritic cells [47]. Thus pro-inflammatory glycoforms of IgG increase significantly in liver disease and could contribute to the progressing disease phenotype.
Core fucosylation is another recognized modulator of IgG interactions with Fc receptors. Core fucosylation leads to reduced binding to FcγR3A and decreased ADCC [48]. Importance of this regulatory step drives glyco-engineering of core fucosylation on therapeutic antibodies [49;50] . In contrast to fucosylation, bisecting GlcNAc increases ADCC responses but this type of glycosylation of IgG is less common than the core fucosylation[18]. While we observe some change in overall fucosylation of the glycoforms of IgG1 and IgG3 which could modify ADCC, the degree of fucosylation is already high in controls and the changes are less pronounced than the disease-related loss of galactose.
Conclusions
In the current study, we have optimized LC-MS-MRM methods for quantification of immunoglobulins and site specific IgG1-4 glycoforms. Pilot study of liver cirrhosis and hepatocellular carcinoma confirms that our methods detect previously reported disease-related increase in IgG1, IgG3, IgA1, and IgM compared to healthy controls. While disease-related changes in quantities of IgG are subclass-specific, the changes in a-galactosylated FA2G0 and FA2BG0 glycoforms is uniform across IgG1-4 subclasses. Differences in degree of fucosylation and differences in some minor glycoforms, especially non-fucosylated glycoforms, were detected between the IgG2 subclass compared to the IgG1 and 3. The pro-inflammatory a-galactosylated glycoforms dominate the re-distribution associated with cirrhosis and HCC and could contribute to liver disease progression of HCV etiology.
Supplementary Material
Significance.
We have demonstrated that both quantities and glycoforms of immunoglobulin subclasses change significantly in liver disease progression to HCC through quantitative study of immunoglobulin subclasses and their site specific glycoforms using a sensitive and selective LC-MS-MRM method. Redistribution of the glycoforms of specific immunoglobulin subclasses could have important implications for receptor mediated responses affecting progression of liver disease.
Highlights.
We quantified plasma immunogloblulins and site specific glycoforms of IgG 1-4 subclasses in liver disease progression to HCC.
Increased galactose-deficient core fucosylated glycoforms were consistently observed in CIR and HCC patients.
Increased degree of fucosylation were detected in the IgG1 and IgG3 glycoforms.
Both quantities and glycoforms of immunoglobulins change significantly in liver disease progression to HCC.
Acknowledgements
This work was supported by National Institutes of Health U01 CA168926, UO1 CA171146, RO1 CA135069 to R. G., P30 CA51008 to the Lombardi Comprehensive Cancer Center supporting the Proteomics and Metabolomics Shared Resource, R21-CA141285 to J.K., P30-CA-076292 to Moffitt Cancer Center. We thank Elizabeth Wood for peptide synthesis. Standard peptides were quantified by amino acid analysis by Virginia Johnson and Larry Dangott at the Protein Chemistry Laboratory of Texas A&M University.
Footnotes
Publisher's Disclaimer: This is a PDF file of an unedited manuscript that has been accepted for publication. As a service to our customers we are providing this early version of the manuscript. The manuscript will undergo copyediting, typesetting, and review of the resulting proof before it is published in its final citable form. Please note that during the production process errors may be discovered which could affect the content, and all legal disclaimers that apply to the journal pertain.
Conflict of Interest
All the authors have declared no conflict of interest.
Reference List
- [1].El-Serag HB, Kanwal F. Epidemiology of Hepatocellular Carcinoma in the United States: Where Are We? Where Do We Go? Hepatology. 2014 doi: 10.1002/hep.27222. [DOI] [PMC free article] [PubMed] [Google Scholar]
- [2].Parkin DM, Bray F, Ferlay J, Pisani P. Global cancer statistics, 2002. CA Cancer J Clin. 2005;55:74–108. doi: 10.3322/canjclin.55.2.74. [DOI] [PubMed] [Google Scholar]
- [3].Altekruse SF, McGlynn KA, Reichman ME. Hepatocellular carcinoma incidence, mortality, and survival trends in the United States from 1975 to 2005. J Clin Oncol. 2009;27:1485–91. doi: 10.1200/JCO.2008.20.7753. [DOI] [PMC free article] [PubMed] [Google Scholar]
- [4].Perz JF, Armstrong GL, Farrington LA, Hutin YJ, Bell BP. The contributions of hepatitis B virus and hepatitis C virus infections to cirrhosis and primary liver cancer worldwide. J Hepatol. 2006;45:529–38. doi: 10.1016/j.jhep.2006.05.013. [DOI] [PubMed] [Google Scholar]
- [5].Meulenbroek AJ. Human IgG subclasses: useful diagnostic markers for immunocompetence. Amsterdam: Sanquin; 2008 [Google Scholar]
- [6].Watt K, Uhanova J, Gong Y, et al. Serum immunoglobulins predict the extent of hepatic fibrosis in patients with chronic hepatitis C virus infection. J Viral Hepat. 2004;11:251–6. doi: 10.1111/j.1365-2893.2004.00507.x. [DOI] [PubMed] [Google Scholar]
- [7].Musset L, Lunel F, Cacoub P, et al. Increased serum immunoglobulin G1 levels in hepatitis C virus infection. Hepatology. 1995;21:1755–7. [PubMed] [Google Scholar]
- [8].Pontisso P, Quarta S, Caberlotto C, et al. Progressive increase of SCCA-IgM immune complexes in cirrhotic patients is associated with development of hepatocellular carcinoma. Int J Cancer. 2006;119:735–40. doi: 10.1002/ijc.21908. [DOI] [PubMed] [Google Scholar]
- [9].Law M, Maruyama T, Lewis J, et al. Broadly neutralizing antibodies protect against hepatitis C virus quasispecies challenge. Nat Med. 2008;14:25–7. doi: 10.1038/nm1698. [DOI] [PubMed] [Google Scholar]
- [10].Ball JK, Tarr AW, McKeating JA. The past, present and future of neutralizing antibodies for hepatitis C virus. Antiviral Res. 2014;105:100–11. doi: 10.1016/j.antiviral.2014.02.013. [DOI] [PMC free article] [PubMed] [Google Scholar]
- [11].Kong L, Giang E, Nieusma T, et al. Hepatitis C virus E2 envelope glycoprotein core structure. Science. 2013;342:1090–4. doi: 10.1126/science.1243876. [DOI] [PMC free article] [PubMed] [Google Scholar]
- [12].Spengler U, Nattermann J. Immunopathogenesis in hepatitis C virus cirrhosis. Clin Sci (Lond) 2007;112:141–55. doi: 10.1042/CS20060171. [DOI] [PubMed] [Google Scholar]
- [13].Nattermann J, Schneiders AM, Leifeld L, et al. Serum antibodies against the hepatitis C virus E2 protein mediate antibody-dependent cellular cytotoxicity (ADCC) . J Hepatol. 2005;42:499–504. doi: 10.1016/j.jhep.2004.12.018. [DOI] [PubMed] [Google Scholar]
- [14].Balagopal A, Philp FH, Astemborski J, et al. Human immunodeficiency virus-related microbial translocation and progression of hepatitis C. Gastroenterology. 2008;135:226–33. doi: 10.1053/j.gastro.2008.03.022. [DOI] [PMC free article] [PubMed] [Google Scholar]
- [15].Mehta AS, Long RE, Comunale MA, et al. Increased levels of galactose-deficient anti-Gal immunoglobulin G in the sera of hepatitis C virus-infected individuals with fibrosis and cirrhosis. J Virol. 2008;82:1259–70. doi: 10.1128/JVI.01600-07. [DOI] [PMC free article] [PubMed] [Google Scholar]
- [16].Klein A, Michalski JC, Morelle W. Modifications of human total serum N-glycome during liver fibrosis-cirrhosis, is it all about immunoglobulins? Proteomics Clin Appl. 2010;4:372–8. doi: 10.1002/prca.200900151. [DOI] [PubMed] [Google Scholar]
- [17].Vanderschaeghe D, Laroy W, Sablon E, et al. GlycoFibroTest Is a Highly Performant Liver Fibrosis Biomarker Derived from DNA Sequencer-based Serum Protein Glycomics. Mol Cell Proteomics. 2009;8:986–94. doi: 10.1074/mcp.M800470-MCP200. [DOI] [PMC free article] [PubMed] [Google Scholar]
- [18].Zauner G, Selman MH, Bondt A, et al. Glycoproteomic analysis of antibodies. Mol Cell Proteomics. 2013;12:856–65. doi: 10.1074/mcp.R112.026005. [DOI] [PMC free article] [PubMed] [Google Scholar]
- [19].Arnold JN, Wormald MR, Sim RB, Rudd PM, Dwek RA. The impact of glycosylation on the biological function and structure of human immunoglobulins. Annu Rev Immunol. 2007;25:21–50. doi: 10.1146/annurev.immunol.25.022106.141702. [DOI] [PubMed] [Google Scholar]
- [20].Krapp S, Mimura Y, Jefferis R, Huber R, Sondermann P. Structural analysis of human IgG-Fc glycoforms reveals a correlation between glycosylation and structural integrity. J Mol Biol. 2003;325:979–89. doi: 10.1016/s0022-2836(02)01250-0. [DOI] [PubMed] [Google Scholar]
- [21].Rudd PM, Elliott T, Cresswell P, Wilson IA, Dwek RA. Glycosylation and the immune system. Science. 2001;291:2370–6. doi: 10.1126/science.291.5512.2370. [DOI] [PubMed] [Google Scholar]
- [22].Klein A, Carre Y, Louvet A, Michalski JC, Morelle W. Immunoglobulins are the major glycoproteins involved in the modifications of total serum N-glycome in cirrhotic patients. Proteomics Clin Appl. 2010;4:379–93. doi: 10.1002/prca.200900133. [DOI] [PubMed] [Google Scholar]
- [23].Shade KT, Anthony R. Antibody Glycosylation and Inflammation. Antibodies. 2013;2:392–414. [Google Scholar]
- [24].Bekesova S, Kosti O, Chandler KB, et al. N-glycans in liver-secreted and immunoglogulin-derived protein fractions. J Proteomics. 2012;75:2216–24. doi: 10.1016/j.jprot.2012.01.024. [DOI] [PMC free article] [PubMed] [Google Scholar]
- [25].Tissandie E, Morelle W, Berthelot L, et al. Both IgA nephropathy and alcoholic cirrhosis feature abnormally glycosylated IgA1 and soluble CD89-IgA and IgG-IgA complexes: common mechanisms for distinct diseases. Kidney Int. 2011;80:1352–63. doi: 10.1038/ki.2011.276. [DOI] [PubMed] [Google Scholar]
- [26].Balbin M, Grubb A, de Lange GG, Grubb R. DNA sequences specific for Caucasian G3m(b) and (g) allotypes: allotyping at the genomic level. Immunogenetics. 1994;39:187–93. doi: 10.1007/BF00241259. [DOI] [PubMed] [Google Scholar]
- [27].Sanda M, Pompach P, Brnakova Z, Wu J, Makambi K, Goldman R. Quantitative liquid chromatography-mass spectrometry-multiple reaction monitoring (LC-MS-MRM) analysis of site-specific glycoforms of haptoglobin in liver disease. Mol Cell Proteomics. 2013;12:1294–305. doi: 10.1074/mcp.M112.023325. [DOI] [PMC free article] [PubMed] [Google Scholar]
- [28].Remily-Wood ER, Benson K, Baz RC, et al. Quantification of peptides from immunoglobulin constant and variable regions by liquid chromatography-multiple reaction monitoring mass spectrometry for assessment of multiple myeloma patients. Proteomics Clin Appl. 2014 doi: 10.1002/prca.201300077. [DOI] [PMC free article] [PubMed] [Google Scholar]
- [29].Remily-Wood ER, Koomen JM. Evaluation of protein quantification using standard peptides containing single conservative amino acid replacements. J Mass Spectrom. 2012;47:188–94. doi: 10.1002/jms.2053. [DOI] [PMC free article] [PubMed] [Google Scholar]
- [30].Hagman C, Ricke D, Ewert S, Bek S, Falchetto R, Bitsch F. Absolute quantification of monoclonal antibodies in biofluids by liquid chromatography-tandem mass spectrometry. Anal Chem. 2008;80:1290–6. doi: 10.1021/ac702115b. [DOI] [PubMed] [Google Scholar]
- [31].Stadlmann J, Pabst M, Kolarich D, Kunert R, Altmann F. Analysis of immunoglobulin glycosylation by LC-ESI-MS of glycopeptides and oligosaccharides. Proteomics. 2008;8:2858–71. doi: 10.1002/pmic.200700968. [DOI] [PubMed] [Google Scholar]
- [32].Selman MHJ, Derks RJE, Bondt A, et al. Fc specific IgG glycosylation profiling by robust nano-reverse phase HPLC-MS using a sheath-flow ESI sprayer interface. J Proteomics. 2012;75:1318–29. doi: 10.1016/j.jprot.2011.11.003. [DOI] [PubMed] [Google Scholar]
- [33].Ackerman ME, Crispin M, Yu X, et al. Natural variation in Fc glycosylation of HIV-specific antibodies impacts antiviral activity. J Clin Invest. 2013;123:2183–92. doi: 10.1172/JCI65708. [DOI] [PMC free article] [PubMed] [Google Scholar]
- [34].Sondermann P, Pincetic A, Maamary J, Lammens K, Ravetch JV. General mechanism for modulating immunoglobulin effector function. Proc Natl Acad Sci U S A. 2013;110:9868–72. doi: 10.1073/pnas.1307864110. [DOI] [PMC free article] [PubMed] [Google Scholar]
- [35].Barnidge DR, Dratz EA, Martin T, Bonilla LE, Moran LB, Lindall A. Absolute quantification of the G protein-coupled receptor rhodopsin by LC/MS/MS using proteolysis product peptides and synthetic peptide standards. Anal Chem. 2003;75:445–51. doi: 10.1021/ac026154+. [DOI] [PubMed] [Google Scholar]
- [36].Anderson L, Hunter CL. Quantitative mass spectrometric multiple reaction monitoring assays for major plasma proteins. Mol Cell Proteomics. 2006;5:573–88. doi: 10.1074/mcp.M500331-MCP200. [DOI] [PubMed] [Google Scholar]
- [37].Sanda M, Pompach P, Benicky J, Goldman R. LC-MS3 quantification of O-glycopeptides in human serum. Electrophoresis. 2013;34:2342–9. doi: 10.1002/elps.201200658. [DOI] [PMC free article] [PubMed] [Google Scholar]
- [38].Toyama A, Nakagawa H, Matsuda K, Sato TA, Nakamura Y, Ueda K. Quantitative structural characterization of local N-glycan microheterogeneity in therapeutic antibodies by energy-resolved oxonium ion monitoring. Anal Chem. 2012;84:9655–62. doi: 10.1021/ac3023372. [DOI] [PubMed] [Google Scholar]
- [39].Hong Q, Lebrilla CB, Miyamoto S, Ruhaak LR. Absolute quantitation of immunoglobulin G and its glycoforms using multiple reaction monitoring. Anal Chem. 2013;85:8585–93. doi: 10.1021/ac4009995. [DOI] [PMC free article] [PubMed] [Google Scholar]
- [40].Einarsdottir HK, Selman MH, Kapur R, et al. Comparison of the Fc glycosylation of fetal and maternal immunoglobulin G. Glycoconj J. 2013;30:147–57. doi: 10.1007/s10719-012-9381-6. [DOI] [PMC free article] [PubMed] [Google Scholar]
- [41].Ladwig PM, Barnidge DR, Snyder MR, Katzmann JA, Murray DL. Quantification of serum IgG subclasses by use of subclass-specific tryptic peptides and liquid chromatography-tandem mass spectrometry. Clin Chem. 2014;60:1080–8. doi: 10.1373/clinchem.2014.222208. [DOI] [PubMed] [Google Scholar]
- [42].Lefranc MP, Lefranc G. Human Gm, Km, and Am allotypes and their molecular characterization: a remarkable demonstration of polymorphism. Methods Mol Biol. 2012;882:635–80. doi: 10.1007/978-1-61779-842-9_34. [DOI] [PubMed] [Google Scholar]
- [43].Anthony RM, Ravetch JV. A novel role for the IgG Fc glycan: the anti-inflammatory activity of sialylated IgG Fcs. J Clin Immunol. 2010;30(Suppl 1):S9–14. doi: 10.1007/s10875-010-9405-6. [DOI] [PubMed] [Google Scholar]
- [44].Parekh RB, Dwek RA, Sutton BJ, et al. Association of rheumatoid arthritis and primary osteoarthritis with changes in the glycosylation pattern of total serum IgG. Nature. 1985;316:452–7. doi: 10.1038/316452a0. [DOI] [PubMed] [Google Scholar]
- [45].Tomana M, Schrohenloher RE, Koopman WJ, Alarcon GS, Paul WA. Abnormal glycosylation of serum IgG from patients with chronic inflammatory diseases. Arthritis Rheum. 1988;31:333–8. doi: 10.1002/art.1780310304. [DOI] [PubMed] [Google Scholar]
- [46].Malhotra R, Wormald MR, Rudd PM, Fischer PB, Dwek RA, Sim RB. Glycosylation changes of IgG associated with rheumatoid arthritis can activate complement via the mannose-binding protein. Nat Med. 1995;1:237–43. doi: 10.1038/nm0395-237. [DOI] [PubMed] [Google Scholar]
- [47].Karsten CM, Pandey MK, Figge J, et al. Anti-inflammatory activity of IgG1 mediated by Fc galactosylation and association of FcgammaRIIB and dectin-1. Nat Med. 2012;18:1401–6. doi: 10.1038/nm.2862. [DOI] [PMC free article] [PubMed] [Google Scholar]
- [48].Shields RL, Lai J, Keck R, et al. Lack of fucose on human IgG1 N-linked oligosaccharide improves binding to human Fcgamma RIII and antibody-dependent cellular toxicity. J Biol Chem. 2002;277:26733–40. doi: 10.1074/jbc.M202069200. [DOI] [PubMed] [Google Scholar]
- [49].Jefferis R. Glycosylation as a strategy to improve antibody-based therapeutics. Nat Rev Drug Discov. 2009;8:226–34. doi: 10.1038/nrd2804. [DOI] [PubMed] [Google Scholar]
- [50].Abes R, Teillaud L-L. Impact of Glycosylation on Effector Functions of Therapeutic IgG. Pharmaceuticals. 2010;3:146–57. doi: 10.3390/ph3010146. [DOI] [PMC free article] [PubMed] [Google Scholar]
Associated Data
This section collects any data citations, data availability statements, or supplementary materials included in this article.