Abstract
A useful extension to SWIFT (SWeep Imaging with Fourier Transformation) utilizing sidebands of the excitation pulse is introduced. This MRI method, called Multi-Band-SWIFT, achieves much higher bandwidth than standard SWIFT by using multiple segmented excitations (bands) of the field of view. A description of the general idea and variants of the pulse sequence are presented. From simulations and semi-phenomenological theory, estimations of power deposition and signal-to-noise ratio are made. MB-SWIFT and ZTE (zero-TE) sequences are compared based on images of a phantom and human mandible. Multi-Band-SWIFT provides a bridge between SWIFT and ZTE sequences and allows greatly increased excitation and acquisition bandwidths relative to standard SWIFT for the same hardware switching parameters and requires less peak amplitude of the radiofrequency field (or greater flip angle at same peak amplitude) as compared to ZTE. Multi-Band-SWIFT appears to be an attractive extension of SWIFT for certain musculoskeletal and other medical imaging applications, as well as for imaging materials.
Keywords: MRI, spectroscopy, sweep imaging, UTE, SWIFT, ZTE, DANTE
INTRODUCTION
The range of transverse relaxation times (T2) in human tissues covers about six orders of magnitude, from microseconds (e.g., bound water, macromolecular protons), up to seconds (e.g., extracellular fluid) [1, 2]. The width of this T2 distribution and its mean depend on characteristics of the tissues. Moreover, local magnetic field inhomogeneity increases the effective transverse relaxivity, which results in T2* values shorter than T2. For spin echo (SE) and gradient echo (GRE) MRI sequences, the minimal “echo” time (TE) interval between the excitation of spins and the acquisition of the signal is in the millisecond range. The decay during this TE interval “filters” the short T2 portion of the signal and that is why most GRE and SE images have some T2 weighting (even those which are called T1 weighted). Tissues having short mean T2 values (such as cortical bone, tendons, teeth, ligaments, and menisci) or tissues exposed to large susceptibility gradients (such as lung parenchyma and tissue located adjacent to a metallic implant) appear hypointense or as voids in images acquired with GRE and SE sequences. To be used clinically for diagnosis and therapy monitoring, the tissues of interest must be visible by MRI, before there can be any chance of assessing spin density or relaxation parameters that can change in disease states [3]. During the last decade, this need has created an interest in MRI methods that increase the range of detectable T2 values [4]. All of these methods utilize radial readout techniques and are designed to minimize the time delay between excitation of spins and starting an acquisition. There are at least four different short T2-sensitive MRI methods applicable for imaging of humans, which are: a) ultra-short TE (UTE) [5–8], b) sweep imaging with Fourier transformation (SWIFT) [9–12], c) FID-projection imaging, also called BLAST, RUFIS, WASPI, or zero TE (ZTE) [13–17], and d) ZTE combined with Single Point Imaging (SPI) called PETRA [18].
A pulse sequence used for diagnostic imaging usually excites the spins of the tissue or organ of interest to an optimal flip angle and then all excited spins during an acquisition time (limited by T2*) must accumulate enough phase to be spatially resolved. To satisfy these two requirements for short-T2* spins, excitation and acquisition bandwidths must be increased along with the strength of the frequency encoding (readout) gradient. While simple, in practice these requirements may not be easily satisfied. In ZTE and SWIFT sequences the excitation pulse is applied in the presence of a readout gradient and therefore should be broad band enough to cover the entire field of view (FOV) at the readout bandwidth. The excitation bandwidth of the square pulse used in ZTE is inversely proportional to the length of the pulse. Therefore increasing the excitation bandwidth requires increasing the amplitude of the RF pulse which is limited by RF hardware (peak amplifier power or arcing voltage). SWIFT and UTE are less prone to this restriction, because in SWIFT longer frequency-swept pulses are used and in UTE the excitation pulse is applied before ramping the gradients and therefore the excitation bandwidth must only cover the natural (T2*-broadened) resonance lines of the spins. At the same time ZTE has fewer problems during readout relative to UTE or SWIFT. In the UTE sequence the “bottle neck” is the duration of gradient ramping time, which is difficult to shorten due to the power limitation to overcome the inductance of the gradient coils, as well as the generation of eddy currents. With standard gapped SWIFT, coil ring down and transmit/receive (T/R) switching times often restrict the practically obtainable bandwidth. Continuous SWIFT [19] and related schemes [20] allowing true simultaneous acquisition and excitation do not have this problem, but are not considered here because these approaches are still yet to be developed for in vivo use. Thus for various reasons, all existing sequences are limited to a maximum achievable bandwidth which may be insufficient to resolve all excited short T2 signals and/or to avoid off-resonance artifacts (blurring) in radial imaging. Recently the potential of ZTE for imaging in humans was explored, and it was shown that ZTE could be used with ultra-high excitation and acquisition bandwidths currently not possible to attain with other techniques [21]. Although the images presented are impressive, they could be improved if there was a way to avoid the RF amplitude limitation, which results in lower than optimal signal to noise ratio (SNR) and uneven excitation of the object [12].
We have found that a DANTE (Delays Alternating with Nutations for Tailored Excitation) [22] -like multiband excitation which covers a much larger bandwidth while using relatively small average power can overcome the above mentioned limitations [23]. To explore this multiband approach, we modified the gapped SWIFT method which always excites sidebands and allows flexible manipulation of the amplitudes and widths of these sidebands. We call this new method Multi-Band-SWIFT (MB-SWIFT). In contrast to other methods using DANTE-like excitation, for example BURST [24] and its modifications [25], in MB-SWIFT the acquisition occurs virtually simultaneously with excitation, which makes this sequence sensitive to short T2 spins. The use of multiple excitation bands in MB-SWIFT is the principal feature that distinguishes it from SWIFT which excites bands outside of the field of view, but uses only the baseband to produce an image. We present here a description of the MB-SWIFT sequence, which yields increased efficiency at high bandwidths relative to other ultra-short T2 sensitive methods.
THEORY
Description of the MB-SWIFT sequence
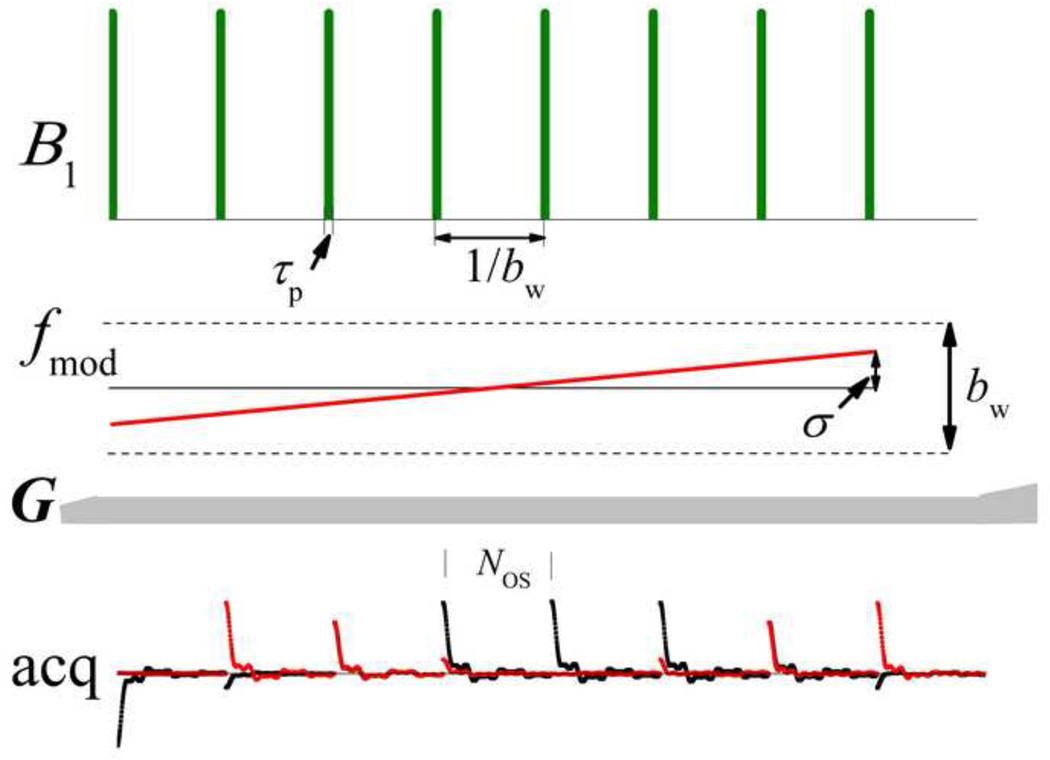
The schematic in Fig. 1 depicts a single projection-block of the MB-SWIFT sequence. Only the gradient orientation changes from projection to projection. In this example, a chirp pulse is used. As compared with the original SWIFT pulse, here we use fewer gaps, NG, which greatly reduces the transmitter duty cycle, dc, by keeping the pulse duration approximately similar. Here dc = τpbw, and bw is the width of the nominal baseband and τp is the duration of sub-pulse elements. In addition, the method uses a higher acquisition oversampling value, NOS, which is equal to the number of samples in each gap. The amplitude of the frequency modulation, σ, in the MB-SWIFT sequence is variable in the range 0 ≤ σ ≤ bw/2, which is different from the original SWIFT method where σ is usually fixed and equal to bw/2.
Fig. 1.
Schematic of one projection-block of the MB-SWIFT sequence using a chirp pulse and NG = 8, NOS = 256, and σ = bw/4.
The gapped excitation creates sidebands with amplitudes given by
| [1] |
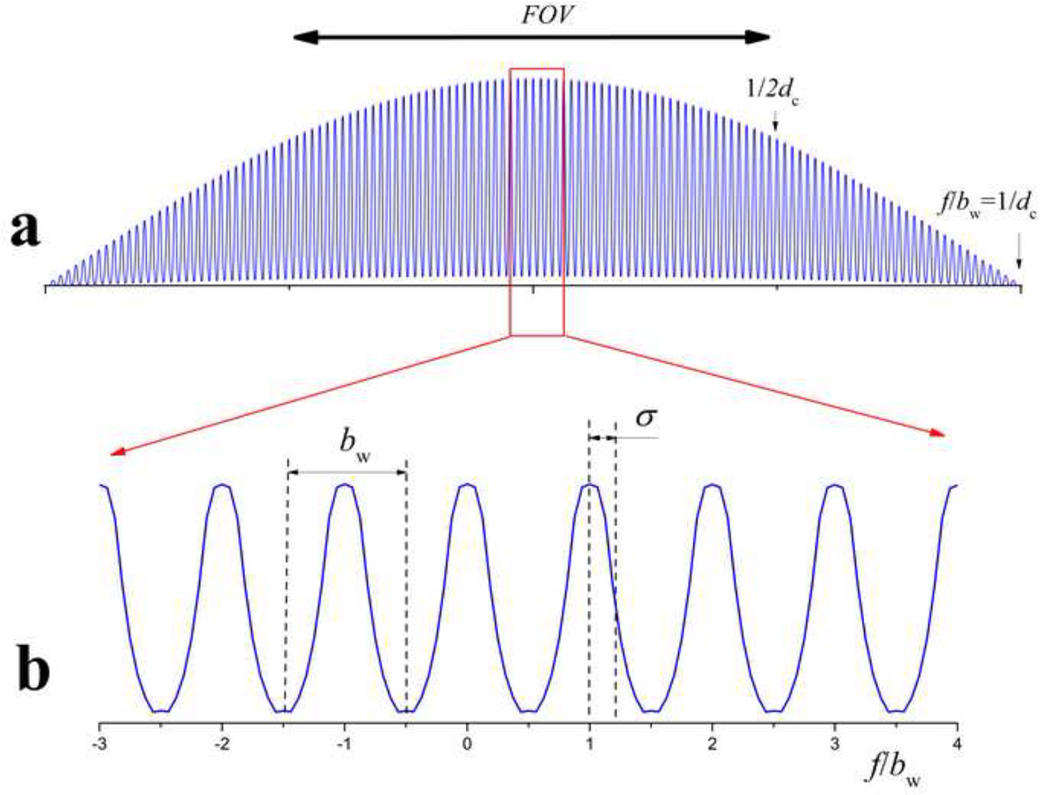
where m is the sideband order [26]. The concept underlying MB-SWIFT involves using many sidebands, which distinguishes this method from regular SWIFT using only the baseband to excite the field of view containing the object. In the simplest version of MB-SWIFT, bw is matched to the linear width of the voxel (in frequency unit); i.e., the number of discrete frequencies resolved, N, is equal to the number of sidebands covering the linear size of the FOV, and N = NOS. The magnitude spectrum of the gapped excitation profile is shown in Fig. 2. The case presented in the figure is σ < bw/2, whereby the profile looks like a comb. The abscissa is frequency normalized by bw. The integer part of f/bw is equal to the corresponding sideband’s order (m). According to Eq. 1, Am = 0 for m = int(1/dc). For imaging and especially for steady state imaging, it is important to keep the excitation as uniform as possible throughout the FOV [12]. In the case of a square pulse, for example, the desirable excitation bandwidth (matched with FOV), with <5% falloff at the edges of bandwidth, is equal to 1/3 of the inverse length of the pulse [26, 27]. In the practical implementation of the ZTE sequence, due to limited RF amplitude, this requirement is frequently violated in order to increase the flip angle [21]. Here, for simplicity, we choose a bandwidth equal to the inverse length of the pulse. Accordingly, in the case of MB-SWIFT, τp should be chosen as τp = 1/(Nbw). In this case, the used maximum sideband’s order is equal to mmax = int(1/(2dc)), which defines the edges of the FOV, as shown in Fig. 2.
Fig. 2.
Frequency excitation profile (the magnitude of FT of pulse function) of the MB-SWIFT sequence.
Thus, the excitation profile of MB-SWIFT is not continuous, but instead consists of multiple bands (or strips) across the object, similar to those produced in DANTE, and BURST sequences [22, 25]. The width of the excited strips is equal to or smaller than the linear size of the voxel and can be altered according to the relation between σ and bw. Due to the relationship between time window and resolution [28], the width of the strips cannot be smaller than 1/Tp, where Tp = NG/bw is the total pulse length. Thus, the excited fraction of the voxel, p, can be estimated as p = (2σ + bw/NG)/bw = (2σNG/bw + 1)/NG. So, the smallest excited fraction occurs when σ = 0 and is simply 1/NG.
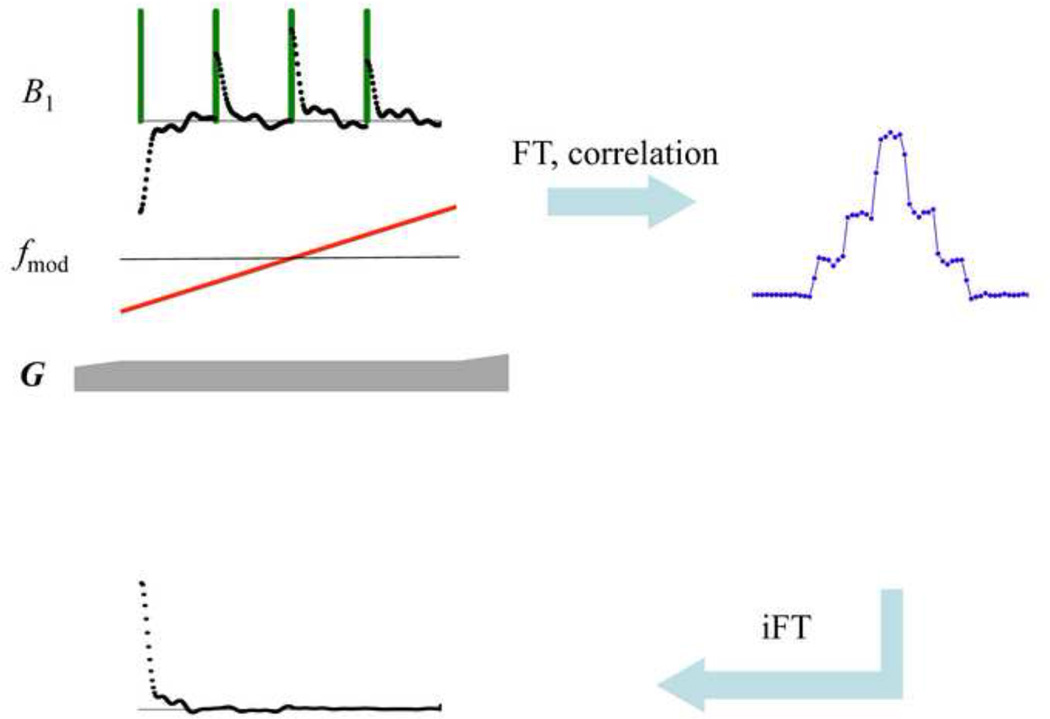
After acquisition, the response signal (r(t)) is Fourier transformed (ℑ{r(t)}→R(ω)) and correlated with the pulse function (x(t)) in the frequency domain (ℑ{x(t)}→ X(ω)) with complex conjugate multiplication by the pulse function,
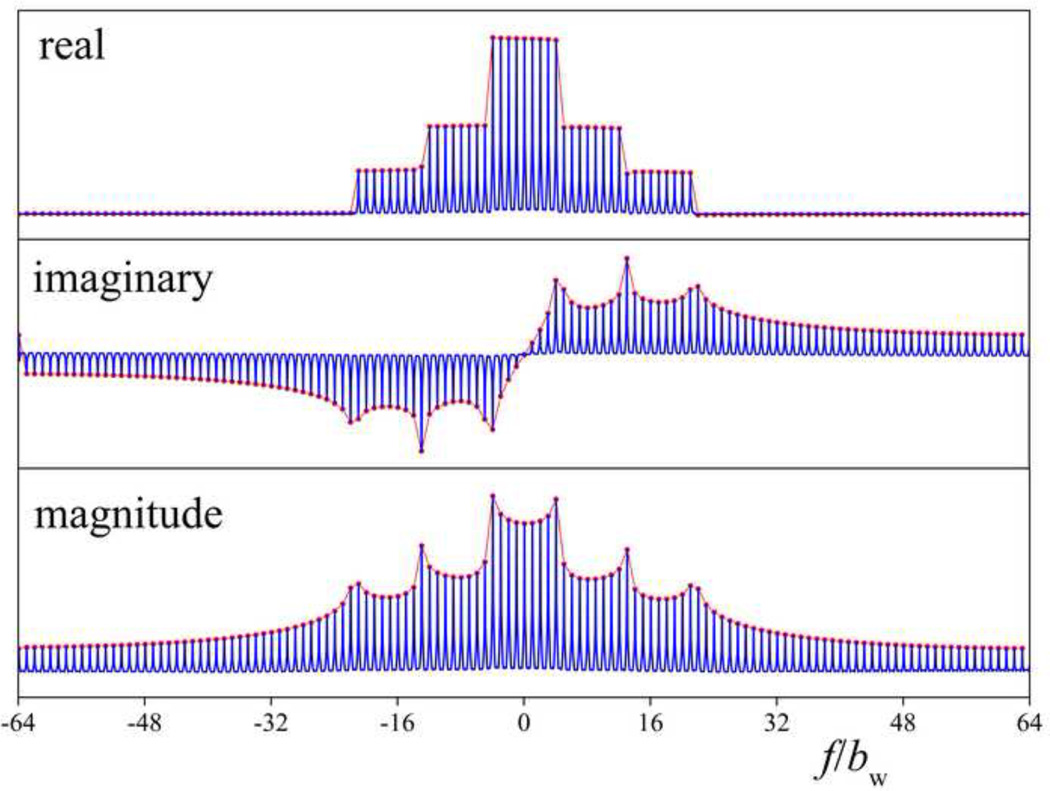
In contrast to the original SWIFT method [26], here the normalization by | X(ω)| is replaced by the regularized argument to avoid noise amplification between the sidebands. Afterwards, the signal is inverse Fourier transformed and chopped after the first NOS samples (or after NSRNOS samples in the case of the super-resolution scheme, see below). This down sampling procedure yields the desired spoke in k-space, which in the frequency (projection) domain represents the average amplitudes of excited bands (strips); i.e., in the simplest case, one point per strip along the projection. Simulated MB-SWIFT data and the corresponding strip-averaged projection of a stepped object are shown in Fig. 3. In an actual experiment, the few first samples during and after each of the pulse elements are contaminated by coil ring down, and thus, are discarded and then predicted based on the remaining “good” data points [29] or measured in a separate experiment with lower bandwidth, as done with other FID-based MRI methods, including ZTE. After this procedure, the spokes are used for the reconstruction of the image. As an alternative to the correlation method described above, algebraic reconstruction [30] can be used. We used gridding [31], but any other radial reconstruction scheme could be utilized.
Fig. 3.
Simulated MB-SWIFT data for a stepped object, using 128 bands (blue line), down-sampled data (red line and circles).
To deliver a multi-band property, the sequence must contain at least two pulses (NG > 1) applied in presence of the same field gradient. Alternatively, the MB-SWIFT sequence (Fig. 1) can be considered to be a linear superposition of ZTE sequences (pulse-acquire) with an optional phase or frequency shift between the pulses. Thus, this sequence might be also called MB-ZTE; however, we prefer the chosen name of MB-SWIFT because, as shown below, it seems to have more features in common with SWIFT. For simplicity in comparing the efficiencies of the sequences, below the standard ZTE sequence is considered the “gold standard”.
Recovering resolution
In the description above, the resolution of MB-SWIFT is determined by the number of samples in the gaps, NOS, which is equal to the number of points, N = NOS, in each (1D) projection. Thus, in comparison with the ZTE sequence, the presented MB-SWIFT sequence is less optimal in terms of acquisition speed (i.e., a reduced number of projections per unit time). However, below we show how this parameter can be improved.
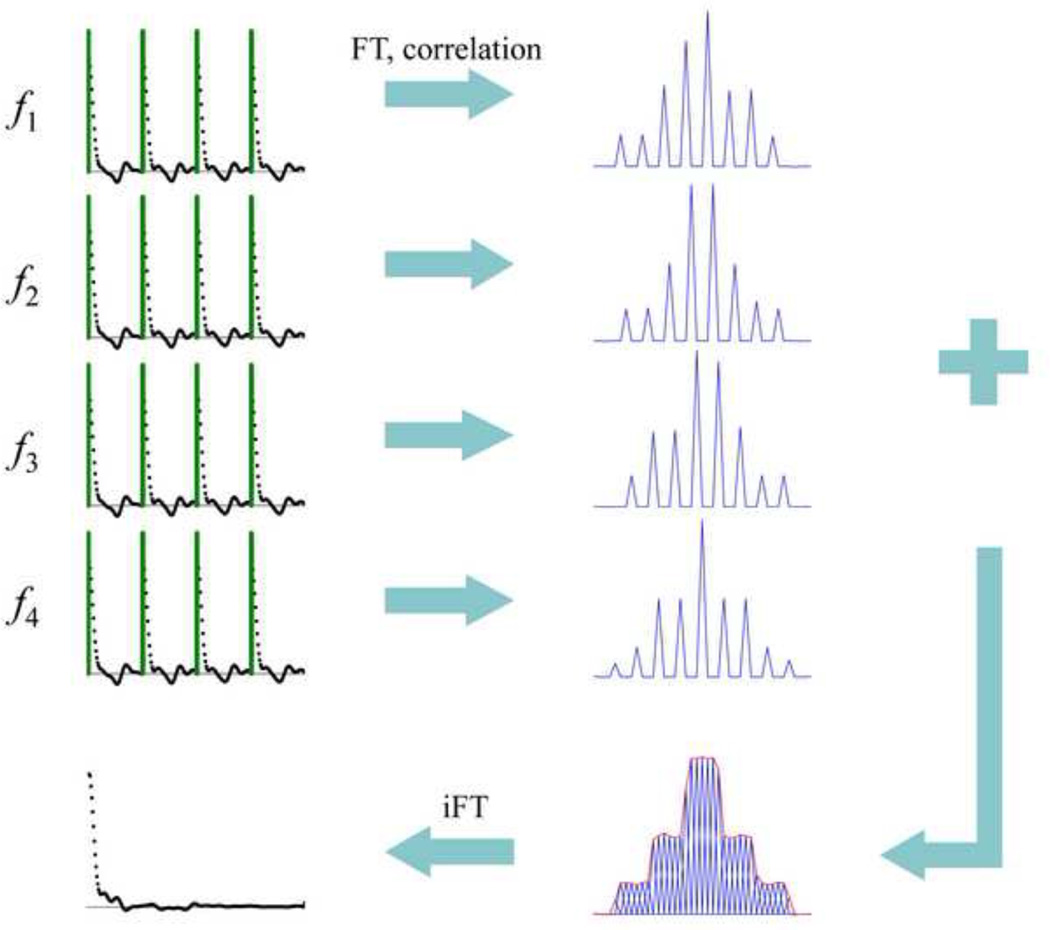
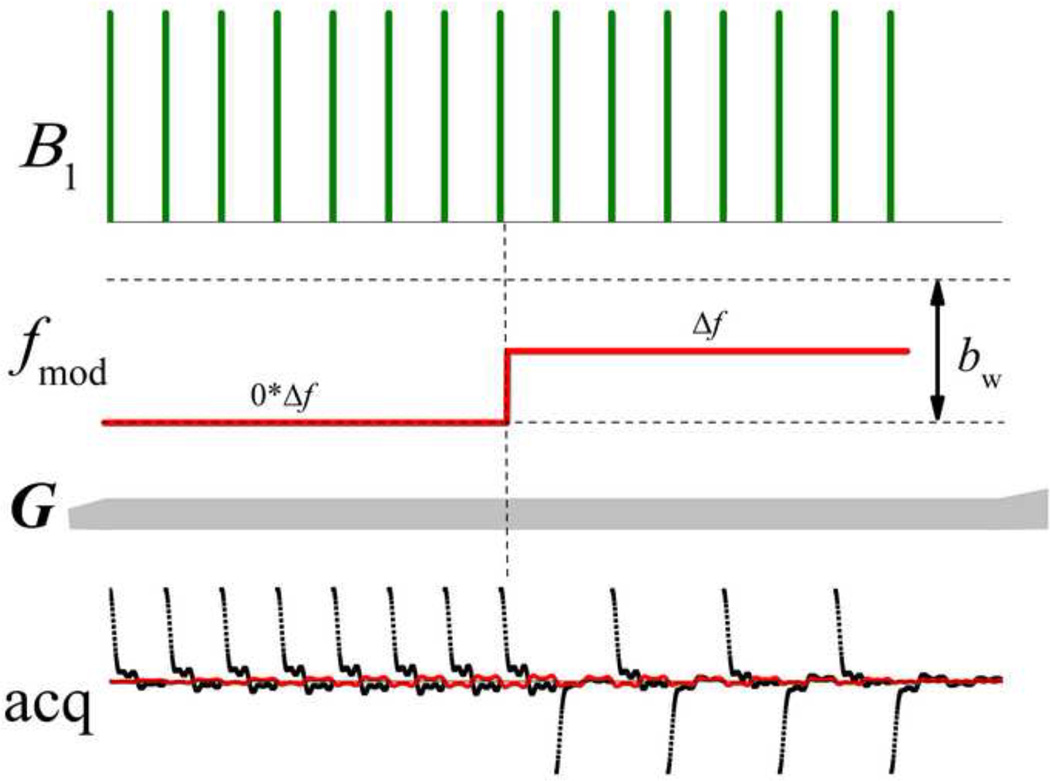
The sub-voxel excitation in the case of MB-SWIFT contains additional spatial information which can be used for resolution enhancement (N > NOS), without an additional increase of the readout time, by using a “super-resolution” approach that has similarities with a previously proposed method [32]. In the case of MB-SWIFT, the idea can be realized in at least two ways: 1) by increasing the number of strips per voxel, or 2) by increasing the number of samples per strip. The example presented in Fig. 4 uses narrow banded excitation (with amplitude modulation of space, σ = 0) and four separate scans with subsequent shifting of the carrier frequency by bw/4. An average of these projections gives the projection with fourfold higher resolution. We introduce a parameter to describe the recovered resolution, NSR, which is equal to 4 in this specific case. Obviously the maximum NSR is equal to NG. The excitation of more than one strip per bw is also possible during one readout, as shown in Fig. 5, by stepped shifting of the excitation frequency (similarly to that done in a Frank pulse [33]), followed by correlation and forward FT using the first N = NSRNOS data points, with NSR = 2 in this case equal to the number of frequency steps. The basic idea of using the sequences presented in Figs. 4 and 5 is the same. Specifically, it provides a way to increase the resolution by increasing the number of excitation strips per voxel. However the realization is different; in the first case (Fig. 4) strips are excited independently during different repetition cycles, but in the second case (Fig. 5) the two strips are excited sequentially in the presence of transverse coherence, which might result in different sensitivity to some dynamic processes, e.g. flow [34]. In both cases at each frequency it is necessary to use at least two pulses (NG > 1) to create amplitude modulated (striped) objects in order to allow this super- resolution scheme [32].
Fig. 4.
Super-resolution scheme using multiple strips per voxel. Four acquisitions with NG = 4, NOS = 64, NSR = 4, and four different transmitted frequencies (f1 = 0, f2 = bw/4, f3 = bw/2, f4 = 3bw/4) are combined after FT and correlation to obtain one FID with NSR*NOS = 256 number of points.
Fig. 5.
Schematic of a single projection-block of a MB-SWIFT sequence that switches between two transmitted frequencies. NG = 16, NOS = 128, and NSR = 2.
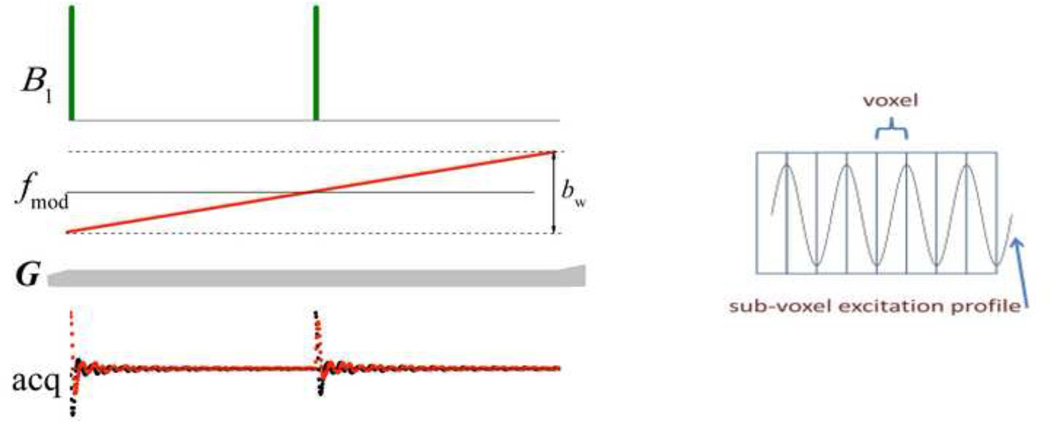
Another way of increasing resolution is based on distinguishing the parts inside of each strip by using phase modulation. The example presented in Fig. 6 uses whole voxel excitation and 4 samples per voxel (with quadratic phase modulation inside of each voxel, σ = bw/2). After FT and correlation, one FID is obtained with 4NOS number of points. Another practical example using increased sampling per sideband can be presented by the simplest, two-pulse MB-SWIFT sequence (Fig. 7) with σ = bw/2, p = 1, and N = 2NOS. After correlation and forward FT, N resolved points are obtained in the time domain.
Fig. 6.
Super-resolution scheme using multiple samples per voxel. The sequence of pulses with NG = 4, NOS = 64 and linear frequency modulation excites the whole voxel. After FT and correlation, one FID is obtained that has 4NOS number of points.
Fig. 7.
Schematic of one projection-block of the simplest MB-SWIFT sequence (left) with linear frequency sweep (or 90° phase difference between these two pulses). NG = 2 and NOS = 128. This sub-voxel excitation is overlaid on the voxel grid (right).
Thus, there are many different schemes by which super-resolution can be used to recover nominal resolution. To avoid a “bullseye” artifact in the image, it may be necessary to choose a scheme which yields the flattest excitation profile after the points have combined. Alternatively, residual uneven excitation can be averaged out using frequency or gap-cycling [35], which has similarity to the method used in noise spectroscopy for bandwidth extension [36, 37]. The main advantage of such MB-SWIFT implementations, as compared with the standard ZTE sequence of similar resolution, is the ability to have more pulse elements per projection (or gradient orientation), which allows increased flip angle for a given RF amplitude setting.
Excitation power
Below we provide a semi-phenomenological estimation of the power deposition of the MB-SWIFT sequence and compare it with the ZTE sequence using the same excitation spectral width, sw, which is equal to sw = bwNOS.
As was shown elsewhere [26], the peak RF amplitude, B1, needed to excite the spins to a flip angle θ in the bandwidth pbw using a gapped chirp pulse can be approximated as
| [2] |
where γ is gyromagnetic ratio, R = pbwTp= pNG. To evenly excite a bandwidth equal to sw, we must choose τp and dc as and , respectively. Thus, Eq. 2 can be rewritten as
| [3] |
An equivalent expression for the RF amplitude of a single square pulse excitation can be written as
| [4] |
Thus, when relaxation processes are neglected, the flip angle of the strips will be increased by relative to a square pulse applied with similar RF amplitude. This result is a consequence of coherent buildup of signal during repeated sub-pulses.
Excitation of strips has some unique features to be considered when determining the optimal flip angle for a fast steady-state acquisition using a repetition time, TR, much shorter than the longitudinal relaxation time, T1. After each TR period, only a portion, p, of the voxel is excited, and at the same time, the magnetization in the other portion of the voxel is undergoing recovery, which increases the effective repetition time. Changing the orientation of projections (or excited strips) with every TR results in excitation of different portions of the voxel. Due to this process, on average a full voxel will be excited effectively in a period increased by 1/p times the TR. When considering a fast repetition regime and small flip angles, which is common in many practical applications, we have a square root dependency between optimal Ernst angle, θE and TR [38]:
| [5] |
Thus, in the case of strip excitation with TR increased by a factor of 1/p, θ should be increased by a factor of . Additionally, considering that the TR of MB-SWIFT without super-resolution is about NG times longer, we can conclude that in the optimal condition both sequences need the same RF amplitudes. However in the case of the super-resolution scheme, TR becomes NSR times shorter and if NSR = NG, TR is equal to that in the equivalent ZTE sequence. In that case, MB-SWIFT requires considerably less RF amplitude:
| [6] |
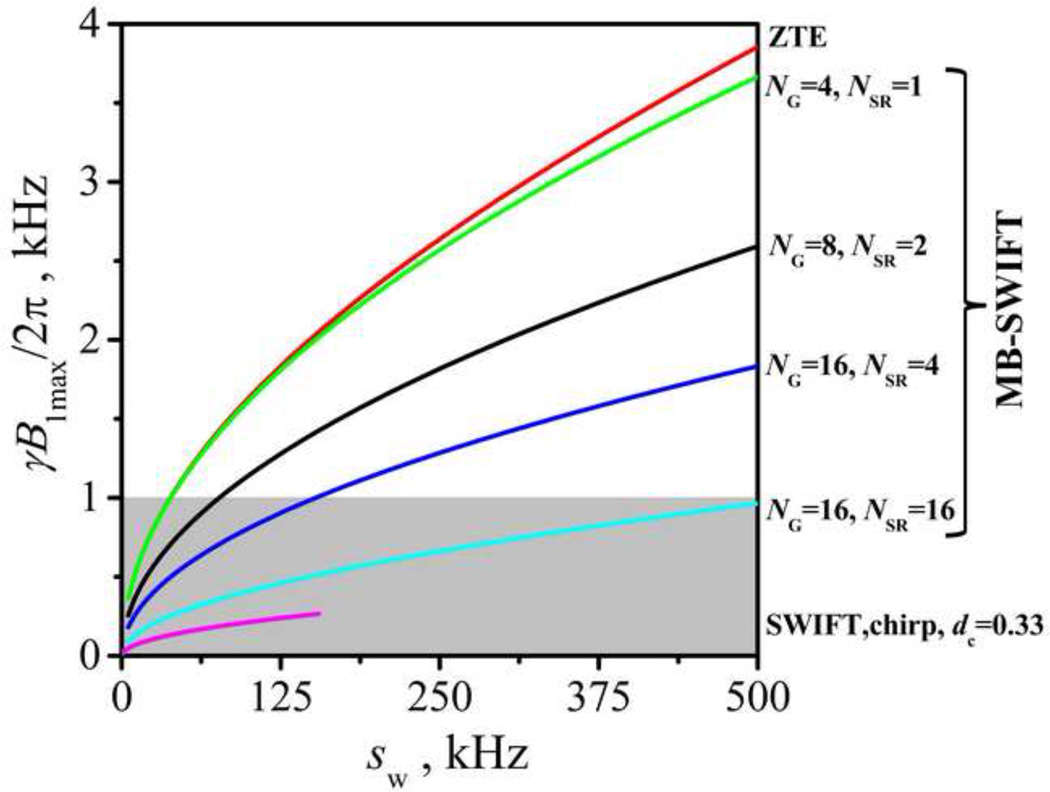
For comparison, Fig. 8 presents the calculated RF amplitudes of the different schemes. The curve for SWIFT is truncated before reaching high bandwidth since this region is practically unobtainable with SWIFT. The gray area shows the RF amplitudes which can be generated practically by typical clinical RF coils. Thus MB-SWIFT has intermediate RF power efficiency between ZTE and standard SWIFT.
Fig. 8.
Calculated RF amplitudes (in frequency unit) needed to excite at the Ernst angle based on Eq. 3 – 5 for T1 = 1 s with TR = NG/NSR*NOS/sw + tGr, (tGr = 150 µs – gradient switching time) and NOS = 256. The gray area shows the RF amplitude which can be practically reached by typical clinical RF coils.
Signal to noise
As shown above, in MB-SWIFT imaging, each voxel can be excited fully or partially and parameter p, which represents the fraction of the excited portion of the voxel, can be equal to or less than 1. The SNR of a signal acquired following strip excitation under optimal conditions has two competing effects. On the one hand, due to partial voxel excitation, the signal energy decreases. That is, in the presence of random thermal noise, the SNR at the strip is less than the SNR for the case of full voxel excitation by a factor of . However, as explained previously, the flip angle in this case is increased by a factor of . Thus, in the Ernst condition, the one effect compensates the other and keeps SNR similar to the case of full excitation SNR.
METHODS
The imaging data presented here were acquired with a 4T (Oxford, 90 cm-bore) MRI scanner equipped with a Varian (now Agilent) DirectDrive™ console. The maximum available field gradient strength is 50 mT/m (SC72 gradient coil, Siemens).
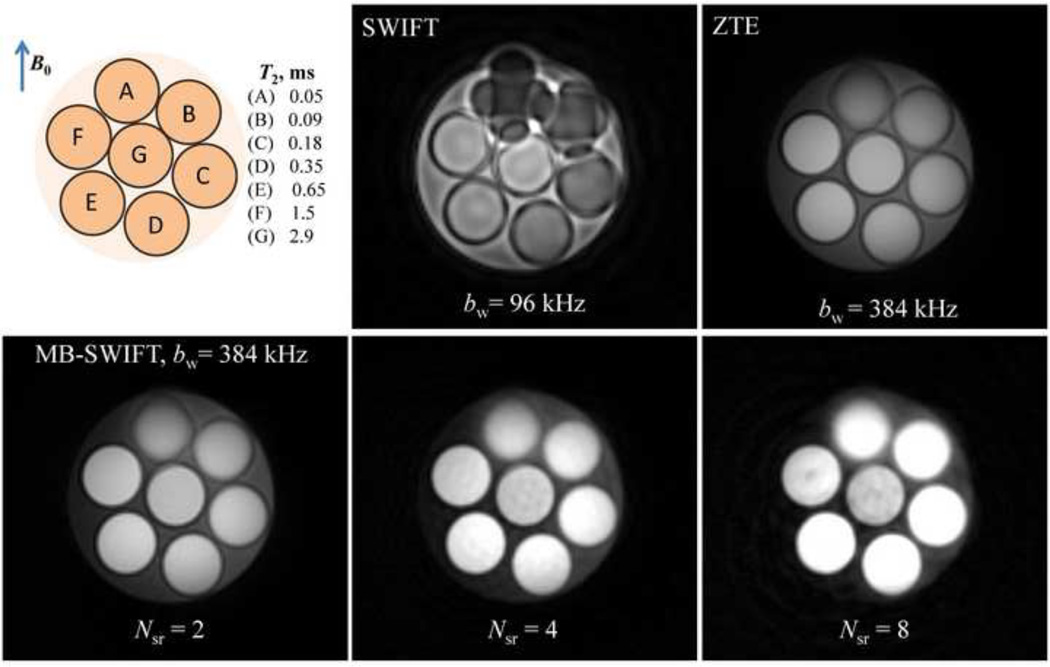
The phantom was made from seven water-filled tubes of 3 cm diameter, each doped with a different concentration of MnCl2, and immersed in a bigger container of deionized water. The T2 values of the phantom presented in Fig. 9 were determined spectroscopically. With this phantom, the T2/T1 variation is ~15-fold at 4T. The tubes were oriented orthogonally to the main magnetic field to maximize susceptibility effects on field distortion.
Fig. 9.
Images of the phantom with short T2 spins. Acquisitions were performed with standard SWIFT and ZTE (upper row), and with MB-SWIFT using different NSR parameter settings (bottom row). ZTE and MB-SWIFT used the same RF amplitude, which was 16 db greater than that used for standard SWIFT. All acquisition parameters for ZTE and MB-SWIFT were identical including: number of views = 64000, τp = 2.6 µs, dead time = 2.6 µs, FOV = 353 mm3TR = 1.27 ms, number of complex points = 256, total acquisition time = 83 s, and approximate flip angle of 6°. The differences for regular SWIFT were: number of views = 32000, TR = 3.26 ms, and flip angle = 5°.
Phantom images were acquired with a quadrature transmit/receive breast coil, which consists of two orthogonal single loop coils of about 20 cm diameter [39]. Images of human mandible were acquired with a quadrature transmit/receive mandibular coil, which consists of two single loop coils of about 10 cm diameter [40]. The human study was conducted in accordance with a protocol approved by the Institutional Review Board of the University of Minnesota.
All presented experiments were acquired using a pulse element duration τp = 1/sw, and in all cases, data existing during the pulses and for a period 1/sw after each pulse were discarded to eliminate coil ring down artifacts. For standard SWIFT, the excitation bandwidth covering the FOV was equal to sw/4, and for ZTE and MB-SWIFT, it was equal to sw. Thus ZTE and MB-SWIFT had two missing data points, which were predicted after correlation and iFT by using the SVD method described previously [29].
Each acquisition results in one spoke (radial center out trajectory) of k-space after pre-processing. The terminus of the radial spokes form isotropically distributed points on a sphere located in one of up to 32 interleaved spirals [41]. 3D radial data were processed using an in-house program developed in LabVIEW (National Instruments) and interpolated with a Kaiser-Bessel function onto a Cartesian grid utilizing in-house matlab mex code [42].
RESULTS
Images of the short-T2 phantom (Fig. 9) demonstrate the benefit of increased bandwidth in general and the improved RF power efficiency of MB-SWIFT relative to ZTE in particular. Of note, image blurring due to the large magnetic susceptibility differences (dipoles) are decreased substantially with higher bandwidth (96 kHz in the standard SWIFT image versus 384 kHz in the others). The liquids in the tubes have very short T1 values (T1 values were estimated at 15*T2 with T2 values presented in the figure), which makes it difficult to operate at the Ernst angle with ZTE, even when using the full available RF power (4 kW). In this case, the steady-state signal increases with excitation flip angle and is always higher for shorter T1 values. At the same time, the bandwidth of 384 kHz is high enough to avoid T2 weighting. Thus one observes in Fig. 9 higher intensity of signal with larger NSR (with identical other acquisition parameters) which is explained by increased flip angle. The intensity ratio was estimated to be approximately relative to the intensity of ZTE images, which is consistent with the power efficiency of the methods as predicted theoretically (Eq. 6). In addition, as the, NSR value increased, it can be noted that the level of artifacts in the images also increased.
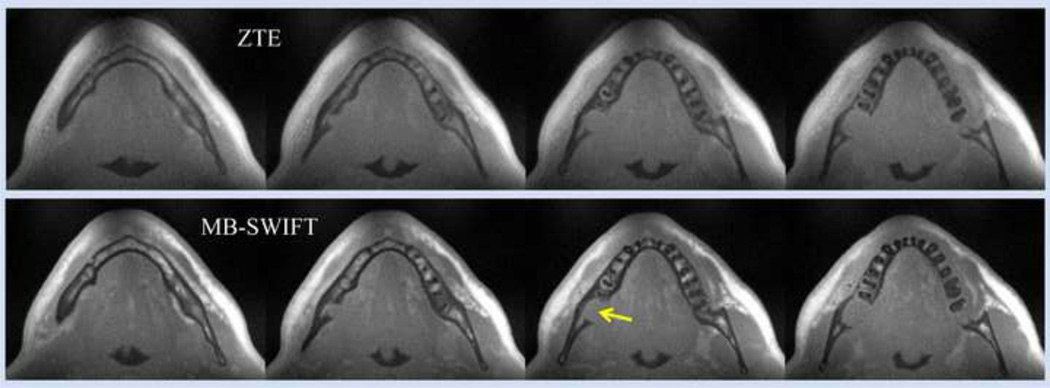
Figure 10 presents human mandible images of a patient diagnosed with squamous cell carcinoma of the oral cavity. To increase the sensitivity and specificity for detecting such mandibular pathology, it is necessary to use the maximum bandwidth allowed by the hardware. Image sharpness improves and the need for fat suppression is eliminated with increased bandwidth. These images collected without fat saturation and with 250 kHz bandwidth show negligible fat-water blurring and clear delineation of the jaw-bone interruption. For the comparison of power efficiency of ZTE (top) versus MB-SWIFT (bottom) (the sequence version presented in Fig. 7), data were collected using similar parameters (bandwidth, total acquisition time, amplitude of the RF pulse, etc.). These results show an increased T1 contrast for MB-SWIFT images, which was expected due to the increased flip angle.
Fig. 10.
Selected slices of 3D images of human mandible. To allow comparison of the power efficiency of ZTE (NSR=1) (top) versus MB-SWIFT (NSR=2) (bottom), data were acquired using the same RF peak power and fixed acquisition parameters (sw= 250 kHz). Acquisition time was 4 minutes. The arrow shows the location of tumor invading the bone, which presents as a discontinuity in the (hypointense) mandible. Other acquisition parameters: number of views = 131072, τp = 4 µs, “dead” time = 4 µs, FOV = 243 mm3, TR = 1.62 ms, number of complex points in one spoke 256, and approximate flip angle of 8°.
Additional MB-SWIFT images can be found online in the ISMRM 2014 conference proceedings [23, 40] and in supporting materials.
DISCUSSION AND CONCLUSION
This work introduces a new approach to image short T2 spins using multiple excitation bands and demonstrates the “proof-of-principle” of MB-SWIFT with a few different practical schemes. We believe that the performance of the sequences will be improved by future optimization of the excitation profiles and the phase or frequency cycling schemes used to suppress related residual artifacts (see Fig. 9).
The uniqueness of MB-SWIFT, as compared to other related sequences, stems from its sub-voxel excitation created by excitation of subsequent coherent pulse elements, which might be used in the future to discriminate between tissues with different spin dynamics on the time scale of the pulse duration. A different effect of coherent excitation will be experienced by spin systems with different T2 values or, for example, by blood water spins which lose coherence due to flow in the presence of a field gradient [34]. More detailed analyses of these and other properties of the introduced sequence will be the subject of future work.
From a practical point of view, the MB-SWIFT technique can be viewed as a bridge between SWIFT and ZTE sequences. Our development of MB-SWIFT should not be interpreted as an abandonment of the original SWIFT or ZTE sequence. These sequences will perform optimally in many cases. However, when SWIFT or ZTE cannot be implemented in an optimal manner due to practical constraints, MB-SWIFT can fill the gap. In particular, we showed that MB-SWIFT extends the applicability of the SWIFT technique to very high excitation and acquisition bandwidths and that the power efficiency of the new method is improved relative to the ZTE sequence. Such features make the method attractive for clinical study of human tissues with fast relaxing spins. At this point it is worth mentioning that increased bandwidth is a direct way to decrease off resonance blurring in radial imaging and improve imaging of fast relaxing spins. Fortunately, with each new generation of clinical scanner, the trend continues to be toward increasing the maximum gradient strength, which will help to integrate this approach in a clinical routine in the future.
The MB-SWIFT is expected to find application in many areas including materials science and medical imaging. Specifically, we expect that this method could be most effectively used for imaging objects with inhomogeneously broadened signals, as occurs, for example, in lung or in tissues located near metallic implants when extremely high excitation and acquisition bandwidths are required.
Highlights.
A new pulse sequence for imaging of fast relaxing spins is proposed and described;
Multi-Band scheme used to achieve increased excitation bandwidth;
Flip angles achievable with Multi-Band-SWIFT are higher in comparison to ZTE;
Multi-Band-SWIFT is a bridge between SWIFT and ZTE sequences;
Multi-Band-SWIFT may have future uses for medical and materials imaging.
ACKNOWLEDGEMENTS
This research was supported by NIH P41 EB015894, S10 RR023730, S10 RR027290, and KL2 TR000113. We thank the patient for participation in this mandibular study and Dr. Samir S. Khariwala for much appreciated help with organization of this MRI scan and useful discussions.
Footnotes
Publisher's Disclaimer: This is a PDF file of an unedited manuscript that has been accepted for publication. As a service to our customers we are providing this early version of the manuscript. The manuscript will undergo copyediting, typesetting, and review of the resulting proof before it is published in its final citable form. Please note that during the production process errors may be discovered which could affect the content, and all legal disclaimers that apply to the journal pertain.
REFERENCES
- 1.Robson MD, Bydder GM. Clinical ultrashort echo time imaging of bone and other connective tissues. NMR Biomed. 2006;19:765–780. doi: 10.1002/nbm.1100. [DOI] [PubMed] [Google Scholar]
- 2.Vidarsson L, Gold GE, Hargreaves B, Pauly JM. Linear combination filtering for T2-selective imaging of the knee. Magn. Reson. Med. 2006;55:1191–1196. doi: 10.1002/mrm.20878. [DOI] [PubMed] [Google Scholar]
- 3.Bydder GM. Imaging of Short and Ultrashort T2 and T2* Components of Tissues, Fluids, and Materials in the Body Using Clinical Magnetic Resonance Systems. eMagRes, John Wiley & Sons, Ltd. 2007:289–303. [Google Scholar]
- 4.Bydder GM, Fullerton GD, Young IR. MRI of Tissues with Short T2s or T2*s Imaging of Tissues and Materials with Short T2. eMagRes, Wiley, Chicester. 2012 [Google Scholar]
- 5.Bergin CJ, Pauly JM, Macovski A. Lung parenchyma: projection reconstruction MR imaging. Radiology. 1991;179:777–781. doi: 10.1148/radiology.179.3.2027991. [DOI] [PubMed] [Google Scholar]
- 6.Gatehouse PD, Bydder GM. Magnetic resonance imaging of short T2 components in tissue. Clin. Radiol. 2003;58:1–19. doi: 10.1053/crad.2003.1157. [DOI] [PubMed] [Google Scholar]
- 7.Boujraf S, Hofmann C, Ulrici J, Hell E, Haller B, Rasche V. Microstructural assessment of dental tissues by quantitative MRI using ultra-short echo times (UTE): initial in-vivo evaluation. 17th Annual Meeting of ISMRM, Honolulu, Hawaii, USA. 2009:4518. [Google Scholar]
- 8.Bracher A-K, Hofmann C, Bornstedt A, Boujraf S, Hell E, Ulrici J, Spahr A, Haller B, Rasche V. Feasibility of ultra-short echo time (UTE) magnetic resonance imaging for identification of carious lesions. Magn. Reson. Med. 2011;66:538–545. doi: 10.1002/mrm.22828. [DOI] [PubMed] [Google Scholar]
- 9.Idiyatullin D, Corum C, Park J-Y, Garwood M. Fast and quiet MRI using a swept radiofrequency. J. Magn. Reson. 2006;181:342–349. doi: 10.1016/j.jmr.2006.05.014. [DOI] [PubMed] [Google Scholar]
- 10.Idiyatullin D, Corum C, Moeller S, Prasad H, Garwood M, Nixdorf D. Dental Magnetic Resonance Imaging: Making the Invisible Visible. J. Endod. 2011;37:745–752. doi: 10.1016/j.joen.2011.02.022. [DOI] [PMC free article] [PubMed] [Google Scholar]
- 11.Kendi ATK, Khariwala SS, Zhang J, Idiyatullin DS, Corum CA, Michaeli S, Pambuccian SE, Garwood M, Yueh B. Transformation in Mandibular Imaging With Sweep Imaging With Fourier Transform Magnetic Resonance Imaging. Arch. Otolaryngol. Head Neck Surg. 2011;137:916–919. doi: 10.1001/archoto.2011.155. [DOI] [PMC free article] [PubMed] [Google Scholar]
- 12.Garwood M, Idiyatullin D, Corum CA, Chamberlain R, Moeller S, Kobayashi N, Lehto LJ, Zhang J, O’Connell R, Tesch M, Nissi MJ, Ellermann J, Nixdorf DR. Capturing Signals from Fast-relaxing Spins with Frequency-Swept MRI: SWIFT. eMagRes, John Wiley & Sons, Ltd. 2012 [Google Scholar]
- 13.Hafner S. Fast imaging in liquids and solids with the Back-projection Low Angle ShoT (BLAST) technique. Magn. Reson. Imaging. 1994;12:1047–1051. doi: 10.1016/0730-725x(94)91236-p. [DOI] [PubMed] [Google Scholar]
- 14.Madio DP, Lowe IJ. Ultra-fast imaging using low flip angles and FIDs. Magn. Reson. Med. 1995;34:525–529. doi: 10.1002/mrm.1910340407. [DOI] [PubMed] [Google Scholar]
- 15.Weiger M, Pruessmann KP, Hennel F. MRI with zero echo time: Hard versus sweep pulse excitation. Magn. Reson. Med. 2011;66:379–389. doi: 10.1002/mrm.22799. [DOI] [PubMed] [Google Scholar]
- 16.Weiger M, Pruessmann KP, Bracher A-K, Köhler S, Lehmann V, Wolfram U, Hennel F, Rasche V. High-resolution ZTE imaging of human teeth. NMR Biomed. 2012;25:1144–1151. doi: 10.1002/nbm.2783. [DOI] [PubMed] [Google Scholar]
- 17.Wu Y, Dai G, Ackerman JL, Hrovat MI, Glimcher MJ, Snyder BD, Nazarian A, Chesler DA. Water- and fat-suppressed proton projection MRI (WASPI) of rat femur bone. Magn. Reson. Med. 2007;57:554–567. doi: 10.1002/mrm.21174. [DOI] [PubMed] [Google Scholar]
- 18.Grodzki DM, Jakob PM, Heismann B. Ultrashort echo time imaging using pointwise encoding time reduction with radial acquisition (PETRA) Magn. Reson. Med. 2012;67:510–518. doi: 10.1002/mrm.23017. [DOI] [PubMed] [Google Scholar]
- 19.Idiyatullin D, Suddarth S, Corum CA, Adriany G, Garwood M. Continuous SWIFT. J. Magn. Reson. 2012;220:26–31. doi: 10.1016/j.jmr.2012.04.016. [DOI] [PMC free article] [PubMed] [Google Scholar]
- 20.Brunner DO, Pavan M, Dietrich B, Rothmund D, Heller A, Pruessmann KP. Sideband Excitation for Concurrent RF Transmission and Reception. ISMRM Annual Scientific Meeting & Exhibition, Montreal, Quebec, Canada. 2011 [Google Scholar]
- 21.Weiger M, Brunner DO, Dietrich BE, Müller CF, Pruessmann KP. ZTE imaging in humans. Magn. Reson. Med. 2013;70:328–332. doi: 10.1002/mrm.24816. [DOI] [PubMed] [Google Scholar]
- 22.Morris GA, Freeman R. Selective Excitation in Fourier Transform Nuclear Magnetic Resonance. J. Magn. Reson. 1978;29:433–462. doi: 10.1016/j.jmr.2011.08.031. [DOI] [PubMed] [Google Scholar]
- 23.Idiyatullin D, Corum C, Garwood M. Multi-Band-SWIFT. ISMRM Annual Scientific Meeting & Exhibition, Milan, Italy. 2014:0649. [Google Scholar]
- 24.Doran SJ, Jakob P, Decorps M. Rapid repetition of the “burst” sequence: the role of diffusion and consequences for imaging. Magn. Reson. Med. 1996;35:547–553. doi: 10.1002/mrm.1910350414. [DOI] [PubMed] [Google Scholar]
- 25.Cho ZH, Ro YM, Hong IK. FM DANTE fast imaging and variations: Emerging rf-based ultrafast imaging techniques. Concepts in Magnetic Resonance. 1998;10:33–54. [Google Scholar]
- 26.Idiyatullin D, Corum C, Moeller S, Garwood M. Gapped pulses for frequency-swept MRI. J. Magn. Reson. 2008;193:267–273. doi: 10.1016/j.jmr.2008.05.009. [DOI] [PMC free article] [PubMed] [Google Scholar]
- 27.Kunz D. Use of frequency-modulated radiofrequency pulses in MR imaging experiments. Magn. Reson. Med. 1986;3:377–384. doi: 10.1002/mrm.1910030303. [DOI] [PubMed] [Google Scholar]
- 28.Folland G, Sitaram A. The uncertainty principle: A mathematical survey. Journal of Fourier Analysis and Applications. 1997;3:207–238. [Google Scholar]
- 29.Kuethe DO, Caprihan A, Lowe IJ, Madio DP, Gach HM. Transforming NMR data despite missing points. J. Magn. Reson. 1999;139:18–25. doi: 10.1006/jmre.1999.1767. [DOI] [PubMed] [Google Scholar]
- 30.Weiger M, Hennel F, Pruessmann KP. Sweep MRI with algebraic reconstruction. Magn. Reson. Med. 2010;64:1685–1695. doi: 10.1002/mrm.22516. [DOI] [PubMed] [Google Scholar]
- 31.Jackson JI, Meyer CH, Nishimura DG, Macovski A. Selection of a convolution function for Fourier inversion using gridding, Medical Imaging. IEEE Transactions on. 1991;10:473–478. doi: 10.1109/42.97598. [DOI] [PubMed] [Google Scholar]
- 32.Ropele S, Ebner F, Fazekas F, Reishofer G. Super-resolution MRI using microscopic spatial modulation of magnetization. Magn. Reson. Med. 2010;64:1671–1675. doi: 10.1002/mrm.22616. [DOI] [PubMed] [Google Scholar]
- 33.Blümich B, Gong Q, Byrne E, Greferath M. NMR with excitation modulated by Frank sequences. J. Magn. Reson. 2009;199:18–24. doi: 10.1016/j.jmr.2009.03.009. [DOI] [PubMed] [Google Scholar]
- 34.Li L, Miller KL, Jezzard P. DANTE-prepared pulse trains: A novel approach to motion-sensitized and motion-suppressed quantitative magnetic resonance imaging. Magn. Reson. Med. 2012;68:1423–1438. doi: 10.1002/mrm.24142. [DOI] [PubMed] [Google Scholar]
- 35.Corum CA, Idiyatullin D, Snyder CJ, Garwood M. Gap cycling for SWIFT. Magn. Reson. Med. 2014 doi: 10.1002/mrm.25141. [DOI] [PMC free article] [PubMed] [Google Scholar]
- 36.Yang D-K, Atkins JE, Lester CC, B D. Zax, New developments in nuclear magnetic resonance using noise spectroscopy. Mol. Phys. 1998;95:747–757. [Google Scholar]
- 37.Yang D-K, Zax DB. Bandwidth Extension in Noise Spectroscopy. J. Magn. Reson. 1998;135:267–270. doi: 10.1006/jmre.1998.1577. [DOI] [PubMed] [Google Scholar]
- 38.Ernst RR. Sensitivity enhancement in magnetic resonance. Adv. Magn. Reson. 1966;2:1–135. [Google Scholar]
- 39.Merkle H, DelaBarre L, Bolan PJ, Baker EH, Everson LI, Yee D, Garwood M. Transceive Quadrature Breast Coils and Applications at 4 Tesla. ISMRM Annual Scientific Meeting & Exhibition, Glasgow, Scotland. 2001 [Google Scholar]
- 40.Idiyatullin D, Corum C, Garwood M, Cayci Z, Yueh B, Khariwala S. Preoperative assessment of mandibular invasion with SWIFT. ISMRM Annual Scientific Meeting & Exhibition, Milan, Italy. 2014 [Google Scholar]
- 41.Wong ST, Roos MS. A strategy for sampling on a sphere applied to 3D selective RF pulse design. Magn. Reson. Med. 1994;32:778–784. doi: 10.1002/mrm.1910320614. [DOI] [PubMed] [Google Scholar]
- 42.SWIFT. software package. Available from: http://www.cmrr.umn.edu/swift/


