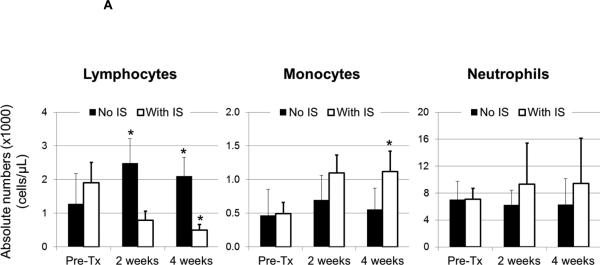
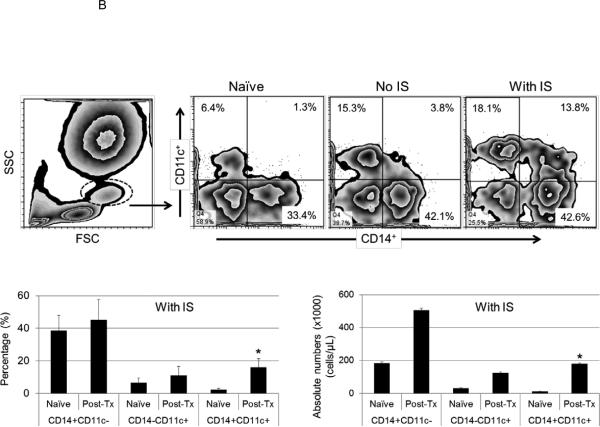
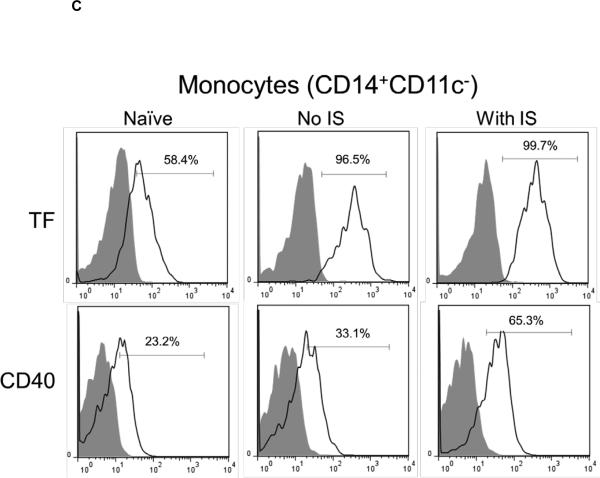
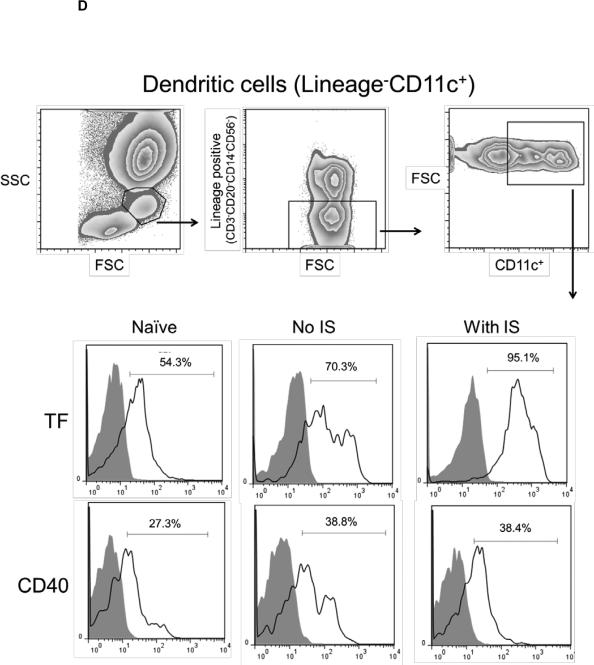
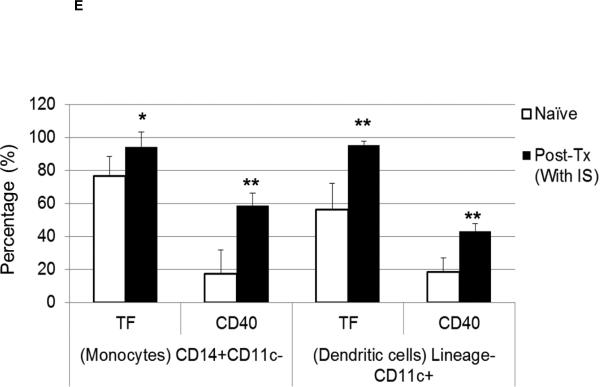
Figure 3. Immunosuppressive therapy (IS) is associated with increased pro-coagulant inflammatory innate immune cells after pig artery patch xenotransplantation.
(A) After pig artery patch xenotransplantation, absolute numbers of peripheral blood leukocytes were measured. With no IS, mean lymphocyte numbers at 2 and 4 weeks post-transplant increased by 49 % and 39%, respectively (*p<0.05), and were reduced with IS by 33 % and 37%, respectively (*p<0.05). With no IS, monocytes increased at 2 and 4 weeks by 32 % and 16%, respectively. With IS, monocytes increased more markedly at 2 and 4 weeks by 55 % and 56%, respectively (*p<0.05). Neutrophil numbers did not change significantly after transplantation with a modest reduction of 12 % and 11%, respectively. With IS, mean neutrophil numbers increased at 2 and 4 weeks after transplantation by 24 % and 25%, respectively.
(B) With IS, increased percentages of CD14+CD11c− (45%+/−12%) and CD14−CD11c+ (11%+/−5%) cells were detected in comparison to naïve baboons, where CD14+CD11c− and CD14−CD11c+ cells were 38%+/−9% and 6%+/−3%, respectively (bottom). A significant increase in the CD14+CD11c+ cells percentages (16%+/−5%) and absolute numbers (180+/−60×103/μL) was detected only in the presence of IS which was associated with a significantly higher numbers than in naïve baboons (2.4%+/−0.6%; (11+/−3×103/μL) (*p<0.05) (bottom).
(C and D) With or without IS, there was increased TF and CD40 expression on monocytes (CD14+CD11c−) (C) and DC (lineageneg CD11c+) (D) in comparison to naïve baboons. With no IS, monocytes were 96.5% TF-positive and 33.1% CD40-positive, while DC were 70.3% TF-positive and 38.8% CD40-positive. (E) In naïve baboons, monocytes were 76.5%+/−11.8% TF-positive and 17.4%+/−14.4% CD40-positive, whereas DC were 56.2%+/−16% TF-positive and 18.3%+/−8.8% CD40-positive. With IS, monocytes were 94.4%+/−9.1% TF-positive and 58.6%+/−7.4% CD40-positive, while DC were 95.3%+/−2.3% TF-positive and 43%+/−4.6% CD40-positive In comparison to naïve baboons (* p<0.05 and ** p<0.01).

