

Abstract
3JC′C′ and 3JHNHα couplings are related to the intervening backbone torsion angle ϕ by standard Karplus equations. Although these couplings are known to be affected by parameters other than ϕ, including H-bonding, valence angles and residue type, experimental results and quantum calculations indicate that the impact of these latter parameters is typically very small. The solution NMR structure of protein GB3, newly refined by using extensive sets of residual dipolar couplings (RDCs), yields 50–60% better Karplus equation agreement between ϕ angles and experimental 3JC′C′ and 3JHNHα values than does the high resolution X-ray structure. In intrinsically disordered proteins, 3JC′C′ and 3JHNHα couplings can be measured at even higher accuracy, and the impact of factors other than the intervening torsion angle on 3J will be smaller than in folded proteins, making these couplings exceptionally valuable reporters on the ensemble of ϕ angles sampled by each residue.
Keywords: backbone torsion angle, DFT calculation, GB3, IDP, Karplus equation, protein structure
1. Introduction
Empirically parameterized Karplus relations[1] between a wide range of different types of three-bond J couplings and their corresponding intervening dihedral angles continue to be of exceptional value in structural analysis of organic compounds, including peptides and proteins.[2] Shortly after the initial introduction of the Karplus relation, multiple reports highlighted the dependence of 3JHH couplings on electronegativity of substituents and ring size for cyclic compounds, thereby limiting the precision at which these couplings can be interpreted.[3–6] In a subsequent response, Karplus pointed out that indeed 3J couplings not only depend on the intervening torsion angle, but that theory also shows the coupling to be impacted by electronegativity of substituents, H-C-C valence angles, and bond lengths, and that “the person who attempts to estimate dihedral angles to an accuracy of one or two degrees does so at his own peril”.[7] Although the effect of substituent electronegativity has been accounted for by empirical adjustments to the Karplus equation,[8] the chemistry community largely has taken Karplus’ advice to heart and does not interpret these couplings to the level of precision at which they often can be measured.
Backbone 3JHNHα couplings have been widely used for conformational analysis in peptides and proteins. With the exception of Gly residues, the electronegativity of the substituents is very similar for all residue types, suggesting that quantitative analysis of these parameters in terms of the intervening torsion angle ϕ may be quite robust. However, the observation of a relatively large value (0.85 Hz) for the root-mean-square difference (rmsd) between observed 3JHNHα values and those predicted by a 1.4-Å X-ray structure of the small protein BPTI again pointed to the presence of alternate factors impacting these 3JHNHα values.[9] Indeed, deviations from ideal covalent geometry in the protein backbone are well documented,[10] and variations in H-bonding are expected to impact the HN σ orbitals and thereby the 3JHNHα value. Moreover, as pointed out by Brueschweiler and Case,[11, 12] non-uniformity in the amplitude of backbone dynamics along the protein backbone will differentially skew these experimental parameters towards a value of ca 5 Hz, again impacting the relation between 3JHNHα and the time-averaged intervening dihedral angle. On the other hand, refinement of the 1.1-Å X-ray structure of the protein GB3 yielded a considerable drop from 0.76 to 0.43 Hz between measured 3JHNHα values and those predicted by an optimized Karplus equation.[13] For the extensively studied protein ubiquitin, concerted analysis of 3JHNHα, 3JHNCβ, 3JHNC′, 3JC′Hα, 3JC′Cβ, and 3JC′C′, which all report on the backbone torsion angle ϕ, also indicated that uncertainty in the coordinates obtained from a 1.8-Å X-ray structure of this protein dominated the 0.73 Hz rmsd between observed and predicted 3JHNHα values.[14]
Here, we report results which confirm that random uncertainty in the X-ray coordinates is the prime contributor to the rmsd between observed 3JC′C′ values and those predicted by the Karplus equation. For 3JHNHα, we find that both uncertainties in the coordinates of the C and N backbone atoms as well as deviations from idealized in-peptide-plane positions of HN and from idealized tetrahedral geometry at Cα significantly impact the residual in the fit. Our results imply that experimental 3JHNHα and 3JC′C′ values can be interpreted in angular terms at a precision that approaches that of their measurements. This finding is of particular importance when defining or validating backbone angle distributions in intrinsically disordered proteins, where both 3JHNHα and 3JC′C′ are readily measured at an accuracy better than 0.1 Hz.
2. Results and Discussion
The 1.1-Å X-ray structure of GB3,[15] previously refined by solution NMR RDCs,[16] was further refined by newly measured 1DCαCβ RDCs under three different alignment orientations, as well as previously reported 1H-1H RDCs,[17] and 1DCαC′ values measured for a number of GB3 mutants that orient differentially in a Pf1 liquid crystal suspension.[18] In order to obtain optimal cross-validation results, we found it necessary to reduce by 5-fold the very tight force constants normally used for keeping the peptide bond planar. For details, see the Methods section. The root-mean-square deviation from Ω=180° in the final structures then was 5.0°, close to the values seen in the highest resolution protein X-ray structures.[10, 19, 20] The change in backbone coordinates between the newly calculated structure and the previous RDC-refined structure is quite small (0.37 Å), but nevertheless improves the fit of the 3JHNHα and in particular the 3JC′C′ couplings significantly (vide infra).
It is well known that protein structures are subject to relatively large amplitude internal dynamics,[21–23] which impacts 3J couplings and therefore their fits to Karplus curves.[11]. For deriving the most accurate average torsion angles it is advantageous to calculate the structure as a single model that best fits all input restraints simultaneously, rather than as the average over an NMR ensemble calculation.[24] We therefore have chosen the latter approach for evaluating the relation between 3J couplings and backbone torsion angles, while excluding the three residues (L12, D40, and G41) that were shown to have the highest amplitude internal dynamics as judged by 15N relaxation[25] and RDC measurements.[26]
Fit of 3JHNHα values to Karplus equation
High precision 3JHNHα values, measured previously[13] using a multiple-quantum method,[27] that to a good approximation suppresses effects of cross-relaxation,[28] were used in this study. A fit of these couplings to the X-ray structure (PDB entry 1IGD)[15] to which hydrogens were added with the program REDUCE,[29] yields an rmsd of 0.76 Hz. This rmsd is minimally impacted by the refinement method used, as can be seen from the values obtained for the PDB_REDO structure [30] of GB3, obtained using an optimized automated refinement protocol. This result is not surprising, considering that the backbone coordinate rmsd between 1IGD and its PDB_REDO structure is only 0.046 Å (see Table S1 of the Supporting Information). A much better fit (0.43 Hz rmsd)[17] is observed for the previously RDC-refined model (PDB entry 2OED),[16] which drops to 0.34 Hz for the newly refined model, which includes many additional RDCs plus decreased peptide bond planarity restraints. The coordinates of a GB3 structure obtained from joint X-ray/NMR refinement, using the 1IGD structure factors and the 2OED NMR (RDC) restraints [31], yields rmsd values that are intermediate between 2OED and 1IGD. The relatively high rmsd value for this structure appears to result from the weak weights used for the NMR restraints, also reflected in a very low coordinate rmsd of 0.04 Å relative to 1IGD (see Table S1 of the Supporting Information).
As can be seen in Table 1, a significant fraction of the improvement in fit quality of the newly refined NMR structure over the original X-ray structure stems from the fact that the positions of the hydrogens in X-ray structures are unknown, and are added to the structure by model building using programs such as REDUCE[29] or MOLMOL.[32] If the HN-N-Cα-Hα dihedral angle is derived from the newly refined structure using the common assumption θ = ϕ − 60° the fit quality drops to a level that is not much better than the original X-ray structure (Table 1). As was found previously,[14, 24] and also can be seen from the fifth column in Table 1, most of this increase in rmsd is related to the out-of-peptide-plane angle Δϕ, but small deviations of the Cα-Hα vector from its idealized orientation also contribute a non-negligible amount. Indeed, when Hα is positioned in the plane that bisects the N-Cα-Cβ and N-Cα-C′ planes, i.e. θHNHα = (θHNCβ + θHNC′+ 360°)/2, the fit to the Karplus equation is slightly worse (0.37 vs 0.34 Hz).
Table 1.
Rmsd between measured 3J couplings and values predicted by the Karplus equations.a
| 3JHNHα | 3JC′C′ | ||||
|---|---|---|---|---|---|
| angle used for Karplus equation | |||||
| Model | θHNHα | (θHNCβ + θHNC′ + 360°)/2 | (ϕ − 60°) c | (ϕ − 60° + Δϕ)d | ϕ |
| 1IGD | 0.76 | 0.71 | 0.74 | 0.72 | 0.29 |
| REDOe | 0.76 | 0.74 | 0.76 | 0.69 | 0.28 |
| Xray/NMRf | 0.62 | 0.71 | 0.68 | 0.63 | 0.26 |
| 2OED | 0.43 | 0.48 | 0.58 | 0.51 | 0.19 |
| New | 0.34 b | 0.37 b | 0.69 | 0.43 | 0.12 |
In units of Hz, excl. residues L12, D40, and G41. Predicted values are derived from the previously parameterized Karplus equation,[13] 3JHNHα = 7.97 × cos2θ − 1.26 × cosθ + 0.63 Hz, and the newly parameterized 3JC′C′ = 1.61 × cos2ϕ − 0.93 × cosϕ + 0.55 Hz.
The rmsd between θHNHα and (θHNCβ + θHNC′ + 360°)/2 in the newly refined model is 1.2°.
Using θ = ϕ − 60°, where ϕ is the C′i−1-Ni -Cαi -C′i dihedral angle.
Using θ = ϕ − 60° + Δϕ, where Δϕ is the out-of-plane angle observed in the newly refined NMR structure.
X-ray structure calculated from the 1IGD structure factors using PDB_REDO.[30]
Structure calculated using joint 1IGD X-ray structure factors and 2OED NMR restraints. Coordinates taken from the supporting information of Rinaldelli et al.[31]
Only in exceptional cases, such as the present study of GB3, are there sufficient experimental restraints to define deviations from idealized geometry for positioning hydrogens in a protein structure from NMR data. In practice, therefore when using 3JHNHα couplings in structure determination, the 0.69 Hz value in Table 1 represents the limit of precision at which 3JHNHα can be interpreted in structural terms, even while inherently it is considerably more accurate at describing the HN-N-Cα-Hα dihedral angle.
Fit of 3JC′C′ values to Karplus equation
Measurement of 3JC′C′ in isotopically uniformly enriched proteins has been demonstrated previously,[33] and was shown to be useful for sequential assignment in intrinsically disordered proteins.[34] Quantitative measurement of 3JC′C′ was also shown feasible for rather slowly tumbling proteins (τc ≈ 12 ns), even prior to the introduction of highly sensitive cryogenic probeheads.[35] Here, we used a slightly modified 3D NMR experiment that does not require the 2-spin approximation used in prior work, and which yields cross peak/diagonal peak intensity ratios between sequential amide groups that are proportional to tan2(πJC′C′T) (See Figure S1 of the Supporting Information). A projection of the 3D spectrum on the 15N-15N plane (Figure 2) illustrates the excellent spectral resolution and sensitivity that can be obtained, enabling the measurement of a nearly complete set of 3JC′C′ couplings (Table S2 of the Supporting Information). Spectra were recorded at 15 and 25 °C, and the pairwise rmsd between these two sets of measurements was 0.06 Hz, indicating a random error of only 0.03 Hz in their averaged values.
Figure 2.

Projection of the 500 MHz 3D HN(COCO)NH spectrum of GB3 on the 15N-15N (F1, F2) plane, recorded at 298 K. The projection extended from 10.5 to 7.0 ppm in the HN (F3) dimension. Cross peak to diagonal peak ratios correspond to tan2(πJC′C′T), with the 13C′-13C′ de-/re-phasing interval T set to 100 ms. Cross peaks are labeled, and peaks marked × show the correlations between N35 15Nδ (with and without 2H isotope shift) and D36 15N.
A fit of the 3JC′C′ values to the newly refined structure of GB3, calculated without using 3JC′C′ or 3JHNHα restraints, yields the following optimized Karplus equation:
| (1) |
with an rmsd of 0.12 Hz between measured and predicted couplings (Fig. 3). For comparison, this rmsd increases from 0.12 to 0.29 Hz when using ϕ angles taken from the high resolution X-ray structure (PDB entry 1IGD). A small, 4% drop in this rmsd value is obtained when using the PDB-REDO refinement[30] of the 1IGD structure factors. A slightly larger drop (~10%) is obtained for the joint X-ray/NMR refinement,[31] but a considerably larger decrease (~35%) is observed for the original 2OED NMR structure (Table 1). As mentioned above, the finding that the improvement in the 3J fit of the joint X-ray/NMR refined structure over the original X-ray structure is modest presumably results from the weak weight assigned to the RDC restraints, also reflected in a minimal backbone coordinate rmsd relative to the 1IGD X-ray structure (see Table S1 of the Supporting Information). However, our finding that the joint X-ray/NMR refinement consistently yields 3JC′C′ and 3JHNHα rmsd values that are considerably higher than obtained for the 2OED NMR structure also points to true differences between the structures in the crystalline state and in free solution. Indeed, intermolecular H-bonding results in a continuous plane of β-sheet in the crystalline state,[15] and in all likelihood contributes to this modest difference in backbone structure.
Figure 3.

Plot of experimental 3JC′C′ values against the backbone torsion angle ϕ. The solid line corresponds to the Karplus equation (eq 1). Red data points correspond to ϕ angles extracted from the X-ray structure (PDB entry 1IGD)[15]; black data points correspond to the RDC-refined GB3 structure. Dynamically disordered residues (L12, D40, and G41, previously identified on the basis of 15N relaxation order parameters S2 <0.7, axially symmetric diffusion model,[25] are excluded from the plot. The rmsd between observed and best-fitted 3JC′C′ values is 0.12 Hz.
The experimental 3JC′C′ values in GB3 span a range of 2.46 Hz, which is 20-fold larger than the rmsd in their fit to the Karplus equation. This is nearly the same ratio as observed for 3JHNHα (range of 7.2 Hz, versus 0.34 Hz rmsd). However, as discussed above, from a practical perspective the interpretation of 3JHNHα couplings is limited to an uncertainty of 0.69 Hz, due to the fact that the deviations from idealized geometry for hydrogen positions normally cannot be determined. Therefore, 3JC′C′ couplings intrinsically have much higher restraining power when determining a protein structure from NMR data, in particular for small proteins where these couplings can be measured at very high accuracy.
Factors other than ϕ impacting 3JC′C′
Although the fit of the 3JC′C′ couplings to the Karplus equation is very good, the residual we observe is nearly four times larger than the 0.03 Hz experimental measurement uncertainty. Although errors in the coordinates of the NMR-refined structure will contribute to the 0.12 Hz rmsd, the scatter does not correlate with the steepness of the curve, and therefore does not appear to be dominated by uncertainty in ϕ. Variations in the amplitude of ϕ-angle fluctuations among different residues would also scale the couplings differentially and thereby contribute to the scatter.[11] However, for the protein ubiquitin a very long (1-ms) molecular dynamics trajectory has been reported,[23] which shows that the amplitude of ϕ-angle fluctuations in the well ordered regions of the protein is quite homogeneous (rmsd of 13±3°), and insufficiently large to lead to significant differential scaling of the 3JC′C′ couplings.[11] The same conclusion must apply for GB3, which also is a very well structured protein.
We therefore carried out quantum calculations to evaluate what other geometric factors can be expected to significantly impact 3JC′C′. A tripeptide Gly-Ala-Gly was first built using the program Molden,[36] both in helical (ϕ = −50, ψ = −50) and extended (ϕ = −120, ψ = 120) backbone conformations. The tripeptide then was modified in silico to generate a smaller dipeptide analogue (Ac-Ala-NH-CH3). Four water molecules were placed near the carbonyl and amide groups, in a linear hydrogen bond geometry (Fig. 4a). The water molecule that is hydrogen bonded to the C-terminal amide cap was rotated towards the N-methyl group within the peptide plane by 20° (i.e. making the C′–N–Owater angle 140° instead of 120°) such that this water molecule does not significantly vary its interaction with nearby water molecules when changing backbone torsion angles.
Figure 4.
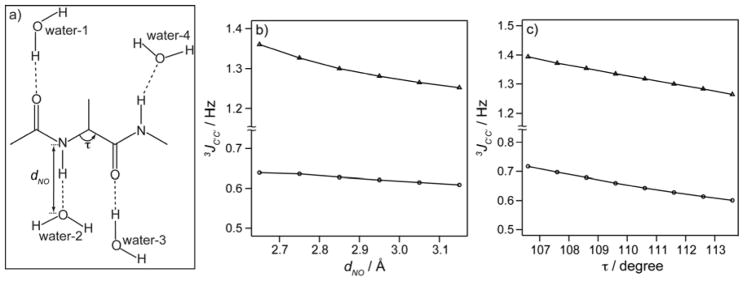
Effect of H-bonding on 3JC′C′ as obtained from DFT calculations. (a) The dipeptide analog Ac-Ala-NH-CH3 H-bonded to four water molecules, used in the DFT calculations. (b) 3JC′C as a function of dNO, the distance between the O of water-2 and the Ala N atom, for α-helical (circles) and β-sheet (triangles) backbone geometry. (c) 3JC′C′ as a function of the τ angle, for α-helical (circles) and β-sheet (triangles).
The O–O or N–O distance were independently stepwise increased from 2.65 to 3.15 Å, except for the water H-bonded to the C-terminal N-methyl group, which was kept fixed at dNO = 2.85 Å. Full results are included in Tables S3–S5 of the Supporting Information. As can be seen from Table S4, the impact of removing H-bonds on 3JC′C′ is to a first approximation additive, and therefore these H-bonds may be considered separately. The largest impact is observed when altering the distance to water-2 (Fig. 4), which accepts an H-bond from Ala-NH. For the extended backbone geometry, the computed 3JC′C′ decreases from 1.36 to 1.25 Hz when dNO is increased from 2.65 to 3.15 Å, but 3JC′C′ variation for the helical ϕ = −50° value is considerably smaller (Fig. 4b).
Variations in the N Cα C′ bond angle, τ, also are known to occur in protein structures[37] and according to the DFT calculations can have a significant impact on 3JC′C′, decreasing by ~0.15 Hz when τ is increased from 106.6 to 113.6°, both in extended and helical geometries (Fig. 4c). The DFT calculations also point to a non-negligible effect of amino acid type, both for 3JC′C′ and for 3JHNHα (Table S5 in the Supporting Information) and a substantial effect of the χ1 torsion angle on both 3JC′C′ and 3JHNHα is seen for Ser.
The above calculations confirm that variations in H-bonding and valence angles as well as residue type and their sidechain χ1 torsion angle are likely responsible for most of the residual scatter seen in Figures 1 and 3. Substantial outliers in these fits would be expected if, for example, an amide group were completely lacking an H-bond, or if a large deviation from ideality for τ would occur. The absence of such large outliers therefore indicates that both H-bonding and backbone valence angles are restricted to narrow ranges in GB3.
Figure 1.

Plot of 3JHNHα values measured for GB3 against the H-N-Cα-Hα dihedral angle, θ (Note: θ ≈ ϕ − 60°). Dihedral angles derived from the coordinates of the RDC-refined NMR structure with amide protons in their RDC-optimized positions (red data points; θ = ϕ − 60° + Δϕ), with HN atoms moved to their idealized in-peptide plane positions (black data points; θ = ϕ − 60°), or with both HN and Hα atoms in their RDC-optimized positions (green data points; θ being the H-N-Cα-Hα dihedral angle).
Resolving degeneracies in the Karplus curve
Ignoring the small out-of-plane angles, Δϕ, and the deviations from ideal tetrahedral geometry at Cα, both 3JC′C′ and 3JHNHα report on the same backbone torsion angle, ϕ. However, the corresponding Karplus curves are shifted by 60° relative to one another (Fig. 5a). A plot of Karplus-predicted 3JC′C′ vs 3JHNHα values highlights that the 3JHNHα degeneracy with respect to ϕ, around the extrema of the Karplus curve (ϕ ≈ −120° + N×90°), is lifted by 3JC′C′, and vice versa, degeneracies in the 3JC′C′ values around ϕ ≈ 0°, 180°, and ±73° are resolved by 3JHNHα (Fig. 5b). The combination of these two sets of 3J couplings therefore presents a very precise measure for the ϕ angle in proteins, allowing this torsion angle to be determined at an accuracy that can exceed those of the best X-ray structures. The highly complementary nature of 3JC′C′ and 3JHNHα, together with the high precision at which these values can be measured in flexible regions of proteins, also will make their joined use invaluable in defining the distribution of torsion angles sampled in intrinsically disordered proteins (IDPs) or large flexible loop regions.
Figure 5.
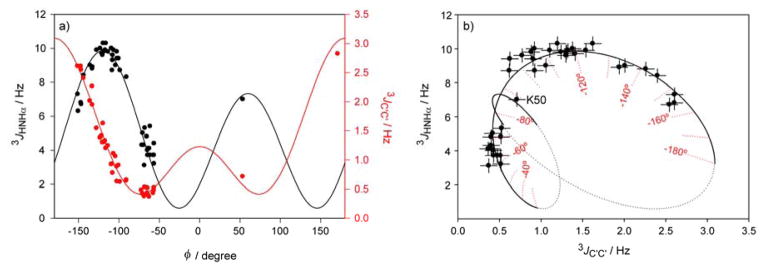
Resolving ambiguities in the Karplus relation for determining the backbone torsion angle ϕ in proteins. (a) Karplus relations between 3JC′C′ (red) or 3JHNHα(black) values and the backbone torsion angle, ϕ, assuming the out-of-plane angle Δϕ = 0°. (b) Plot of 3JC′C′ vs 3JHNHα values in GB3, again assuming Δϕ = 0°. Only residues that are well-ordered (S2 ≥ 0.7) on the basis of prior 15N relaxation studies[25] are shown. The solid line corresponds to the relation between the predicted values in the most favored region of the Ramachandran plot (−180°<ϕ< −30°; 30°<ϕ<90°), with the dotted section corresponding to sparsely populated or forbidden ϕ angles. For calculating this curve, Δϕ = 0°. Error bars correspond to ±0.4 Hz for 3JHNHα and to ±0.1 Hz for 3JC′C′. Residue K50 adopts a positive ϕ angle (ϕ = 53°).
Methods
NMR Measurements
GB3 3JC′C′ values were derived from two 3D HN(COCO)NH spectra, measured with the pulse sequence of Supporting Information Figure 1, using a 2.5 mM sample of uniformly 13C/15N-enriched GB3 in 20 mM sodium phosphate, 50 mM NaCl, 0.05% w/v sodium azide, pH 6.6, 5% D2O. The two spectra were recorded on a Bruker Avance-III 500 MHz NMR spectrometer equipped with a cryogenic z-gradient probehead, with sample temperatures set to 288 K and 298 K. The 13C and 15N carriers were set at 177 and 118 ppm, respectively. The time domain matrix consisted of 200* × 200* × 1024* complex data points, or acquisition times of 60.0 ms (t1, 15N), 60.0 ms (t2, 15N) and 146.3 ms (t3, 1H), and approximately 88 hours of total measurement time, using 4 scans per free induction decay (FID), and a 1.5-s interscan delay. The time domain data were apodized with a 60°-shifted sine-bell window function in all dimensions, and zero-filled prior to Fourier transformation to yield high digital resolution. The spectra were processed and analyzed using the software package nmrPipe.[38]
Structure calculations
An extensive set of previously reported backbone 1DNH, 1DCαC′, 1DNC′ and 1DCαHα RDCs measured under 5 alignment conditions for wild type GB3, and 6 sets of 1DNH values measured for a series of charge-perturbed mutants of GB3 aligned in liquid crystalline Pf1, was supplemented by 3 sets of 1DCαHα and 1DCαCβ RDCs for wild type GB3, aligned in Pf1,[39] polyethylene glycol,[40] and bicelles,[41] respectively.
The structure of GB3 was refined using the Xplor-NIH program[42] starting from the coordinates of the RCSB PDB deposition 2OED.[16] In addition to the N-H, Cα-Hα, C′-Cα, and C′-N RDC restraints collected in five different alignment media, previously used to derive the 2OED model, the refinement protocol included previously reported N-H, CαHα, and C′-Cα RDCs measured in Pf1 for GB3 mutants K19A/D47K, K19E/D40N, K19E/K4A-N-His6, K19E/K4A-C-His6, K19A/T11K, and K19E/K4A.[18] The input RDCs also included N-H, Cα-Hα, and HN-Hα RDCs measured for wild type GB3 in Pf1,[17] as well as newly collected N-H, Cα-Hα and Cα-Cβ RDCs from samples of wild-type GB3 in Pf1, bicelles and PEG, and N-H, Cα-Hα RDCs from K4A/K19E/V42E-CHis6, K19A/V42E/D47K, and K4A/K19E/V42E mutants in Pf1. Fitting of variable-distance HN-Hα RDCs was done using the xdip term in XPLOR[42] with a scaling constant of 11.13 with respect to the N-H RDCs, corresponding to the libration-corrected N-H bond length of 1.041Å. Unlike the 2OED deposition, no non-crystallographic symmetry restraint terms with respect to the 1IGD crystal structure were used in the refinement. Backbone/backbone hydrogen bonding geometries were enforced via a previously described database potential of mean force,[43] modified to include refinement against experimental through-H-bond 3hJNC′ couplings.[44]
The empirical force field used in the refinement was slightly modified to better cope with a large number of input backbone RDC restraints. N-H and Cα-Hα bond lengths were set to 1.02 and 1.09 Å, and improper torsion angles governing positioning of the HN and Hα atoms were softened from their default setting of 500 kcal mol−1 rad−2 to 50 kcal mol−1 rad−2. The empirical force field parameters used to describe the alignment tensor pseudo molecules were strengthened by introducing three additional bond and three additional angle restraint terms. In order to evaluate the effect of softening the empirical potential used to restrain the peptide bond angle Ω to 180°, the force constants for the corresponding improper terms were decreased by factors of 3, 5, and 10 with respect to their defaults settings of 500 kcal mol−1 rad−2, with 5-fold reduction yielding the best agreement between calculated structures and 3JHαHN and 3JC′C′ couplings in terms of rmsd observed in a Karplus equation fit. Note that these couplings were not used as input restraints, and that no ϕ torsion angle restraints were used for structure refinement.
Due to differences between the alignment conditions of the individual samples from which the fitted RDC data were extracted, a total of 24 alignment tensors were used to fit the entire set of RDCs. The RDC data were found to fully cover the 5-dimensional space of alignment tensors as judged by SECONDA analysis.[45, 46] Therefore, RDC force constants were optimized by cross-validation, frequently resulting in values lower than those based solely on alignment tensor magnitudes and rhombicities. To account for the differences in static coupling magnitudes of various RDC types, force constant multipliers of 26, 75, 0.24, and 5.0 were used for C-C, C-N, C-H, and H-H RDCs. During structure refinement, both eigenvalues and orientations of the alignment tensors were adjusted every 0.1 ps by SVD-fitting. The structure refinement used Cartesian dynamics and consisted of 200 steps of conjugate gradient minimization, followed by a 2-ps high temperature stage at 2000 K, followed with a 100 ps simulated annealing schedule from 200 K to 0 K, and finishing with 200 steps of conjugate gradient minimization. During the entire procedure, non-bonded interactions were modeled by quartic repulsive-only energy terms, using a force constant of 4.0 kcal mol−1 A−2. All van der Waals radii are scaled by a factor of 0.81. The actual refinement script and all input tables as well as the coordinates of the refined model can be downloaded from http://spin.niddk.nih.gov/bax/structures/GB3_RDC_refinement_2014.zip
Supplementary Material
Highlights.
A convenient, sensitive, and accurate method for 3JC′C′ measurement is presented
Karplus equation fits for 3JC′C′ and 3JHNHα in proteins are limited by the accuracy of these structures
Best 3JHNHα Karplus equation fit is obtained when using the experimentally derived H-N-Cα-Hα dihedral angle, rather than ϕ
3JC′C′ values in proteins are reliable ϕ reporters, minimally impacted by residue type and variations in H-bonding.
Acknowledgments
This work was supported by the Intramural Research Program of the National Institute of Diabetes and Digestive and Kidney Diseases and by the Intramural Antiviral Target Program of the Office of the Director, NIH. J.H. Lee is the recipient of a KVSTA Fellowship and F. Li acknowledges financial support from the China Scholarship Council. This study utilized the high-performance computational capabilities of the Biowulf Linux cluster at the National Institutes of Health, Bethesda, Maryland. (http://biowulf.nih.gov).
References
- 1.Karplus M. J Chem Phys. 1959;30:11. [Google Scholar]
- 2.Bystrov VF. Prog NMR Spectrosc. 1976;10:41. [Google Scholar]
- 3.Williamson KL. J Am Chem Soc. 1963;85:516. [Google Scholar]
- 4.Laszlo P, Schleyer PV. J Am Chem Soc. 1963;85:2017. [Google Scholar]
- 5.Smith GV, Kriloff H. J Am Chem Soc. 1963;85:2016. [Google Scholar]
- 6.Chapman OL. J Am Chem Soc. 1963;85:2014. [Google Scholar]
- 7.Karplus M. J Am Chem Soc. 1963;85:2870. [Google Scholar]
- 8.Haasnoot CAG, Deleeuw F, Altona C. Tetrahedron. 1980;36:2783. [Google Scholar]
- 9.Pardi A, Billeter M, Wuthrich K. J Mol Biol. 1984;180:741. doi: 10.1016/0022-2836(84)90035-4. [DOI] [PubMed] [Google Scholar]
- 10.MacArthur MW, Thornton JM. J Mol Biol. 1996;264:1180. doi: 10.1006/jmbi.1996.0705. [DOI] [PubMed] [Google Scholar]
- 11.Bruschweiler R, Case DA. J Am Chem Soc. 1994;116:11199. [Google Scholar]
- 12.Case DA, Scheurer C, Bruschweiler R. J Am Chem Soc. 2000;122:10390. [Google Scholar]
- 13.Vogeli B, Ying JF, Grishaev A, Bax A. J Am Chem Soc. 2007;129:9377. doi: 10.1021/ja070324o. [DOI] [PubMed] [Google Scholar]
- 14.Wang AC, Bax A. J Am Chem Soc. 1996;118:2483. [Google Scholar]
- 15.Derrick JP, Wigley DB. J Mol Biol. 1994;243:906. doi: 10.1006/jmbi.1994.1691. [DOI] [PubMed] [Google Scholar]
- 16.Ulmer TS, Ramirez BE, Delaglio F, Bax A. J Am Chem Soc. 2003;125:9179. doi: 10.1021/ja0350684. [DOI] [PubMed] [Google Scholar]
- 17.Vogeli B, Yao L, Bax A. J Biomol NMR. 2008;41:17. doi: 10.1007/s10858-008-9237-3. [DOI] [PMC free article] [PubMed] [Google Scholar]
- 18.Yao L, Voegeli B, Ying JF, Bax A. J Am Chem Soc. 2008;130:16518. doi: 10.1021/ja805654f. [DOI] [PMC free article] [PubMed] [Google Scholar]
- 19.Edison AS. Nature Structural Biology. 2001;8:201. doi: 10.1038/84921. [DOI] [PubMed] [Google Scholar]
- 20.Berkholz DS, Driggers CM, Shapovalov MV, Dunbrack RL, Jr, Karplus PA. Proc Natl Acad Sci U S A. 2012;109:449. doi: 10.1073/pnas.1107115108. [DOI] [PMC free article] [PubMed] [Google Scholar]
- 21.Lindorff-Larsen K, Best RB, DePristo MA, Dobson CM, Vendruscolo M. Nature. 2005;433:128. doi: 10.1038/nature03199. [DOI] [PubMed] [Google Scholar]
- 22.Lange OF, Lakomek NA, Fares C, Schroder GF, Walter KFA, Becker S, Meiler J, Grubmuller H, Griesinger C, de Groot BL. Science. 2008;320:1471. doi: 10.1126/science.1157092. [DOI] [PubMed] [Google Scholar]
- 23.Piana S, Lindorff-Larsen K, Shaw DE. Proc Natl Acad Sci U S A. 2013;110:5915. doi: 10.1073/pnas.1218321110. [DOI] [PMC free article] [PubMed] [Google Scholar]
- 24.Maltsev AS, Grishaev A, Roche J, Zasloff M, Bax A. J Am Chem Soc. 2014;136:3752. doi: 10.1021/ja4132642. [DOI] [PMC free article] [PubMed] [Google Scholar]
- 25.Hall JB, Fushman D. J Biomol NMR. 2003;27:261. doi: 10.1023/a:1025467918856. [DOI] [PubMed] [Google Scholar]
- 26.Yao L, Vogeli B, Torchia DA, Bax A. J Phys Chem B. 2008;112:6045. doi: 10.1021/jp0772124. [DOI] [PubMed] [Google Scholar]
- 27.Rexroth A, Schmidt P, Szalma S, Geppert T, Schwalbe H, Griesinger C. J Am Chem Soc. 1995;117:10389. [Google Scholar]
- 28.Harbison GS. J Am Chem Soc. 1993;115:3026. [Google Scholar]
- 29.Word JM, Lovell SC, Richardson JS, Richardson DC. J Mol Biol. 1999;285:1735. doi: 10.1006/jmbi.1998.2401. [DOI] [PubMed] [Google Scholar]
- 30.Joosten RP, Salzemann J, Bloch V, Stockinger H, Berglund AC, Blanchet C, Bongcam-Rudloff E, Combet C, Da Costa AL, Deleage G, Diarena M, Fabbretti R, Fettahi G, Flegel V, Gisel A, Kasam V, Kervinen T, Korpelainen E, Mattila K, Pagni M, Reichstadt M, Breton V, Tickle IJ, Vriend G. J Appl Crystallogr. 2009;42:376. doi: 10.1107/S0021889809008784. [DOI] [PMC free article] [PubMed] [Google Scholar]
- 31.Rinaldelli M, Ravera E, Calderone V, Parigi G, Murshudov GN, Luchinat C. Acta Crystallogr Sect D-Biol Crystallogr. 2014;70:958. doi: 10.1107/S1399004713034160. [DOI] [PMC free article] [PubMed] [Google Scholar]
- 32.Koradi R, Billeter M, Wuthrich K. J Mol Graph. 1996;14:51. doi: 10.1016/0263-7855(96)00009-4. [DOI] [PubMed] [Google Scholar]
- 33.Hu JS, Bax A. J Am Chem Soc. 1996;118:8170. [Google Scholar]
- 34.Bermel W, Bertini I, Felli IC, Lee YM, Luchinat C, Pierattelli R. J Am Chem Soc. 2006;128:3918. doi: 10.1021/ja0582206. [DOI] [PubMed] [Google Scholar]
- 35.Grzesiek S, Bax A. J Biomol NMR. 1997;9:207. doi: 10.1023/a:1018614505948. [DOI] [PubMed] [Google Scholar]
- 36.Schaftenaar G, Noordik JH. J Comput-Aided Mol Des. 2000;14:233. doi: 10.1023/a:1008163129031. [DOI] [PubMed] [Google Scholar]
- 37.Laskowski RA, Moss DS, Thornton JM. J Mol Biol. 1993;231:1049. doi: 10.1006/jmbi.1993.1351. [DOI] [PubMed] [Google Scholar]
- 38.Delaglio F, Grzesiek S, Vuister GW, Zhu G, Pfeifer J, Bax A. J Biomol NMR. 1995;6:277. doi: 10.1007/BF00197809. [DOI] [PubMed] [Google Scholar]
- 39.Hansen MR, Mueller L, Pardi A. Nature Struct Biol. 1998;5:1065. doi: 10.1038/4176. [DOI] [PubMed] [Google Scholar]
- 40.Ruckert M, Otting G. J Am Chem Soc. 2000;122:7793. [Google Scholar]
- 41.Ottiger M, Bax A. J Biomol NMR. 1998;12:361. doi: 10.1023/a:1008366116644. [DOI] [PubMed] [Google Scholar]
- 42.Schwieters CD, Kuszewski JJ, Tjandra N, Clore GM. J Magn Reson. 2003;160:65. doi: 10.1016/s1090-7807(02)00014-9. [DOI] [PubMed] [Google Scholar]
- 43.Grishaev A, Bax A. J Am Chem Soc. 2004;126:7281. doi: 10.1021/ja0319994. [DOI] [PubMed] [Google Scholar]
- 44.Cornilescu G, Ramirez BE, Frank MK, Clore GM, Gronenborn AM, Bax A. J Am Chem Soc. 1999;121:6275. [Google Scholar]
- 45.Hus JC, Bruschweiler R. J Biomol NMR. 2002;24:123. doi: 10.1023/a:1020927930910. [DOI] [PubMed] [Google Scholar]
- 46.Tolman JR. J Am Chem Soc. 2002;124:12020. doi: 10.1021/ja0261123. [DOI] [PubMed] [Google Scholar]
Associated Data
This section collects any data citations, data availability statements, or supplementary materials included in this article.