

Abstract
Purpose
Predicting atoms in a potential drug compound that are susceptible to oxidation by cytochrome P450 (CYP) enzymes is of great interest to the pharmaceutical community. We aimed to develop a computational approach combining ligand- and structure-based design principles to accurately predict sites of metabolism (SoMs) in a series of CYP2C9 substrates.
Methods
We employed the reactivity model, SMARTCyp, ensemble docking, and pseudo-receptor modeling based on quantitative structure-activity relationships (QSAR) to account for influences of both the inherent reactivity of each atom and the physical structure of the CYP2C9 binding site.
Results
We tested ligand-based prediction alone (i.e. SMARTCyp), structure-based prediction alone (i.e. AutoDock Vina docking), the linear combination of the SMARTCYP and docking scores, and finally a pseudo-receptor QSAR model based on the docked compounds in combination with SMARTCyp. We found that by using the latter combined approach we were able to accurately predict 88% and 96% of the true SoMs, within the top-1 and top-2 predictions, respectively.
Conclusions
We have outlined a novel combination approach for accurately predicting SoMs in CYP2C9 ligands. We believe that this method may be applied to other CYP2C9 ligands as well as to other CYP systems.
Keywords: Cytochrome P450, site of metabolism prediction, quantitative structure-activity relationship, pseudo-receptor modeling, ensemble docking, SMARTCyp, protein flexibility
Introduction
Cytochrome P450 (CYP) enzymes are responsible for catalyzing the oxidation of a variety of both endogenous and exogenous compounds(1). Of special interest are CYP1A2, CYP2C9, CYP2C19, CYP2D6 and CYP3A4, which metabolize the majority of commonly prescribed drug molecules(2). CYP enzymes are a constant and critical consideration in the drug discovery and development process due to their pervasive role in drug metabolism and elimination(3). If a compound is metabolized too quickly by a given CYP enzyme, it will not reach a sufficient concentration to achieve the desired pharmacologic response. Furthermore, some compounds are metabolized into toxic byproducts which can lead to the abandonment of otherwise effective drug candidates(4). To circumvent such problems, medicinal chemists often aim to slow or alter the metabolism by identifying and modifying “soft spots” in the compound(5-6).
Computational methods have become one of the most widely used tools to predict these “soft spots”, or sites of metabolism (SoM), in CYP substrates(5) A variety of ligand-based, structure-based, and combinational techniques have been reported to predict SoMs in CYP substrates(7-8). Ligand-based techniques focus specifically on the ligand properties in order to predict which atoms are the most likely SoMs; these techniques include reactivity predictions, pharmacophore models, and rule-based methods(9). Ligand-based methods are advantageous in that they are highly efficient, however, these methods neglect potentially important structural features of the CYP binding site that play an important role in determining the SoM. On the other hand, structure-based approaches, such as docking and molecular dynamics simulations(10), incorporate the topography of the CYP enzyme structure to predict whether a given ligand will fit into the binding pocket and its proximity to the reactive heme moiety within a specific CYP enzyme. While these methods allow for incorporation of structural features, they can be time consuming and are often limited by the accuracy of the scoring function or force field. Although, in some cases ligand-based(11-12) or structure-based approaches(10, 13) alone have proven useful, recently, methods that combine both ligand- and structure- based approaches have emerged as a promising alternative (8, 14).
Combination methods aim to link ligand-specific data with the structural constraints of a given CYP enzyme. These methods may be of critical importance for substrates with complex metabolism pathways, compounds that are metabolized by multiple CYP isoforms, or substrates with multiple SoMs. Terbinafine, for instance, is known to be metabolized by at least seven CYP isozymes where alternate routes of metabolism can result in the production of several different metabolites(15). In drugs like Terbinafine, including multiple sources of information may be necessary for more accurate predictions of the SoMs and the resultant products. For instance, structural restrictions in binding site of one CYP isozyme may favor metabolism at a certain, less intrinsically reactive atom, while binding to another CYP without these structural restraints may favor metabolism at a different site. These differences in metabolism across CYP isozymes would be difficult to deduce using a ligand-based or structure-based approach alone.
Many groups(13, 16-19), including ours(20), have reported successful SoM prediction in CYP substrates using combination based approaches. In our previous study, we compared SoM prediction in CYP2C9 substrates using four approaches; the NAT reactivity model reported by Olsen and co-workers(21), docking to the crystal structure alone, docking to a “pseudo-apo” ensemble of structures, and a combination approach involving both the NAT model and docking(20). Of all methods tested, we found that combining the NAT model with ensemble docking was the most successful, accurately ranking nearly 50% of the compounds in the top-1 position(20). The success of this approach was in part attributed to the inclusion of critical binding site conformations during docking via the use of a protein ensemble which led to a ∼10% improvement in identifying reactive ligand poses as compared to docking to the crystal structure alone(20).
While the inclusion of protein flexibility using an ensemble of protein structures improved the generation of docking poses that were consistent with the experimentally known SoM, the number and diversity of false poses also increased. This increase in binding poses presents a significant challenge for the scoring functions used in docking and was thought to be the primary cause of the reduced prediction accuracy of docking observed in the top-1, top-2 and top-3 positions(20). The poor docking performance in the ensemble is likely one of the key reasons that the improvement in SoM prediction accuracy in the ensemble was only modest compared to using only the crystal structure(20). Based on our previous findings, we have developed a revised methodology to better incorporate protein flexibility and to better rank predicted poses in CYP2C9. The two main methodological improvements compared to our previous approach are a pre-filtering process to reduce the size of the protein ensemble used in docking and the implementation of QSAR modeling to accurately rank the binding poses relevant for SoM prediction. Compared to the existing methods cited above, our approach differs in method by which the data from docking and SMARTCyp are combined and incorporated into a modified QSAR scheme. To the best of our knowledge, this is the first attempt to directly incorporate SMARTCyp reactivity data into a QSAR model that is based on structural protein and ligand data to predict SoMs in CYP2C9.
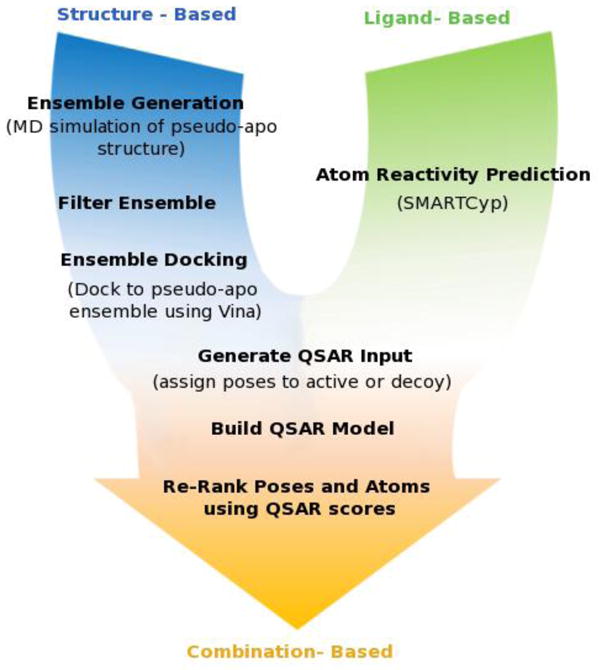
A schematic of the revised procedure is shown in Figure 1. As with our previous model, both structure- and ligand-based principles were used in the current scheme; SMARTCyp, a successor of the NAT model (22) was used to predict reactivity scores for each atom and ensemble docking was used to incorporate structural features of CYP2C9. We compared predictions in the crystal structure alone to predictions in a “pseudo-apo” ensemble which was selected based on a pre-filtering step used to isolate structures relevant for ligand binding. We found that incorporating “pseudo-apo” simulations increased the conformational space covered by the binding pocket allowing for successful docking of nearly all ligands. This was in stark comparison to the crystal structure alone, where less than 65% of the ligands tested could be successfully docked. In this study, as with our previous study, we noticed that the scoring function used in docking did not always accurately predict the correct binding poses. Due to the difficulty of accurately ranking poses using the docking scoring function, we introduced a quantitative structure-activity relationship (QSAR) model to differentiate between poses. Using the poses generated by docking and the reactivity scores generated by SMARTCyp, we produced a dataset suitable for QSAR modeling. A modified, in-house version of the RAPTOR(23) pseudo-receptor QSAR suite was used to develop a pseudo-receptor model to identify docking poses that correctly predict SoMs in our CYP2C9 ligand data set. With this approach we were able to significantly improve SoM prediction in the CYP2C9 ligand data set tested. Using a combination of docking to the pseudo-apo ensemble, SMARTCyp, and QSAR we were able to accurately predict the SoM in 96% of ligands within the top-2 positions.
Figure 1.
Materials and Methods
Ligand Library Preparation
A set of 73 structurally diverse CYP2C9 substrates with known SoMs were used for this study (Supplementary Information Table SI). The compounds were based on those used by Danielson et. al(20), which were taken from the literature(24) and the University of Washington Metabolism and Transporter Drug Interaction database© (www.druginteractioninfo.org). All possible stereoisomers (in case that stereochemistry was not defined for the structure) and relevant protonation states were considered as unique chemical structures resulting in 139 total ligand structures. Ligands were built using Maestro and minimized using MacroModel as previously described(20).
SMARTCyp
SMARTCyp(22) is a reactivity model that predicts the reactivity at C, S, N, and P positions in a given ligand based on a series of over 40 rules derived from quantum calculations. SMARTCyp 2.4.2 was used to predict likely SoMs based on reactivity energies and atom accessibility in each of the 139 total ligand structures. The atoms of each ligand were then ranked according to the predicted abstraction energy, also referred to as the SMARTCyp score. In cases where one or more ligand variants existed, for instance two possible protonation states of the same ligand, the best (lowest) overall score was selected for each atom. The percentage of correctly predicted SoMs in the top-1, top-2, and top-3 positions were calculated using the experimentally known SoMs. In cases where a given substrate had more than one known SoM, only the highest predicted SoM was considered. This criterion was also used for all subsequently described methods.
Static Crystal Docking
The 1R9O crystal structure of CYP2C9 was used for the static docking studies. The co-crystalized ligands, flurbiprofen and glycerol, along with all crystal waters were removed. The crystallized heme (deoxygenated) was replaced by an oxygenated heme. Protonation and tautomer states of histidine and rotamer states of asparagine, glutamine and histidine were assigned using Reduce(25).
The ligand library was prepared for docking using the PyMol plugin developed by Danielson et.al(26).
Autodock Vina
Ligands were docked using AutoDock Vina (Vina). The docking volume was defined using our PyMol plugin(26). The selected docking cuboid was roughly 20Å on each side and included the active face of the heme and surrounding residues that could be relevant for binding. Default values were used for all docking parameters in Vina. For each unique ligand, 10 total docking poses were generated and 5kcal/mol was chosen as the maximum energy difference allowed between the best and any other reported docking pose.
Ranking
Docking success was evaluated based on the distance between the known SoM and the reactive oxygen of the heme moiety. Because docking to multiple similar protein structures can result in redundancy of several ligand poses, the poses were clustered using k-medoid clustering. K was iteratively adjusted such that the maximum RMSD between any two poses and the cluster center was less than 1.0Å. The pose with the best (lowest) docking score from each cluster was selected as the representative member for that cluster.
Next, docking poses of all protonation states and stereoisomers of a given ligand were pooled resulting in a single set of poses for each ligand containing all relevant stereoisomers, protonation and tautomeric states of the ligand. The combined poses were then ranked according to the docking score. If two poses had the same docking score, both would share the same rank, but the rank immediately following would reflect the inclusion of multiple poses. For instance assuming two poses had the same score and were ranked first, the next compound would be ranked in the third position to account for the two ligands that had been previously ranked higher.
A distance of 4.0Å or less between any heavy atom and the reactive oxygen was considered to be potentially reactive. Poses that did not have a heavy atom within 4.0Å of the reactive oxygen were omitted from the ranking scheme.
Next, each atom was assigned the best Vina docking score attained by any pose wherein the atom was within 4.0Å of the oxygen on the heme. The atoms were then ranked according to the assigned score and the percentage of accurately predicted SoMs that occurred in the top-1, top-2 and top-3 positions was calculated. In addition to determining the accuracy of SoM predictions in the top-3 positions, the overall docking success was determined for docking to the crystal structure and the ensemble. The overall docking success is defined as the percentage of ligands that could be successfully docked regardless of ranking. In other words, the overall docking success is a measure of how well the pose prediction portion of the docking algorithm performed exclusive of the scoring function.
Ensemble Generation
MD Simulations
An MD simulation of the pseudo-apo structure of CYP2C9 was used in the ensemble generation process. To generate the initial protein structure the ligand was removed from the CYP2C9 crystal structure, 1R9O.
The MD simulation was performed using Gromacs-4.5.5(27-28) and the Amber03 force field. The input structure was prepared using Reduce(25) to identify the proper rotamer, tautomer, and protonation states of histidine, and the proper rotamer states of asparagine and glutamine. The heme parameters were extracted from the literature(29). We opted to use an oxygenated heme model because the oxygen may be critical for the docking of certain ligands. Gromacs was used to solvate the system in an octagonal water box of SPC216 waters and 6 chlorine ions were added to neutralize the system. The box size was selected to guarantee a minimum distance of 15Å between solute and box edge.
The steepest descent method and particle mesh Ewald (PME) summation with a grid size of 0.12nm was used to carry out 1000 steps of energy minimization. To compute van der Waals interactions a switching function was applied between 1.0nm and the cut-off of 1.4nm. The LINCS algorithm(30) was used to constrain bonds containing hydrogen atoms. Next the hydrogen bond network of the surrounding waters was established using a 200ps MD simulation in which all but the waters were restrained. Simulations were performed at 300K using PME, Berendsen thermostat, and Parrinello-Rahman pressure coupling. The integration time step was 2fs. Finally a 400ps equilibration run was performed to equilibrate the system prior to the 10ns production run.
Ensemble Generation and Refinement
The initial ensemble was generated by extracting frames every 100ps from the pseudo-apo production run. The initial ensemble was then refined using a docking-based filtering process resulting in a 6 member ensemble. From the 73 ligands used in this study, 14 structurally diverse ligands (denoted in Table SI) were manually selected for ensemble refinement. These 14 ligands were docked to all members of the 100-member ensemble using AutoDock Vina, as described above. Ligand variants were combined to give a single set of poses for each ligand as previously described.
To determine which protein structures were able to best dock the 14-ligand training set, a fitness score was calculated for each protein structure as follows:
Where wi is one over the number of protein structures to which the ligand i was successfully docked and fi represents an assigned value based on the docking rank. Poses that were not successfully docked (e.g. did not have the known SoM within 4Å of the reactive oxygen) were given a score of 0, while those that were successfully docked were given a score between 1 and 5, based on the rank of the pose. The factor wi guarantees that protein structures are more likely selected for the refined ensemble that allow the successful docking of ligands that are difficult to dock. For example, assume that two ligands A and B dock successfully to protein structure S. Assume ligand B is successfully docked to 49 other protein structures (out of 100 structures in the initial ensemble) and ligand A is only docked successfully to S. As protein structure S seems to be unique and relevant for binding ligand A and structurally similar ligands, it should gain a high fitness value and be more likely to be included in the refined ensemble. This is achieved by the introduction of the weight (wi) which will be 1.0 (1/1) for ligand A but only 0.02 (1/50) for ligand B.
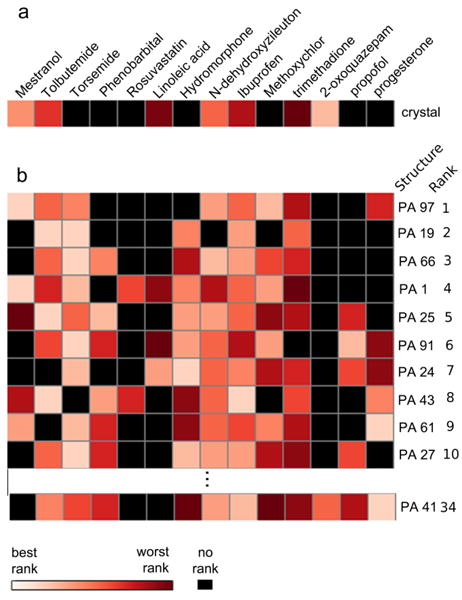
The protein structures from the ensemble were then ranked by fitness. We found that 13 out of 14 ligands could be successfully docked to at least one of the top-5 ranked protein structures. The remaining ligand, 2-oxoquazepam, was not successfully docked until the 34th ranked protein structure. Based on our previous findings that the inclusion of multiple protein conformations can be problematic for the docking scoring function, we felt that including 34 structures would be detrimental to the model. We tested the top-4, top-6, top-8, and top-10 protein structures on the entire ligand data set (data not shown) and found that selecting the top-6 structures achieved optimal template diversity.
Ensemble Docking
All 139 ligand structures were docked to the 6-member protein ensemble. Ensemble docking was performed in a similar fashion as to the static crystal docking described above. Again, all ligand variants from all ensemble members were pooled to produce a single set of poses for each ligand, the resultant poses were clustered and the cluster member with the highest docking score was selected.
Ranking
As with the static crystal docking, the atoms of each ligand were ranked according to the best docking score in which that atom was within 4.0Å of the reactive oxygen. The percentage of successfully predicted SoMs in the top-1, top-2 and top-3 positions were calculated as well as the overall docking success, as described above.
SMARTCyp +Docking
In an attempt to improve SoM ranking in the top-1, top-2, and top-3 positions, we combined SMARTCyp reactivity predictions with the docking results. A single combined score (CS) was calculated for each atom of a given ligand using the following function:
where Ri is the atom's SMARTCyp reactivity score (usually ranging from about 50 (best) to 100(worst)) and Si is the docking score from the highest ranked pose where the atom i was within the 4.0Å cutoff from the oxygen of the heme (usually ranging from about -12 (best) to -6 (worst)). Gamma (γ) is a weighting factor between 0 and 10, and is used to adjust the contribution of the docking score (Si) to the total combined score (CS). In order to be further considered in the CS scheme, an atom had to have both a docking score and a SMARTCyp score, otherwise the atom was omitted as a potential SoM.
Gamma was optimized using a subset of ligands (denoted in Supplementary Information Table SI) and the following fitness function:
Where %top1, %top2, and %top3, reflect the percentage of accurately predicted SoMs in the top-1, top-2 and top-3 positions, respectively. Gamma was initially set to 0 and was iteratively increased by 0.5 to a maximum of 100. The gamma value that maximized the fitness score for each data set (i.e. crystal or pseudo-apo ensemble) was selected.
For each ligand, atoms were ranked by CS value. As with the docking scores, atoms with equivalent CS values were ranked at the same position, but the next position reflected the inclusion of multiple atoms at the previous position. The percentage of correctly identified SoMs in the top-1, top-2 and top-3 ranked atoms was calculated for the x-ray crystal structure alone and the pseudo-apo ensemble.
SMARTCyp+ Docking+ QSAR
In an attempt to further improve SoM prediction results we implemented a modified QSAR scheme to evaluate and re-rank docking poses. The SMARTCyp score and strength of protein-ligand interactions were combined into the fitness functions used for deriving the QSAR model.
Dataset Preparation and Selection
As described previously, SMARTCyp assigns reactivity scores to all ligand atoms, with the lowest score representing the predicted SoM. When combining the SMARTCyp reactivity approach with docking, the SoM predictions can be re-ranked by including only those atoms within a reactive distance of the oxygen atom of the heme. The main limitation of this approach is the accuracy of the docking scoring function. Often poses are found in which the true SoM is within the cutoff distance (active poses), but these poses may be amongst the worst ranked by the scoring function. This problem intensifies as more poses are introduced using ensemble docking. To overcome the limitations of docking scoring functions, we developed a modified version of the RAPTOR QSAR package to generate a statistical model to differentiate poses that are consistent with the experimentally known SoM from those which are not.
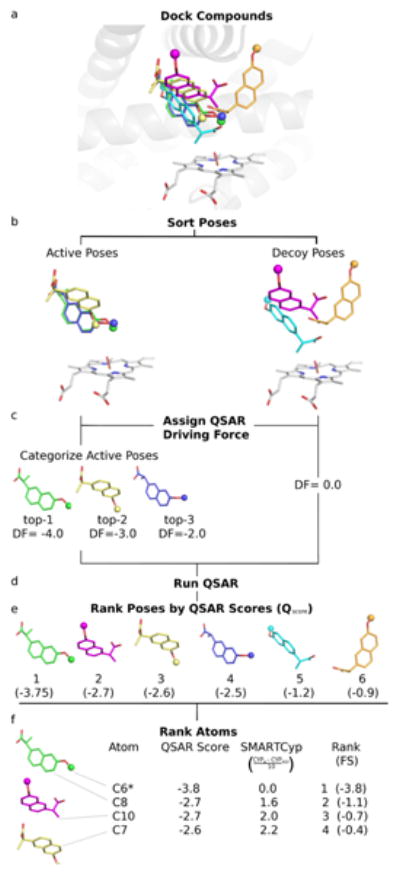
The clustered docking poses were used as input for the QSAR model (Figure 2a). The poses were first separated into active poses and decoy poses (Figure 2b). An active pose was defined as a pose in which the known SoM was docked within 4Å of the oxygen on the heme and had the known SoM within the top-3 ranked SMARTCyp scores for those atoms within 4Å of the heme oxygen atom. The active poses were further classified by whether the known SoM had the first, second, or third best SMARTCyp score (Figure 2c). A decoy pose was defined as any pose that was docked with at least one atom within 4Å of the heme oxygen atom but did not meet the criteria for an active pose.
Figure 2.
Test and Training Selection
A random set of nineteen ligands was selected as the initial test set for the QSAR simulations and the remaining ligands were assigned to the training set. The value of nineteen was chosen as this represented approximately one-quarter of the available ligands for QSAR modelling. The test set was then manually curated to ensure that it covered the chemical space of the training set. During this evaluation, four of the test ligands were moved to the training set, and an equal number of ligands were moved to the test set to retain the overall 3:1 training to test ratio. Two of the ligands that were moved into the training set had unique ring structures not found in any other ligand in the data set, a third ligand had a unique long carbon chain, and the final ligand was the smallest compound in the data set. These unique features cause the ligands to be unsuitable for the test set. This test set was then used for all remaining QSAR simulations. The final training and test sets are noted in the “Data Set” column of Supplementary Table SI.
As discussed earlier, active poses are further classified based on the rank of the SoM using the SMARTCyp score. Thus, for many ligands there are binding poses in which the SoM is ranked as most reactive atom (i.e. other more reactive atoms are not within 4Å of the catalytic center) and other poses where the SoM is ranked lower (e.g. as top-2 or top-3) because more reactive atoms also fall within 4Å of the reactive oxygen. In a strict sense, the later poses disagree with the experimental SoM data and would add noise to the QSAR training process. Thus, during QSAR model training only the active poses with the highest ranked SoM based on the SMARTCyp score were used as active poses. All other active poses, however, were moved into the final prediction set which contains all docked poses with any atom within 4Å of the catalytic oxygen. This prediction set was used for final evaluation of SoM prediction quality using our optimized QSAR model (Figure 1, last step).
Inclusion of SMARTCyp reaction scores
To directly incorporate the SMARTCyp scores into the QSAR model, the RAPTOR package was modified. The original version of RAPTOR uses hydrogen-bond interactions and hydrophobic contacts between the ligands and the pseudo-receptor generated by RAPTOR to predict binding affinities. In the modified version of RAPTOR, the SMARTCyp score was provided as an additional contribution to the overall predicted score. Thus, the QSAR score Qscore was computed by the sum of hydrogen-bond interactions ΔGHBond, hydrophobic contacts ΔGHPhob and SMARTCyp score SSMARTCyp:
SMARTCyp scores were assigned to every pose as 1/10th of the original value to scale the reactivity scores to the same order of magnitude as the other two contributions to the Qscore within the RAPTOR models. For active poses, the SMARTCyp score of the known SoM was used. For decoys, the lowest SMARTCyp score of any atom within 4.0Å of the oxygen atom of the heme was used.
Also, the input to the QSAR method was adjusted (Figure 2b). Typically, all poses for a given ligand are treated as alternative conformations of the same ligand and the experimental affinity value is used during the QSAR modeling process for every conformation. For our method, we grouped active and decoy poses separately. In addition, instead of binding affinities, the active poses were assigned a negative score, while the decoys were assigned a score of 0 or a positive value. We will refer to the difference between these scores as a “driving force.” The goal of this driving force is to identify the physicochemical features in the QSAR model that allows discrimination between active and decoy poses due to differences in protein-ligand interactions.
In order to determine the optimal driving force, we ran multiple RAPTOR simulations with different driving forces. We ran simulations with both a fixed driving force for all active poses, and simulations with a variable driving force for the actives. For the variable driving force simulations, the top-1 actives poses are assigned a value of X-Y, top-2 poses are scored as X, and top-3 poses are scored as X+Y where X and Y are real floating point values ranging from -5 to -2 and Y ranging from -1.5 to -0.5. Using variable weights for top-1, top-2 and top-3 poses improved the performance of the QSAR model compared to assigning identical weights to all actives. Many of the driving force weights generated QSAR models with similar quality. Therefore, we chose a set of weights in the middle of our testing range, i.e. an X value of -3 and a Y value of 1, with the decoy set being assigned a value of zero. This setting had the best performance by a slight margin.
QSAR Modeling
The modified RAPTOR program was used to generate a pseudo-receptor QSAR model for CYP2C9 with all remaining parameters set to their default values. Five individual models, run with the fast search mode, a coupling factor of 0.5 and sharpness penalty of 1 were constructed for each modeling run.
Analysis of QSAR Results
Typically, pseudo-receptor models are used to predict the binding affinity of a ligand. RAPTOR, in addition to providing an overall prediction of the affinity of the ligand, predicts the binding energy for each conformation of a ligand. In this study, those conformations are the individual docking poses for a ligand. However, here the predicted score does not provide an estimate of the binding affinity but yields a likelihood score for each conformation to be the pose predicted to have the known SoM within 4 Å of the catalytic center. To evaluate the success of our model, all binding poses of training and test set were combined with the predictive set of actives excluded from the modeling process. The trained QSAR model was used to assign QSAR scores to all poses which were then ranked by this score (Figure 2e). The atoms within 4Å of the catalytic center with the top-3 SMARTCyp scores for each pose were assigned modified QSAR scores using the following formula:
where FSA is the final score for atom A, Qscore is the QSAR score for the pose in which atom A is found, CYPA is the SMARTCyp score for atom A, and CYPREF is the SMARTCyp score for the atom used in the QSAR model building process . This formula adjusts the QSAR score for the difference in SMARTCyp scores between the top three SMARTCyp atoms (Figure 2f). The lowest score for any given atom among all poses was identified, and then the atoms themselves were sorted by score. The highest ranked known SoM was identified and the percentage of correctly predicted SoMs in the top-1, top-2, and top-3 positions were reported.
Results and Discussion
SMARTCyp Prediction
Several reactivity schemes have been developed to predict SoMs in CYP substrates based on the physicochemical properties of the ligand alone(16, 22). Such ligand-based methods are advantageous because they do not require protein structural information and are computationally efficient. SMARTCyp(22) is one example of a widely used reactivity based method. Potential SoMs are evaluated based on a combination of the accessibility of the atom within the structure and the estimated energy required to abstract a hydrogen from carbon atoms or for an oxygen attack in the case of nitrogen, phosphorus, and sulfur atoms(22). The resultant score is referred to as a SMARTCyp score and is used to rank potential SoMs. Recently, a new version of the SMARTCyp program, version 2.4.2, was released with parameters specific to CYP2C9 ligands(31).
We generated a 139-ligand data set comprised of all possible protonation states and relevant stereoisomers of 73 unique ligands and evaluated each using SMARTCyp version 2.4.2 (referred to as SMARTCyp). The atoms of each ligand were ranked according to the assigned SMARTCyp reactivity score and the number of correctly predicted SoMs in the top-1, top-2, and top-3 positions was calculated (Table II -SMARTCyp Alone column). SMARTCyp correctly predicted the known SoM at the top-1 position in 42% of the ligands tested. In the top-2 and top-3 positions, the prediction percentages increase to 58% and 67% respectively.
Table II.
Comparison of various methods for predicting SoMs in the top-1, top-2, and top-3 positions.
| X-ray structure aloneh | |||||
|---|---|---|---|---|---|
| Randoma | SMARTCyp Aloneb | Vina Alonec | Vina + SMARTCypd | Vina + SMARTCyp+ QSARe | |
| Top-1 | 12% | 44% | 21% | 38% | 49% |
| Top-2 | 24% | 59% | 27% | 53% | 56% |
| Top-3 | 38% | 68% | 37 % | 60% | 63% |
| % docked | 64% | Gamma 0.0g | |||
| Pseudo-apo Ensemblei | |||||
| Vina Alonef | Vina + SMARTCyp | Vina+SMARTCyp + QSAR | |||
| Top-1 | 44% [28 ±6.5% ] | 55% | 88% | ||
| Top-2 | 58% [37 ±5.7% ] | 77% | 96% | ||
| Top-3 | 67% [48± 7.0% ] | 88% | 96% | ||
| % docked | 96% [92±1.7% ] | Gamma 23.5 | |||
Percentage of correctly predicted SoMs if a heavy atom was chosen at random for each ligand.
Percentage of correctly predicted SoMs using SMARTCyp only.
Percentage of correctly predicted SoMs using Autodock Vina alone. A prediction was considered “correct” if the true SoM was within 4.0Å in the top-1, top-2 or top-3 ranked docking poses, respectively.
Percentage of correctly predicted SoMs using a combination score comprised of the Vina score and the SmartCyp score, see Methods section for full details.
Percentage of correctly predicted SoMs using the modified QSAR model that includes the poses provided by Vina docking and the reactivity scores from SMARTCyp.
Bracketed values represent the percentage of successfully docked compounds when the protein structures that comprised the ensembles were chosen at random. These values represent the average and standard deviation over three randomly selected protein sets.
Although a gamma (γ) of 0 is selected, the omission of some atoms due to failure to find both a successful docking pose and SMARTCyp score can result in slightly different rankings using the CS versus SMARTCyp. These differences were caused by the inability to find a successful docking pose, therefore an atom may be ranked in SMARTCyp but not the combination approach, which can result in slight changes in the overall rankings as observed in the crystal structure.
Binding poses were identified using docking with AutoDock Vina to the x-ray structure of CYP2C9 only.
Binding poses were identified using docking with AutoDock Vina to an ensemble of proteins structures generated by an MD simulations based on the pseudo-apo form of CYP2C9 (holo x-ray structure with co-crystallized ligand removed).
Static Docking
Docking is another approach used to predict potential SoMs in CYP ligands. Docking is one of the most widely used techniques in structure-based drug design and provides information about potential ligand binding modes. In the biologically active conformation within the CYP binding site, the ligand should be positioned in such a way that the SoM is in close proximity to the reactive oxygen atom of the heme moiety. In theory, if the docking pose is correctly predicted, atoms which are positioned near the oxygen atom of the heme are the most likely SoM candidates.
As a comparison to our new approach, we docked our ligand library into the crystal structure of CYP2C9 (PDB ID: 1R9O) using Autodock Vina (Vina). A docking pose was considered to be an accurate SoM prediction if the distance between the known SoM and the reactive oxygen of the heme moiety was 4Å or less. Docking poses were ranked by the internal Vina scoring function and the percentage of correctly predicted SoMs in the top-1, top-2, and top-3 ranked poses were calculated (Table II- Vina Alone column). In addition to assessing predictions in the top-3 ranked poses, we calculated the overall docking success by determining the percentage of ligands that achieved an active pose regardless of rank (Table II- Vina Alone column).
SMARTCyp outperformed docking in identifying the known SoM within the top-3 positions. However, the overall docking success was approximately equal to the prediction success of SMARTCyp in the top-3 positions (64% and 67% respectively). This highlights two possible shortcomings in the standard Vina docking approach. First, despite 67% overall accuracy in docking, less than half of these poses were ranked in the top-3 positions, suggesting that the Vina scoring function does not always rank potentially biologically active conformations in the top positions. Second, the failure to achieve 100% docking success suggests that the binding pocket of the crystal structure alone may not be able to accommodate the structural diversity of the ligands in the data set.
It is well known that CYP enzymes are highly flexible and that the binding sites of these enzymes often have to adapt to accommodate structurally different ligands(32). The plasticity of the CYP binding sites can make docking to these enzymes challenging and often ensemble approaches are employed to improve docking results(10, 33).
Ensemble Generation and Selection
Ensemble Diversity
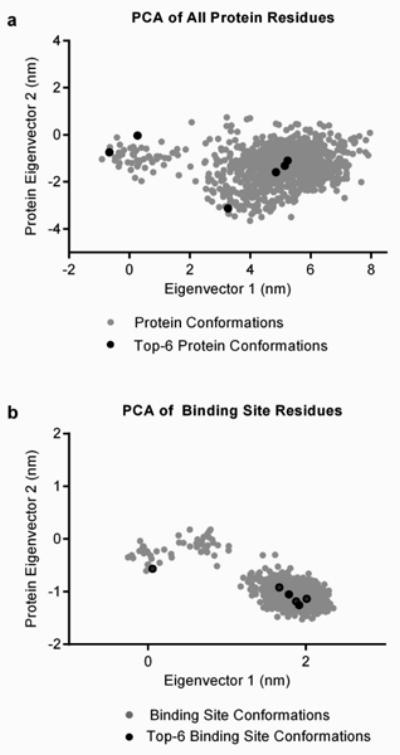
A pseudo-apo ensemble was generated by extracting 100 snapshots from a 10ns trajectory of CYP2C9 with the crystal ligand removed. A principle component analysis (PCA) suggests that through the duration of the simulation, both the overall protein structure and the binding site residues adopted several alternative conformations (Figures 3a and 3b). Ultimately, the increased diversity in the pseudo-apo ensemble allowed for improved docking of several ligands in comparison to the crystal structure.
Figure 3.
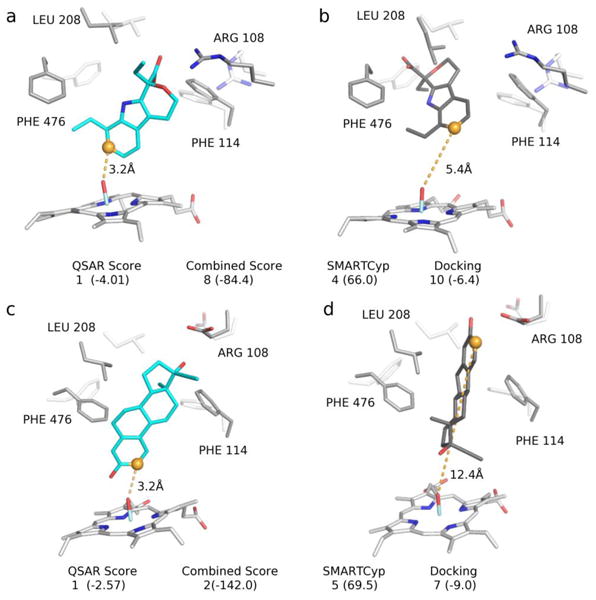
For instance, no active docking pose was found for 9-cis-retinoic acid in the crystal structure, however side-chain rotations that occurred during the pseudo-apo simulation allowed for successful docking of this ligand (Figure 4a). The orientation of LEU 208, PHE 476, and PHE 100 (PHE 100 was omitted from figure for clarity) are crucial to achieve a bioactive conformation of this ligand. In the crystal structure, the top-ranked bioactive pose of the ligand directly overlaps with LEU 208. Furthermore, the rotation of ASP 293 in the pseudo-apo simulation provides a potential hydrogen bonding site for the ligand.
Figure 4.
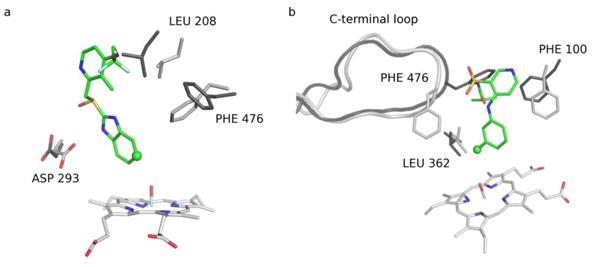
Additionally, the binding of torsemide required a significant rearrangement of residues in the active site (Figure 4b). A ∼3Å shift in the C-terminal loop is accompanied by the ∼180 degree rotation of PHE476 in the pseudo-apo simulation which allows for this ligand to be successfully docked. In the closest-to-active pose in the crystal structure docking the ligand is found to occupy a pocket created between the C-terminal loop and the G helix, resulting in a conformation where the SoM is 4.2Å from the reactive oxygen. In the pseudo-apo simulation, shifting of the C-terminal loop causes a closure of this pocket and causes the ligand to bind on the opposite side of the C-terminal loop where the SoM is within 3.7A of the reactive oxygen and at a more favorable angle to the reactive oxygen.
Final Ensemble Selection
While, the inclusion of a variety of binding site conformations may be essential for docking of large and diverse ligand libraries such as the one tested here, an ensemble of several hundred members is both cumbersome and redundant; therefore the pseudo-apo ensemble was further refined.
A docking filter was used to select the most relevant conformations from the initial ensembles. Using a subset of 14 ligands and the fitness function described in the Methods section, the top-6 structures from the pseudo-apo ensemble were selected as the final ensemble members. The fitness scores, RMSD to the crystal structure, as well as the binding site volume are shown for each member of the ensemble in Table I.
Table I. Calculated fitness score, overall RMSD to 1R9O crystal structure and binding site volume of selected ensemble members. The volume of the binding site over the course of the trajectory calculated using POVME(34) (description in Supplementary Information).
| Structure | Fitness Score | RMSD to Crystal | Binding Site Volume |
|---|---|---|---|
| PA 97 | 2.66 | 1.18 | 361 |
| PA 19 | 2.58 | 1.19 | 393 |
| PA 66 | 2.58 | 1.02 | 422 |
| PA 1 | 2.55 | 1.12 | 836 |
| PA 25 | 2.53 | 1.18 | 363 |
| PA 91 | 2.51 | 1.08 | 411 |
The 14-ligand training set was initially docked to all protein structures (Figure S1). Although some individual members of the ensemble perform worse than the crystal structure alone, taken together, ensemble docking shows significant improvement over docking to the crystal structure alone. The crystal structure successfully docked only half of the 14-ligand test set whereas the pseudo-apo ensemble docked successfully 13 out of 14 compounds into the top-5 protein structures alone (Figure 5). The remaining ligand, 2-oxoquazepam was successfully docked to the 34th ranked structure.
Figure 5.
The selected ensemble members were found to be structurally diverse and to cover a significant portion of the conformational space sampled by the MD simulation according to the PCA (Figure 3). Compared to randomly selected ensembles of the same size, the filtered ensemble provides considerable improvement in the docking results in the top-3 positions and slight improvement in the overall prediction success (Table II). The improvement over random selection indicates that the pre-filtering procedure aids in the isolation of protein conformations relevant for docking.
Ensemble Docking
Following the selection of the 6-member pseudo-apo ensemble, we used Vina to dock all 73 compounds in the data set to each member of the ensemble. Compared to the crystal structure alone, the ensemble offered significant improvement in the top-1, top-2 and top-3 positions and in the overall docking success (Table II).
The more diverse binding pockets of the mixed ensemble are likely responsible for the significant improvement in the overall docking success. The increase in accurate predictions in the top-1, top-2 and top-3 positions, while significant, does not match the improvement in overall docking success. The increased binding pocket diversity in the ensemble is likely the reason that more compounds can be successfully docked, however, this diversity can also result in a higher number of alternative ligand poses, making the identification of true positive poses more challenging for the docking scoring function. This is one possible reason that the individual increase in the top-1, top-2, and top-3 positions is not as drastic as in the overall docking performance.
Combining Docking and SMARTCyp
We hypothesized that SoM predictions could be further improved by combining the structural data from docking and the ligand-based reactivity predictions from SMARTCyp. For instance, let us assume that SMARTCyp incorrectly predicts a given atom as the true SoM; although the incorrectly predicted atom may be a highly reactive, it may not be a structurally feasible SoM based on its binding conformation. For example, it may be part of a bulky group that cannot easily fit close to the reactive oxygen of the heme. By including contributions from both docking and SMARTCyp, such atoms could be re-ranked or even eliminated as possible SoMs, resulting in improved predictions.
The optimized gamma value can offer insight about the individual contributions of docking scoring and SMARTCyp to the overall ranking of the SoM; a low gamma suggests that SMARTCyp dominates the calculated CS and docking only provides a minor contribution, a gamma of around 10 would suggest approximately equal contributions of both docking and SMARTCyp, and a large gamma would suggest that docking dominates the CS function.
In the crystal structure, the optimized gamma value of 0.0 suggests that the results are entirely dominated by the SMARTCyp rankings of the compounds. On the other hand, the gamma score for the pseudo-apo ensemble is 23.5, suggesting that docking scores are a major contribution to the overall CS ranking. There are several reasons for this discrepancy in gamma scores. Most notably, in the pseudo-ensemble the rankings of SMARTCyp and docking are approximately equal in the top-3 positions (∼65%). This suggests that both docking and SMARTCyp have approximately equal ability to contribute to the final ranking. However, almost all compounds can be successfully docked to the ensemble, indicating that docking has the potential to further improve SoM prediction above the ∼65% observed with either approach individually. This is in contrast to the crystal structure where docking has a significantly lower percentage of compounds ranked in the top-3 (∼45%) and also a lower overall docking success (∼65%), thus a less significant potential to contribute to the overall CS ranking.
In Figure 6, we provide some specific examples of how CS ranking in the pseudo-apo ensemble improved SoM prediction in various compounds. In some compounds, such as galangin, the contribution of the docking score was essential for the top-1 CS ranking of the compounds (Figure 6a), whereas in others, like terbinafine, it was the SMARTCyp (Figure 6b) score that was the determining factor. SMARTCyp and docking did not rank the same ligands in the top-3 positions as was seen with galangin and terbinafine. These differences allowed for approximately 10% improvement in the CS ranking. However, the most intriguing cases were those in which different rankings of individual atoms by SMARTCyp and docking led to a synergistic ranking effect. In these cases, the CS ranking of the true SoM was higher than in either approach individually. Suprofen, for example shows this trend (Figure 6c). Suprofen and other ligands where there was a synergistic effect accounted for the remaining ∼10% improvement in the CS ranking is as compared to either method alone.
Figure 6.
Although using a combination approach in the pseudo-apo ensemble improved performance over either SMARTCYP alone or docking alone, and all approaches tested on the crystal structure alone, we hypothesized that using Quantitative Structure-Activity Relationship (QSAR) modeling could improve the separation between active and inactive docking poses and further improve SoM prediction in the top-1, top-2, and top-3 positions.
Ranking OS data using QSAR
QSAR is a computational method that derives statistical relationships between sets of descriptors, typically ligand properties, and a set of values, typically the biological activities of the target ligands. We hypothesized that there were certain key ligand features, along with the spatial orientation of those features, which could distinguish between active and decoy docking poses, and that QSAR statistical modeling could be used to identify those features. By assigning a favorable score to active poses as compared to decoy poses, we aimed to train a model to preferentially select active ligand poses.
However, in addition to protein-ligand interactions, for CYP metabolism the reactivity of a chemical group is an additional critical factor to determine the potential SoM of a ligand. As pseudo-receptor QSAR programs, such as RAPTOR, do not directly incorporate this factor, we modified RAPTOR to include SMARTCyp scores as a descriptor in the modeling process. Using this modified QSAR approach, we were able to significantly improve SoM predictions (Table II-Vina+SMARTCyp+QSAR column).
Compared to SMARTCyp alone, docking alone, or the combined approach using SMARTCyp and docking (CS), re-ranking atoms using QSAR proved to be far superior. For example, the QSAR model based on the docking results from the pseudo-apo ensemble was able to predict the correct SoM in 88% and 96% within the top-1and top-2 positions, respectively.
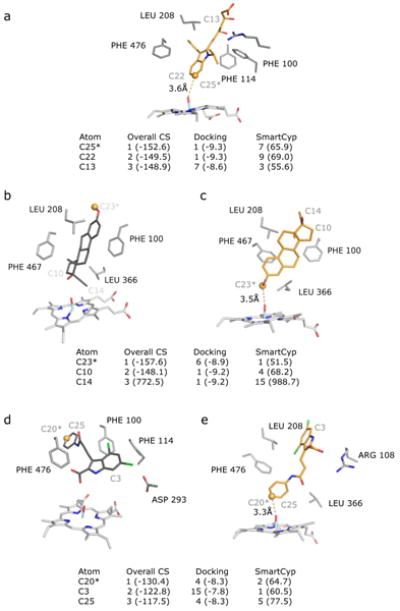
For several compounds the QSAR approach drastically improved the ranking of the true SoM in comparison to the other methods tested (Figure 7). For instance, for etodolac (Figure 7a and 7b) none of the other methods tested accurately predicted the true SoM, C13, within the top-3 positions. However, using QSAR, the top ranked pose placed the true SoM within 4.0Å of the reactive oxygen. Notably, this pose was very poorly ranked using docking (10th overall). In other compounds, such as 17 alpha-ethinylestradiol (Figure 7c and 7d), the QSAR score offered incremental improvements within the top-3 ranked positions. In this compound, both docking and SMARTCyp were unable to rank the true-SoM within the top-3 positions. While the CS method improved the ranking to the top-2 position, QSAR ranked the true SoM at the top-1 position.
Figure 7.
One remaining limitation for the success of the QSAR model was the overall docking success. In other words, assuming that an active pose was sampled during the docking process, the QSAR model was nearly always able to identify the true SoM within the top-3 positions. In the crystal structure for instance, the QSAR model accurately predicted the SoM within the top-3 positions for all but one of the compounds for which an active docking pose was obtained. For the pseudo-apo ensemble, all compounds with an active docking pose were predicted within the top-2 ranked SoM.
Table III represents the QSAR results in isolation, i.e. only ligands for which active docking poses were found are considered. In this situation, 91%, 100% and 100% of the known SoMs are correctly predicted when the pseudo-apo ensemble was used for docking within the top-1, top-2 and top-3, respectively. These percentages are slightly lower when the crystal structure was used for docking, i.e., 77%, 87%, and 98%, for the top-1, top-2, and top-3 positions, respectively.
Table III.
QSAR SoM rankings of ligands with an active docking pose.
| Fraction of Ligands with Rank | Total Number of Active Ligands | |||
|---|---|---|---|---|
| QSAR Model | Top 1 | Top 2 | Top 3 | |
| X-ray | 0.77 | 0.87 | 0.98 | 47 |
| Pseudo-apo Ensemble | 0.91 | 1.00 | 1.00 | 70 |
While the QSAR model using the results from docking to the crystal structure was severely limited by the quality of the docking process, the pseudo-apo docking set was able to generate active poses for most ligands, allowing the subsequent QSAR model to predict the known SoM in the top-2 positions in 96% of all cases.
Over-fitting can be a concern in QSAR modelling, so the results for the test and training set of the QSAR models were compared (Table IV). Similar to Table III, only those ligands for which an active docking pose was found are included in the comparisons. For the x-ray structure, there were little differences between the two sets; the training and test set had approximately the same fractions in the top-1, top-2, and top-3 positions. For the pseudo-apo ensemble, the prediction accuracy of the test set exceeded that of the training set, where the SoM of all test set ligands was correctly predicted in the top-1 position. This indicates that the chemical space of the test set was well-covered by the training set, and that the model has high predictive power for future compounds within the space modeled.
Table IV.
Comparison of QSAR results for test and training sets.
| Fraction of Training Set Ligands with Rank | Total Number of Active Ligands | |||
|---|---|---|---|---|
| QSAR Model | Top 1 | Top 2 | Top 3 | |
| X-ray, training | 0.76 | 0.88 | 1.00 | 33 |
| X-ray, test | 0.79 | 0.86 | 0.93 | 14 |
| Pseudo-apo, training | 0.88 | 1.00 | 1.00 | 51 |
| Pseudo-apo, test | 1.00 | 1.00 | 1.00 | 19 |
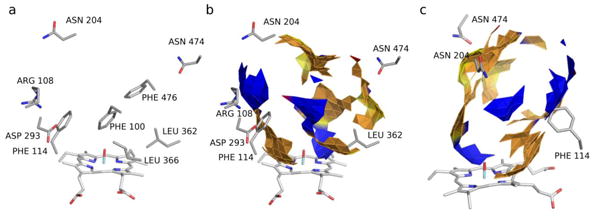
Additionally, as the RAPTOR QSAR package generates a pseudo-receptor model of the protein binding pocket around the ensemble of ligand poses, we visually compared the QSAR model with the members of the pseudo-apo structural ensemble, a representative example is shown in Figure 8. As shown, there is significant agreement between the protein structure and the RAPTOR model. Where the model predicts hydrophobic properties, the protein residues are mainly hydrophobic, such as LEU 366 and 361, and PHE 100, 114, and 476. Hydrophilic residues such as ARG 108, ASN 204, and ASP 293 are collocated with hydrophilic features of the RAPTOR pseudo-receptor. PHE 100 and 114 both appear to be able to engage in different types of interactions, as they are co-located with both hydrophobic and hydrophilic features, indicating that π stacking interactions might play an important role in the binding pocket.
Figure 8.
Conclusion
In this study, we compared the ability of ligand-based, structure-based, and combination-based approaches to predict the SoM in 73 diverse CYP2C9 substrates. Of all individual methods tested, docking was found to have the poorest performance. Whereas ensemble docking showed a significant improvement over docking to the crystal structure alone, at most 38% of the compounds were ranked in the top-1 position using docking. Using the SMARTCyp reactivity model alone, 42% of the compounds were accurately prediction in the top-1 position. By combining the docking scores and SMARTCyp scores prediction accuracy was improved in both ensembles, but not in the crystal structure. Ultimately, we found that the inclusion of QSAR into the combination approach resulted in significant improvement in prediction success and was the most effective and accurate SoM prediction method tested in this work.
In all systems tested, the QSAR model was able to accurately predict, within the top-3 positions, the SoM for nearly all ligands with an active pose. A key limitation to the success observed with QSAR was the ability of docking to provide active poses, in other words, poses in which the true SoM was within a reactive distance to the oxygen of the heme. Using a pseudo-apo ensemble, we were able to find an active docking pose for nearly all ligands tested. To set our results in perspective, a recent study of currently published methods found that accurate predictions in the top-2 positions range between 68-87%, on average, across various CYP isoforms(35). In the same study, the highest prediction rate achieved for CYP2C9 was 87% in the top-2(35). Using our approach we achieved an accurate prediction rate of 96% in the top-2 positions, albeit using a different, dataset. With a performance of over 95% correct positions in the top-2 positions, we feel that we are approaching the limits of this method and that any further improvement may require the inclusion of computationally expensive approaches such as QM/MM calculations.
Our promising results in CYP2C9 represent a step towards improved and highly accurate SoM predictions in CYP enzymes. While in the current study we tested substrates of CYP2C9, we believe that the proposed method will be of use in broader ligand datasets and also will be applicable to different CYP isozymes.
Supplementary Material
Abbreviations
- CYP
cytochrome P450
- SoM(s)
site(s) of metabolism
- QSAR
quantitative structure-activity relationship
- MD
molecular dynamics
- Vina
AutoDock Vina
- PA
pseudo-apo structure/ensemble
- CS
combined score
References
- 1.Guengerich FP. Cytochrome p450 enzymes in the generation of commercial products. Nat Rev Drug Discov. 2002;1(5):359–66. doi: 10.1038/nrd792. [DOI] [PubMed] [Google Scholar]
- 2.Wienkers LC, Heath TG. Predicting in vivo drug interactions from in vitro drug discovery data. Nat Rev Drug Discov. 2005;4(10):825–33. doi: 10.1038/nrd1851. [DOI] [PubMed] [Google Scholar]
- 3.Emoto C, Murase S, Iwasaki K. Approach to the prediction of the contribution of major cytochrome P450 enzymes to drug metabolism in the early drug-discovery stage. Xenobiotica. 2006;36(8):671–83. doi: 10.1080/00498250600709778. [DOI] [PubMed] [Google Scholar]
- 4.Thompson RA, Isin EM, Li Y, Weaver R, Weidolf L, Wilson I, et al. Risk assessment and mitigation strategies for reactive metabolites in drug discovery and development. Chem Biol Interact. 2011;192(1–2):65–71. doi: 10.1016/j.cbi.2010.11.002. [DOI] [PubMed] [Google Scholar]
- 5.Trunzer M, Faller B, Zimmerlin A. Metabolic Soft Spot Identification and Compound Optimization in Early Discovery Phases Using MetaSite and LC-MS/MS Validation. J Med Chem. 2009 Jan 22;52(2):329–35. doi: 10.1021/jm8008663. 2008. [DOI] [PubMed] [Google Scholar]
- 6.Kirkpatrick P. Drug metabolism: Seeking the soft spots. Nat Rev Drug Discov. 2009;8(3):196. [Google Scholar]
- 7.Crivori P, Poggesi I. Computational approaches for predicting CYP-related metabolism properties in the screening of new drugs. Eur J Med Chem. 2006;41(7):795–808. doi: 10.1016/j.ejmech.2006.03.003. [DOI] [PubMed] [Google Scholar]
- 8.Kirchmair J, Williamson MJ, Tyzack JD, Tan L, Bond PJ, Bender A, et al. Computational Prediction of Metabolism: Sites, Products, SAR, P450 Enzyme Dynamics, and Mechanisms. J Chem Inf Model. 2012 Mar 26;52(3):617–48. doi: 10.1021/ci200542m. 2012. [DOI] [PMC free article] [PubMed] [Google Scholar]
- 9.Cruciani G, Carosati E, De Boeck B, Ethirajulu K, Mackie C, Howe T, et al. MetaSite: Understanding Metabolism in Human Cytochromes from the Perspective of the Chemist. J Med Chem. 2005 Nov 01;48(22):6970–9. doi: 10.1021/jm050529c. 2005. [DOI] [PubMed] [Google Scholar]
- 10.Hritz J, de Ruiter A, Oostenbrink C. Impact of Plasticity and Flexibility on Docking Results for Cytochrome P450 2D6: A Combined Approach of Molecular Dynamics and Ligand Docking. J Med Chem. 2008 Dec 11;51(23):7469–77. doi: 10.1021/jm801005m. 2008. [DOI] [PubMed] [Google Scholar]
- 11.Locuson CW, Wahlstrom JL. Three-Dimensional Quantitative Structure-Activity Relationship Analysis Of Cytochromes P450: Effect Of Incorporating Higher-Affinity Ligands And Potential New Applications. Drug Metabolism and Disposition. 2005 Jul 1;33(7):873–8. doi: 10.1124/dmd.105.004325. 2005. [DOI] [PubMed] [Google Scholar]
- 12.Locuson CW, Wahlstrom JL, Rock DA, Rock DA, Jones JP. A New Class Of Cyp2c9 Inhibitors: Probing 2c9 Specificity With High-Affinity Benzbromarone Derivatives. Drug Metabolism and Disposition. 2003 Jul 1;31(7):967–71. doi: 10.1124/dmd.31.7.967. 2003. [DOI] [PubMed] [Google Scholar]
- 13.Moors SLC, Vos AM, Cummings MD, Van Vlijmen H, Ceulemans A. Structure-Based Site of Metabolism Prediction for Cytochrome P450 2D6. Journal of Medicinal Chemistry. 2011 Sep 08;54(17):6098–105. doi: 10.1021/jm2006468. 2011. [DOI] [PubMed] [Google Scholar]
- 14.Huang Tw, Zaretzki J, Bergeron C, Bennett KP, Breneman CM. DR-Predictor: Incorporating Flexible Docking with Specialized Electronic Reactivity and Machine Learning Techniques to Predict CYP-Mediated Sites of Metabolism. J Chem Inf Model. 2013 Dec 23;53(12):3352–66. doi: 10.1021/ci4004688. 2013. [DOI] [PubMed] [Google Scholar]
- 15.Vickers AEM, Sinclair JR, Zollinger M, Heitz F, Glänzel U, Johanson L, et al. Multiple Cytochrome P-450s Involved in the Metabolism of Terbinafine Suggest a Limited Potential for Drug-Drug Interactions. Drug Metab Dispos. 1999 Sep 1;27(9):1029–38. 1999. [PubMed] [Google Scholar]
- 16.Zaretzki J, Bergeron C, Rydberg P, Huang Tw, Bennett KP, Breneman CM, et al. RS-Predictor: A New Tool for Predicting Sites of Cytochrome P450-Mediated Metabolism Applied to CYP 3A4. J Chem Inf Model. 2011 Jul 25;51(7):1667–89. doi: 10.1021/ci2000488. 2011. [DOI] [PMC free article] [PubMed] [Google Scholar]
- 17.Tyzack JD, Williamson MJ, Torella R, Glen RC. Prediction of Cytochrome P450 Xenobiotic Metabolism: Tethered Docking and Reactivity Derived from Ligand Molecular Orbital Analysis. Journal of Chemical Information and Modeling. 2013 Jun 24;53(6):1294–305. doi: 10.1021/ci400058s. 2013. [DOI] [PubMed] [Google Scholar]
- 18.Campagna-Slater V, Pottel J, Therrien E, Cantin LD, Moitessier N. Development of a Computational Tool to Rival Experts in the Prediction of Sites of Metabolism of Xenobiotics by P450s. Journal of Chemical Information and Modeling. 2012 Sep 24;52(9):2471–83. doi: 10.1021/ci3003073. 2012. [DOI] [PubMed] [Google Scholar]
- 19.Li J, Schneebeli ST, Bylund J, Farid R, Friesner RA. IDSite: An Accurate Approach to Predict P450-Mediated Drug Metabolism. Journal of Chemical Theory and Computation. Journal of Chemical Theory and Computation. 2011 Nov 08;7(11):3829–45. doi: 10.1021/ct200462q. 2011. [DOI] [PMC free article] [PubMed] [Google Scholar]
- 20.Danielson ML, Desai PV, Mohutsky MA, Wrighton SA, Lill MA. Potentially increasing the metabolic stability of drug candidates via computational site of metabolism prediction by CYP2C9: The utility of incorporating protein flexibility via an ensemble of structures. Eur J Med Chem. 2011;46(9):3953–63. doi: 10.1016/j.ejmech.2011.05.067. [DOI] [PMC free article] [PubMed] [Google Scholar]
- 21.Rydberg P, Vasanthanathan P, Oostenbrink C, Olsen L. Fast Prediction of Cytochrome P450 Mediated Drug Metabolism. ChemMedChem. 2009;4(12):2070–9. doi: 10.1002/cmdc.200900363. [DOI] [PubMed] [Google Scholar]
- 22.Rydberg P, Gloriam DE, Zaretzki J, Breneman C, Olsen L. SMARTCyp: A 2D Method for Prediction of Cytochrome P450-Mediated Drug Metabolism. ACS Med Chem Lett. 2010 Jun 10;1(3):96–100. doi: 10.1021/ml100016x. 2010. [DOI] [PMC free article] [PubMed] [Google Scholar]
- 23.Lill MA, Vedani A, Dobler M. Raptor: Combining Dual-Shell Representation, Induced-Fit Simulation, and Hydrophobicity Scoring in Receptor Modeling: Application toward the Simulation of Structurally Diverse Ligand Sets. J Med Chem. 2004 Dec 01;47(25):6174–86. doi: 10.1021/jm049687e. 2004. [DOI] [PubMed] [Google Scholar]
- 24.Sykes MJ, McKinnon RA, Miners JO. Prediction of Metabolism by Cytochrome P450 2C9: Alignment and Docking Studies of a Validated Database of Substrates. J Med Chem. 2008 Feb 01;51(4):780–91. doi: 10.1021/jm7009793. 2008. [DOI] [PubMed] [Google Scholar]
- 25.Word JM, Lovell SC, Richardson JS, Richardson DC. Asparagine and glutamine: using hydrogen atom contacts in the choice of side-chain amide orientation. J Mol Biol. 1999;285(4):1735–47. doi: 10.1006/jmbi.1998.2401. [DOI] [PubMed] [Google Scholar]
- 26.Lill M, Danielson M. Computer-aided drug design platform using PyMOL. J Comput Aided Mol Des. 2011 Jan 01;25(1):13–9. doi: 10.1007/s10822-010-9395-8. 2011. [DOI] [PubMed] [Google Scholar]
- 27.Hess B, Kutzner C, van der Spoel D, Lindahl E. GROMACS 4: Algorithms for Highly Efficient, Load-Balanced, and Scalable Molecular Simulation. J Chem Theory Comput. 2008 Mar 01;4(3):435–47. doi: 10.1021/ct700301q. 2008. [DOI] [PubMed] [Google Scholar]
- 28.Van Der Spoel D, Lindahl E, Hess B, Groenhof G, Mark AE, Berendsen HJC. GROMACS: Fast, flexible, and free. J Comput Chem. 2005;26(16):1701–18. doi: 10.1002/jcc.20291. [DOI] [PubMed] [Google Scholar]
- 29.Oda A, Yamaotsu N, Hirono S. New AMBER force field parameters of heme iron for cytochrome P450s determined by quantum chemical calculations of simplified models. J Comp Chem. 2005;26(8):818–26. doi: 10.1002/jcc.20221. [DOI] [PubMed] [Google Scholar]
- 30.Hess B, Bekker H, Berendsen HJC, Fraaije JGEM. LINCS: A linear constraint solver for molecular simulations. J Comput Chem. 1997;18(12):1463–72. [Google Scholar]
- 31.Rydberg P, Olsen L. Predicting Drug Metabolism by Cytochrome P450 2C9: Comparison with the 2D6 and 3A4 Isoforms. ChemMedChem. 2012;7(7):1202–9. doi: 10.1002/cmdc.201200160. [DOI] [PubMed] [Google Scholar]
- 32.Ekroos M, Sjögren T. Structural basis for ligand promiscuity in cytochrome P450 3A4. Proc Natl Acad Sci USA. 2006 Sep 12;103(37):13682–7. doi: 10.1073/pnas.0603236103. 2006. [DOI] [PMC free article] [PubMed] [Google Scholar]
- 33.Teague SJ. Implications of protein flexibility for drug discovery. Nat Rev Drug Discov. 2003;2(7):527–41. doi: 10.1038/nrd1129. [DOI] [PubMed] [Google Scholar]
- 34.Durrant JD, de Oliveira CAF, McCammon JA. POVME: An algorithm for measuring binding-pocket volumes. J Mol Graphics Modell. 2011;29(5):773–6. doi: 10.1016/j.jmgm.2010.10.007. [DOI] [PMC free article] [PubMed] [Google Scholar]
- 35.Zaretzki J, Matlock M, Swamidass SJ. XenoSite: Accurately Predicting CYP-Mediated Sites of Metabolism with Neural Networks. J Chem Inf Model. 2013 Dec 23;53(12):3373–83. doi: 10.1021/ci400518g. 2013. [DOI] [PubMed] [Google Scholar]
Associated Data
This section collects any data citations, data availability statements, or supplementary materials included in this article.