

Abstract
In this Protocol, we describe a procedure to generate ‘DNA-dumbbells’ — single molecules of DNA with a microscopic bead attached at each end — and techniques for manipulating individual DNA-dumbbells. We also detail the design and fabrication of a microfluidic device (flow cell) used in conjunction with dual optical trapping to manipulate DNA-dumbbells and to visualize individual protein–DNA complexes by single-molecule epifluorescence microscopy. Our design of the flow cell enables the rapid movement of trapped molecules between laminar flow channels and a flow-free ‘reservoir’. The reservoir provides the means to examine formation of DNA–protein complexes in solution in the absence of external flow forces, while still maintaining a predetermined end-to-end extension of the DNA. These features facilitate examination of the role of three-dimensional DNA conformation and dynamics in protein–DNA interactions. Preparation of flow cells and reagents requires two days each; in situ DNA-dumbbell assembly and imaging of single protein–DNA complexes requires another day.
Keywords: Flow cell, microfluidic device, protein-DNA interactions, RecA, Rad51, optical trapping, fluorescence microscopy, single-molecule, DNA-dumbbell, worm-like coil, DNA conformation, 3-dimensional search, target sequence search
INTRODUCTION
Single-molecule microscopy has been instrumental in revealing the behavior of individual nucleic acids and proteins. Since the initial trapping and observation of a single DNA molecule nearly twenty years ago,1,2 instruments have been extensively customized and adapted to visualize the dynamics of individual molecular assemblies. Direct imaging of these assemblies has required the use of high-sensitivity fluorescence microscopy.3 In all cases, either the nucleic acid or the protein is immobilized to confine its motion, thus enabling detection of a fluorescently labeled target molecule. Information about the target molecule and/or molecular assembly can be gleaned from the intensity of the fluorescence or from its spatial localization. Molecules can be tethered to the surface of a flow cell, to a microscopic bead (plastic, glass, or magnetic), or both. The tethering of nucleic acids to microscopic beads and the manipulation of the tethered molecule with optical tweezers is a particularly versatile approach that can enable direct visualization of both protein binding to DNA and actions of enzymes.4–8
Because unconstrained DNA has a worm-like coil structure,9 imaging of DNA or of proteins bound to the DNA generally requires the DNA to be extended to nearly its contour length in the focal plane, although it has recently been established that a single-fluorophore on dsDNA can be tracked with ~10 nm accuracy by applying at least 1 pN of force to suppress Brownian fluctuations of the DNA.10 The first imaging of DNA used the force produced by solution flow to extend the DNA.1,2 With a DNA molecule attached to a microsphere and captured in an optical trap, the force generated by solution flow is sufficient to extend DNA and to maintain it in the plane of focus for observation (Figure 1a). Two optical traps can also be utilized to capture beads tethered to opposite ends of the DNA molecule to form a ‘DNA-dumbbell’, and to maintain the DNA in an extended conformation in the absence of solution flow (Figure 1b). An alternative to optical trapping is to tether DNA, possessing a modification at one end, to the surface of a flow cell. In this case, the forces from continuous buffer flow can be used to maintain a singly tethered DNA molecule in an extended conformation for observation by total internal reflection fluorescence (TIRF) microscopy (Figure 1c). Alternatively, a DNA molecule with modifications at both ends can be captured in an extended conformation by using buffer flow during the attachment process. In this case, a DNA end randomly attaches to the surface of the flow cell, the DNA extends by flow, and then the other end attaches to the surface; in this way, the attached DNA remains extended even after buffer flow is stopped (Figure 1d).
Figure 1. Examples of techniques used to tether and extend DNA for single-molecule imagining.

DNA can be attached either to micron-sized beads (shown in gray) or to glass surfaces (light blue) by either biotin-streptavidin interactions or digoxigenin-antidigoxigenin antibody interactions (dark blue). (a) A single IR laser beam is focused through the objective to form an optical trap (red) to capture a bead with a single DNA molecule attached. The DNA is extended in the focal plane by the forces generated by continuous buffer flow (arrow). (b) Two IR laser beams can be focused through the objective to form a dual optical trap configuration that captures a single DNA molecule attached to a bead at each end. The optical traps can be used to maintain the DNA in an extended conformation in the absence of flow. (c) A single end of DNA is tethered to the interior surface of a flow cell and the DNA is extended by the forces generated by buffer flow. Typically TIRF microscopy is utilized to observe DNA attached to the surface of the flow cell. (d) A DNA molecule with modifications at each end can be doubly attached in an extended conformation by flow forces, and remain extended even in the absence of flow. (e) With dual optical trapping, the end-to-end distance of the DNA can be experimentally controlled, allowing variation in 3D conformations of the DNA target.
Development of the protocol
We attempted to utilize DNA extension–based approaches to investigate how the RecA protein carries out the sequence-specific search for DNA homology between an ssDNA molecule on which it is assembled, and a dsDNA target molecule.11 Unexpectedly, we discovered that when the dsDNA was extended to near-contour length, we did not observe any interaction between the RecA–ssDNA complex and its dsDNA target. This lack of interaction was observed in both optical trapping experiments using flow-extension of DNA and in methods using DNA surface tethering. Surprisingly, we discovered that for the homology search and DNA pairing by RecA to be productive, the target DNA needed to be in a coiled state. To investigate the effect of 3D conformation of the target DNA on the search process, a method was thus needed to accurately manipulate the end-to-end distance of the DNA. Most importantly, we needed a strategy in which the reactions could take place in the absence of flow to allow the molecular components to assume conformations unaffected by the forces associated with buffer flow. We, therefore, designed a protocol that enabled us to assemble DNA-dumbbells in situ and to employ accurate control of their end-to-end distance. Importantly, this protocol also gave us the opportunity to conduct biological reactions in a chamber that was devoid of flow.
We designed an approach wherein a DNA-dumbbell is readily assembled in situ within a flow cell and the end-to-end distance of the DNA is accurately controlled via two optical traps. In this approach, reactions can take place in the absence of buffer flow, permitting interactions between proteins and DNA that are unaffected by the forces associated with fluid flow.
The strategy we developed makes use of a fluorescence microscope configured with a dual optical trap and the unique custom-fabricated flow cell shown in Figure 2. The flow cell consists of four input channels that converge into a single common channel (Figure 2a). A novel design element of this flow cell is the separate chamber called a ‘reservoir’ that is connected to the common channel by a small passage. The reservoir has its own independent inlet for the manual introduction of reaction components. Importantly, the reservoir is a flow-free region that is unaffected by the buffer flowing in the other four channels (Figure 2c). Buffers are continuously pumped into the four channels with a single syringe pump.
Figure 2. Custom fabricated flow cell that contains channels for laminar buffer flow and a flow-free reservoir.

(a) Flow cell pattern showing the four input channels (1–4) that converge into a common channel. A reservoir that has its own independent inlet is connected to the common flow channel by a small (100 μm wide) passage; scale bar = 10 mm (b) Photograph of the top of the assembled flow cell. (c) Photograph of the bottom of a flow cell showing SM buffer, dyed either with red or with green food coloring, pumped through channels 1–4. The inset shows a magnified view of the common channel and reservoir. Even though no physical boundary exists, there is no mixing between fluids flowing from the four input channels after their convergence into the single common channel. Diffusion of the solution components from channel 4 into the reaction reservoir is limited to the narrow connecting passage.
Because the flow is laminar, there is no mixing of the liquids in each of the four channels; separation of reagents is therefore maintained after the convergence of the individual channels into the common channel due to the very low Reynolds number of the solution under flow12,13 (Figure 2c) The Reynolds number is used in fluid mechanics to characterize whether the flow of fluid (or gas) is laminar or turbulent.
A key element of our strategy is the flow cell design, which incorporates the desirable properties of a multi-channel laminar flow cell, but which also has a flow-free chamber where reactions take place in an environment devoid of flow forces. The laminar flow channels allow for the rapid movement of optically trapped molecules between solutions containing different components. Specifically, in this protocol we detail the use of the independent flow channels to assemble in situ, in a stepwise fashion, a DNA-dumbbell comprising a single phage λ DNA molecule with a 1 μm polystyrene bead at each end, attached via biotin-streptavidin interactions (Figure 1b). After the DNA-dumbbell is assembled, the three-dimensional (3D) conformation, which is defined by the end-to-end distance of the trapped molecule, can be adjusted by moving the position of one of the optical traps (Figure 1e). Once the desired distance is set, the DNA-dumbbell can be quickly moved into the flow-free reservoir that contains desired reaction components. After a defined incubation time in the reservoir, the DNA-dumbbell is moved back into the common channel and is extended to near contour length for observation and analysis. When an interaction occurs, a fluorescent complex is detected at the target site on the DNA-dumbbell (Figure 3). Therefore, using our Protocol, biochemical reactions between proteins and single DNA molecules with defined biophysical characteristics are readily visualized using simple stepwise incubations in adjacent flow channels and a flow-free reservoir.
Figure 3. DNA-dumbbell captured in a dual optical trap showing a single fluorescent RecA–ssDNA nucleoprotein filament paired at the homologous locus.

(a) Representation of the product of a single-molecule homologous DNA pairing reaction. Each optical trap (shown in red) captures a single bead (green) at opposite ends of the λ DNA target molecule (also shown in green). The fluorescent RecA–ssDNA nucleoprotein filament (red spot) is shown paired at its designed homologous position in the extended λ DNA molecule. (b) Actual image of the end product of a single-molecule homologous pairing reaction performed with ssDNA (“430 nt”) that is homologous to the center of the λ DNA molecule. The λ DNA molecule and polystyrene beads are visible due to their staining with the dye YOYO-1 (shown in green), and the bound nucleoprotein filament is visible due to fluorescent labeling of the ssDNA with ATTO-565 (red). (c) Same as (b) except a different ssDNA molecule was used to make the RecA nucleoprotein filament. This “1762 nt” ssDNA is homologous to the target λ DNA molecule at approximately one-third of the distance from the end of the λ DNA molecule which, as expected, is in a location different than for the ssDNA used in (b).
As an example, we describe here the homology search experiment performed in our laboratory in which RecA–ssDNA nucleoprotein filaments interact with a λ DNA target molecule (the DNA-dumbbell). The interaction forms a homologously paired complex at the site of sequence complementarity between the ssDNA within the RecA filament and the target dsDNA molecule. In the Reagent Setup, we provide detailed protocols to prepare the λ DNA with biotinylated ends, fluorescent ssDNA, and RecA nucleoprotein filaments. The Procedure describes both the in situ assembly of a DNA dumbbell and the reaction of this DNA-dumbbell with RecA nucleoprotein filaments in flow-free conditions, to form stable homologously paired protein-DNA complexes.
Comparison with other methods
Several single-molecule microscopy methods involve maintaining the target DNA molecule in an extended conformation as described above. For example, the use of combined optical trapping and multi-color fluorescence microscopy has enabled investigations of the role that tension plays in the disassembly of RAD51 nucleoprotein filaments from trapped DNA, and also of the structural transition of DNA under tension.14,15 However, extension-based methods are not ideal for investigating some biological processes, such as the mechanism of sequence-specific target location within a DNA molecule by a protein, where the 3D geometry of the DNA target is important. The 3D conformational states of the DNA that involve looping or intersegmental transfer require that the DNA is flexibly unconstrained and that it has the conformation freedom to assume all of is coiled structural states. These coiled conformations permit distal segments of DNA to approach one another in space, and they can facilitate interactions between protein and DNA by intra- or inter-molecular motions of the distal DNA segments.16–19
Applications of the method
This Protocol should prove useful in visualizing the movements and intermediates of protein-nucleic acid complexes involved in a variety of cellular transactions, such as replication, recombination, repair, transcription, and translation. In particular, the application of these methods to the study of processes such as target searching by proteins involving 1D versus 3D facilitating mechanisms 20, and the effects of DNA dynamics and chromosome structure on such search strategies, where the geometries of the DNA (or other polymers) are expected to have a major impact, should be especially “illuminating”.
Limitations
Because our flow cell fabrication process involves laser-etching and mechanical abrasion, these microfluidic devices may not be compatible with experiments requiring optically clear surfaces on both the top and bottom surfaces of the flow cell, such as those needed for precise force measurements using forward scattered light detection.8,14,15 Our flow cells were not characterized for this application. However, for our applications, because the optical traps are used only to hold a DNA molecule in various extended conformations and then to extend it in order to more accurately determine the position of a DNA-bound protein complex, precise control of DNA tension is not necessary.
Measurement of both center-to-center bead positioning and relative position of stably bound molecular assemblies is performed by analyzing digitally captured epifluorescence images of the beads and of the molecular complexes without performing a subpixel level analysis. Therefore, the resolution limit of this Protocol will be determined by the diffraction limit or the pixel size of the image (~160 nm for the camera described in Equipment Setup). However, adaptation of our existing protocol to include more accurate Gussian localization is certainly feasible.10,13
Another limitation of our design is that imaging requires detection by epifluorescence. Consequently, when the fluorescence background is high due to a high concentration of fluorescent biomolecules, the reaction between fluorescent proteins and the dsDNA cannot be followed in real-time.
Experimental Design
To fabricate the custom glass flow cells that are necessary for this Protocol and that could be readily adapted to other applications, we used relatively straightforward and accessible fabrication tools: a combination of CO2 laser-etching and fine abrasive blasting. Many alternative fabrication processes exist that can be used to create microfluidic devices. They range from simple single-channel designs using double-sided tape to bond a cover glass to a microscope slide, to extremely precise methods involving lithography techniques adapted from the electronics industry.12,13,21
If a modified flow cell design is required for a specific experiment, then the relevant diffusion length scales for the molecules of interest need to be calculated and considered. These distances are important when deciding the location of the channel convergence relative to the position of the flow-free reservoir (Figure 2a). A detailed discussion of these interrelated design issues is beyond the scope of this introduction, but readers are referred to the articles by Amitani et al. and by Brewer et al.12,13 for quantitative discussions of diffusion between channels in microfluidic devices with laminar flow properties. Simply stated, the practical conclusion from these design considerations is that the reservoir should be placed as close both to the location of channel convergence and to the position of optical trapping as is permitted by physical attributes of the flow cell — for the flow cells fabricated in this protocol, is a workable distance 1.5 mm distal to convergence of channel 4 into the common channel (Figure 2a). A short distance between the convergence of all the channels and the location of the reservoir is especially important when considering the diffusion between channels of small molecules, such as salts, fluorescent dyes, and nucleotides. If the trapping position and reservoir inlet are too far downstream from the convergence of input channels, then diffusion of these critical components can lead to contamination of neighboring laminar flow channels as well as the reservoir.
MATERIALS
Reagents
CRITICAL When no manufacturer is specified in the Materials, any high quality reagent can be used.
5-(3-aminoallyl) dUTP (Fermentas #R0091)
Adenosine 5′-O-(3-thiotriphosphate) (ATPγS Calbiotech #119120)
ATTO565 NHS-ester (ATTO-TEC GmbH #AD 565-31)
Avidin agarose (Thermo Scientific #20219)
Biotin-11-dGTP (PerkinElmer #NEL541)
Bovine serum albumin (BSA, Sigma-Aldrich #A-9647)
Deoxyribonucleoside triphosphates (dNTPs: Invitrogen dATP (#55082), TTP (#55085), dCTP (#55083) and dGTP (#55084) for PCR)
Dithiothreitol (DTT Fisher Scientific #BP172-25) CAUTION causes eye and skin irritation; handle wearing goggles, lab coat and gloves
Ethanol (EtOH Gold Shield Chemical Company #43196-117) CAUTION flammable; avoid open flames
Ethylenediaminetetraacetic acid (EDTA, J. T. Baker #8993-01)
Klenow Fragment DNA polymerase I (NEB #M0212S)
Magnesium acetate (Mg(OAc)2 J. T. Baker #2424-01)
Magnesium chloride (MgCl2)
Methanol (MeOH Fisher Scientific #A412-4) CAUTION flammable; avoid open flames
NEB buffer #2 (NEB buffer supplied with Klenow Fragment DNA polymerase I NEB #B7002S)
Phage λ DNA (NEB #N3013S)
Potassium hydroxide (KOH Sigma-Aldrich #221473-1KG) CAUTION corrosive; handle wearing goggles, lab coat and gloves
Primers for polymerase chain reaction (PCR) to yield a 430 bp product identical to λ DNA between base pairs 23,788 and 24,217:
forward primer 5′-biotin-ACTGTTCTTGCGGTTTGGAGG-3′
reverse primer 5′-CTATCGGAAGTTCACCAGCCAG-3′ (can be purchased from any high quality source such as Sigma, Integrated DNA Technologies, or Invitrogen)
Sodium bicarbonate (NaHCO3 J. T. Baker #3506-05)
Sodium chloride (NaCl)
Sodium hydroxide (NaOH)
Streptavidin-coated polystyrene beads, 1 μm (Bangs Laboratories #CP01N/10021)
Sucrose (Sigma-Aldrich #S7903-5KG)
ThermoPol buffer (NEB buffer supplied with VentR® (exo−) DNA polymerase NEB #B9004S)
Tris acetate (TrisOAc TRIZMA base Sigma-Aldrich #T-1503 + Acetic acid EMD #AX0073-9) CAUTION Acetic acid is corrosive; handle wearing goggles, lab coat and gloves in ventilated hood
Water, ultrapure Type 1 (Nanopure (Barnstead) or Milli-Q (Millipore))
VentR® (exo−) DNA Polymerase (NEB #M0257)
YOYO-1 (Invitrogen #Y3601)
Equipment
Abrasive blasting cabinet (Harbor Freight #42202)
Computer with design software such as CorelDraw (Corel Corporation) or Illustrator (Adobe Systems Incorporated)
Cover glass (Corning No. 1, 24×60 mm #2955-246)
Dremel® rotary tool with a diamond coated bit (Dremel #7134)
Epoxy, 5 minute (Devcon #14210)
Gastight syringes 1000 μl (×4) and 50 μl (×1) (Hamilton #1001 and # 1705)
Glass Microscope slides (Fisher Scientific 25×75×1 mm #12-550-A3)
Heat block or water bath for maintaining temperature for various reactions
High-pressure mercury plasma arc-discharge lamp for curing the optical adhesive (Zeiss 100 watt HBO lamp). Alternative UV sources capable of delivering 4.5 Joules/cm2 between 320 – 400 nm may be used. (HARMFUL operate with UV-protection goggles)
iQ imaging software (Andor)
Laser Engraver: 30 watt Mini 24 Laser System (Epilog Laser) controlled by the computer running Corel Draw or Adobe Illustrator.
LaserMask sand carving film (Rayzist Photomask, Inc.)
Microcentrifuge
Micro-spin column (Bio-Rad #732-6204)
MicroSpin S-400 HR Columns (GE Healthcare #27-5140-01)
Nikon Eclipse TE2000-U microscope with TIRF attachment; equipped as described in Equipment Setup
PEEK tubing (Upchurch Scientific #1532, 1.59 mm outer diameter, 0.5 mm inner diameter)
QIAquick PCR purification kit (Qiagen #28104)
Silicon carbide, 220 grit (Electro Abrasives #220-SIC) HARMFUL inhalation hazard; wear mask
Silicone tubing, 0.8 mm inner diameter, 0.8 mm wall thickness (Bio-Rad #731-8210)
Syringe pump (KD Scientific model KDS220)
Thermocycler for PCR
Three-way flow, four-port switching valve (Upchurch Scientific V-100T)
Ultraviolet curing optical adhesive (Norland Optical Adhesive #74 #7404)
Vacuum chamber connected to a vacuum source for degassing solutions (Thermo Scientific #5305-0609, house vacuum supply @ 350 mm Hg)
Equipment Setup
Microscope
Many published protocols exist for the construction of a suitable optical trapping microscope (for examples see Amitani et al. and Lee et al.13,22). The instrument we constructed in the present protocol was developed from a Nikon Eclipse TE2000-U platform with a TIRF attachment (Nikon), equipped with a CFI Plan Apo TIRF 100×, 1.45 N.A., oil-immersed objective;13 a schematic view of this setup is shown in Figure 4. Temperature in the flow cell is regulated using a brass collar wrapped with copper tubing, which is custom-made to fit over the objective and is connected to a circulating water bath. The temperature is continually monitored using a thermistor in the collar. Translation of the stage in the X-Y plane, to move both traps to different positions in the flow cell, is achieved by our group via an ASI stage controller (MS-2000). The ASI stage controller is also used to focus of the objective. Infrared (IR) trapping is achieved as previously described;13 the addition of a fast-steering mirror (FSM-300, Newport) enables control of the X-Y position of one of the laser beams. Fluorescence excitation of the sample is achieved with an X-Cite 120W mercury vapor lamp (Lumen Dynamics) guided through an excitation filter to a dichroic mirror (Chroma # z488/551 RPC c93977). Light emitted from the sample is focused into a Dual-View emission splitting system (Optical Insights), where the green and red components are spatially separated by a dichroic cube (565dxcr, containing two emission band pass filters, HQ515/30 nm and HQ600/40 nm (Chroma)). Real-time observation as well as frame capture are performed with a DU-897E iXon CCD camera (Andor, 100 ms exposure), and processed using iQ imaging software (Andor) by pseudo-coloring the images from each respective channel, red or green, and overlaying the channels to produce color images and videos.
Figure 4. Schematic diagram for a dual laser-trap microscope.

Lenses L1, L2, L3, and L4 collimate and expand the laser. The IR laser is split by a polarizing beam splitter (BS). The first beam path (black line) is reflected off of a fixed mirror (M). The fixed mirror M and the back aperture of the objective lens are conjugated by lenses L5 and L6. The second beam path (gray line) is reflected off a fast-steering mirror (FSM), which is conjugated with the back aperture of the objective by lenses L5 and L6. The fluorescent RecA nucleoprotein complex is illuminated by a mercury lamp (blue and green solid lines). The image of fluorescent RecA nucleoprotein complex is captured with a CCD camera through a Dual-View emission splitting system (dashed lines). The Dual-View component separates the emission from fluorescent dyes and forms images at different positions on a single CCD image sensor. The image of RecA nucleoprotein complex is recorded on a computer. HWP, EX, DM1, and DM2 indicate half-wave plate, excitation filter for mercury lamp, dichroic mirror for IR laser and dichroic mirror for mercury lamp, respectively.
Reagent Setup
Water
For all buffers and washes, use Nanopure (Barnstead) or Milli-Q (Millipore) ultrapure Type 1 water.
Bicarbonate buffer
Prepare a 1 ml of 0.5 M solution of NaHCO3 (pH 9.0) in water for the fluorescent labeling of DNA. This solution should be prepared on the day of use and stored at room temperature (20–25 °C).
Blocking buffer
Prepare 5 mL of 1 mg/ml BSA in SM buffer. Filter this solution through a 0.2 μm filter and degas it for a minimum of 1 h at room temperature in a vacuum desiccator. Buffer should be made fresh on day of use and stored at room temperature.
Denaturation buffer
Prepare 1 ml of 0.15 M NaOH in water. This solution can be prepared ahead of time and stored at room temperature indefinitely in a plastic vessel.
Flow cell cleaning buffer
Prepare a 20 ml solution of 1 M KOH in MeOH. Filter this solution through a 0.2 μm filter and degas it for a minimum of 1 h at room temperature in a vacuum desiccator. This buffer should be made fresh on the day of use and stored at room temperature.
SM buffer
Prepare a 10 mL solution of 50 mM TrisOAc (pH 7.5), 50 mM DTT, 15% sucrose (wt/vol), and 4 mM Mg(OAc)2 in water. Filter this solution through a 0.2 μm filter and degas it for a minimum of 1 h at room temperature in a vacuum desiccator. This buffer should be made fresh on the day of use and stored at room temperature.
SM1 buffer
Prepare a 10 ml solution of 50 mM TrisOAc (pH 8.2), 50 mM DTT, 15% sucrose (wt/vol), and 1 mM Mg(OAc)2 in water. Filter this solution through a 0.2 μm filter and degas it for a minimum of 1 h at room temperature in a vacuum desiccator. This buffer should be made fresh on the day of use and stored at room temperature.
TE buffer
Prepare a 10 ml solution consisting of 10 mM Tris-HCl (pH 8.0) and 1 mM EDTA in water. This buffer can be prepared ahead of time and stored at room temperature indefinitely].
WB buffer
Prepare a 20 ml solution of 10 mM Tris-HCl (pH 7.5), 1 mM EDTA, and 150 mM NaCl in water. This wash and binding buffer can be prepared ahead of time and stored at room temperature indefinitely.
Preparation of λ DNA with biotinylated ends
See Box 1; reagent can be prepared ahead of time and stored at 4 °C for several months.
Box 1.
Preparation of λ DNA with biotinylated ends
TIMING 1 h
-
Prepare a 30 μl reaction mixture containing 1X NEB buffer #2, 33 μM each of dATP, TTP, dCTP and biotin-11-dGTP, 5 μg of phage λ DNA, and 5 units of Klenow Fragment DNA polymerase I (Klenow).
CRITICAL STEP Given the large size of λ DNA, it can easily break due to shear forces created by pipetting. Care should be taken at this stage and in any subsequent stage of the procedure to mix solutions containing λ DNA gently, avoiding high-speed vortexing and repetitive pipetting. A common technique to avoid damaging λ DNA is to use a pipette tip with its end cut-off (~2 mm inner diameter at the opening) to pipet solutions containing λ DNA in order to decrease the shear forces that can break the λ DNA.
Incubate the reaction for 15 min at 25 °C.
Terminate the reaction by addition of 0.6 μl of 0.5 M EDTA (final concentration of 10 mM), followed by heat inactivation of Klenow by incubating the reaction mixture at 75 °C for 20.
-
Dilute the reaction to a final volume of 100 μl with water and pass it through an S-400 spin column equilibrated with TE to remove free unincorporated nucleotides.
PAUSE POINT λ DNA with biotinylated ends can be prepared ahead of time and stored in TE buffer at 4 °C for several months.
Preparation of fluorescent ssDNA homologous to λ DNA
See Box 2; reagent can be prepared ahead of time and stored at 4 °C for several months.
Box 2.
TIMING 2 days (includes overnight precipitation of the DNA)
Preparation of fluorescent ssDNA homologous to λ DNA
Alkali denaturation in combination with the single 5′-biotin incorporated from the forward primer in the PCR reaction is utilized to produce ssDNA from the fluorescently labeled duplex PCR product.
PCR
TIMING 2 h with overnight precipitation of DNA
-
1
Set up a reaction mixture that contains 1X ThermoPol buffer, 0.2 mM dATP, 0.2 mM dCTP, 0.2 mM dGTP, 0.1 mM TTP, 0.2 mM 5-(3-aminoallyl) dUTP, 0.25 ng/μl λ DNA, 0.5 μM of each primer (forward and reverse), and 0.05 U/μl VentR® (exo−) DNA Polymerase.
-
2
Run the PCR reaction in a thermocycler implementing the following program: initial denaturation at 95 °C for 2 min followed by 30 cycles of a denaturation phase at 95 °C for 30 sec, an annealing phase at 62.2 °C for 30 sec, and extension phase at 72 °C for 1 min; the final extension is conducted at 72 °C for 5 min.
-
3
Purify the reaction mixture with QIAquick PCR purification kit to remove excess primers and unincorporated nucleotides.
-
4
Precipitate the DNA at −20 °C overnight (or for longer if desired) with ethanol.
PAUSE POINT The purified PCR product can be stored for several months at −20 °C as an ethanol precipitate.
Fluorescently label the PCR products
TIMING 2.5 h
-
5
Prepare a 20 μl reaction mixture containing 10–20 μg of the PCR-generated DNA containing the amine-modified nucleotide 5-(3-aminoallyl) dUTP, 200 mM sodium bicarbonate (pH 9.0), and 5 mM ATTO565 NHS-ester. Incubate for 1–2 h at 25 °C making sure that the solution is not exposed to light during incubation.
-
6
Add 180 μl of water to bring the total volume to 200 μl. Purify the fluorescently labeled DNA to remove excess free label with the QIAquick PCR purification kit.
PAUSE POINT The purified, labeled DNA is stable for several months stored at 4 °C in elution buffer from step 6 until it is used for the strand-separation step.
Denaturation and purification of fluorescently labeled ssDNA
TIMING 3.5 h
-
7
Pellet 800 μl of resuspended avidin–agarose slurry (~400 μl of settled gel, see manufacturers insert for additional information) in a 1.5 ml Eppendorf tube by centrifugation (carried out in a bench-top micro-centrifuge at 4,500 g for 1 min) and then wash three times by repeated centrifugations in 1 ml WB buffer.
-
8
Dilute ~10–20 μg of fluorescently labeled biotinylated dsDNA (from the PCR reaction above) to 1 ml final volume with WB buffer.
-
9
Add the diluted DNA solution to the washed avidin–agarose from step 7 above and mix by rotating on an end-over-end rotary mixer at room temperature for 1 h making sure that the solution is not exposed to light.
-
10
Pellet avidin–agarose–DNA by centrifugation as in step 7, and wash three times with 1 ml of WB buffer to remove any unbound DNA.
-
11
Elute the non-biotinylated strand of DNA via alkaline denaturation by addition of 200 μl of denaturation buffer to the pelleted agarose and mixing end-over-end for 10 min at room temperature.
-
12
Transfer the slurry obtained from the previous step to an empty micro-spin column and centrifuge in a bench top micro-centrifuge at 4,500 g for 1 min to recover the eluted ssDNA.
-
13
Use a QIAquick PCR purification kit to concentrate the ssDNA and to replace the denaturation buffer with 10 mM Tris-HCl (pH 8.5) (use buffer EB provided with the kit). This eluate is the purified fluorescently labeled ssDNA in TE buffer.
-
14
Determine the concentration of the attached dye; for ATTO563, measure the absorbance at 563 nm and use an extinction coefficient of 120,000 M−1cm−1.
-
15
Determine the ssDNA concentration by measuring the absorbance at 260 nm and using a molar extinction coefficient of 8,919 M−1 cm−1. For ATTO563, to account for absorbance of the dye at 260 nm, the measured absorbance of the labeled ssDNA at 260 nm is corrected by subtracting a value corresponding to 0.34 multiplied by the absorbance of the dye at 563 nm; i.e., corrected A260 = A260 − (A563 × 0.34).
-
16
Calculate the degree of labeling as a ratio of dye to DNA (bases).
PAUSE POINT The fluorescently labeled ssDNA is stored in elution buffer from step 15 at 4 °C and is stable for several months.
RecA nucleoprotein filament formation
See Box 3; reagent is made fresh on the day of the experiment during Step 26 of the PROCEDURE.
Box 3.
Preparation of RecA nucleoprotein filaments
TIMING 1.5 h
Form nucleoprotein filaments by preparing a 50 μl reaction mixture containing 25 mM TrisOAc (pH 7.5), 1 mM DTT, 1 mM ATPγS, 4 mM MgCl2, SSB at a ratio of 1 SSB monomer per 11 nt of ssDNA, and 2 nM fluorescent ssDNA (as adapted from 28).
Incubate for 10 min at 37 °C.
Add RecA at a ratio of 1 RecA per 1.7 nt of ssDNA.
Continue incubation for an additional 1 h at 37 °C. The nucleoprotein filaments need to be prepared on the day of use during step 28 of the procedure, and are stored at 4 °C until loaded into the flow cell for the experiment.
PROCEDURE
Creation of flow cell template for laser engraving using graphics software
TIMING variable
-
1
Design the flow cell pattern to be engraved into the glass microscope slide. This pattern is drawn to scale using a software program capable of generating vector graphics. Our design for a flow cell with four input channels and a reservoir is shown in Figure 5a and can be downloaded from the supplemental information (Supplemental File 1).
Figure 5. Steps involved in flow cell fabrication.

(a) The design pattern for a 4-channel laminar flow cell with a flow-free reaction reservoir. (b) Microscope slide with LaserMask protective film (black) following CO2 laser etching of the pattern. (c) Microscope slide following the abrasive blast step to remove laser-ablated glass from the channels and reservoir. (d) Microscope slide with the protective LaserMask film removed. (e) Microscope slide with holes drilled for attachment of tubing for inlet and outlet ports. (f) Assembled flow cell with PEEK tubing (orange) inserted in holes and secured with epoxy around their base. Short (7–10 mm) pieces of silicone tubing form connectors between the input/output ports of the flow cell and longer PEEK tubing to connect to the syringe pump and waste container (see Figure 7). (g) Magnified view of the reservoir region following the abrasive blasting step. The arrow indicates ablated glass that was not removed completely from the laser-etched pattern. (h) PEEK tubing to be inserted into the holes of the microscope slide with tapered ends (see arrows) to ensure a tight fit.
Flow cell fabrication and assembly TIMING 3 h to etch and assemble the flow cell, 12 h to cure the adhesive, and 12 h to cure epoxy for inlet and outlet
-
2
Apply LaserMask resist film to a glass microscope slide. For detailed instructions on how to carry out this step, see http://www.rayzist.com/Film/Lazermask.php and click on the “Instructionals” tab.
? TROUBLESHOOTING
-
3
Position the glass slide with LaserMask facing upward on the table of the etching laser instrument.
-
4
Etch the channel design using raster mode (Figure 5b). The specific settings to obtain a channel depth of 100–200 μm need to be optimized for the specific laser-etching instrument. We have determined the settings for the Epilog Mini 24 with a 30 watt laser to be as follows: resolution 1200 dpi, speed 20%, and power 100%.
? TROUBLESHOOTING
-
5
Transfer the laser-etched microscope slide to the abrasive blast cabinet.
CRITICAL STEP The LaserMask protective film must remain in place throughout this step to ensure that only the desired features of the flow cell that were etched with the laser are exposed to abrasive blasting.
-
6
Position the blasting gun approximately 2 inches above, and perpendicular to, the surface of the laser-etched microscope slide. Gently blast the top surface of the microscope slide with a side-to-side sweeping motion to remove residual laser ablated glass. 220 grit or finer blasting media should be used for this step.
-
7
Use a dissecting microscope or magnifying glass to inspect the etched channels to ensure that all of the laser-ablated glass is removed (Figure 5c,g).
? TROUBLESHOOTING
-
8
Create holes for inlet and outlet ports in the microscope slide. Two options (A or B) are possible for producing 1.5 mm diameter holes through the slide (positions indicated in red in Figure 5a, and drilled in Figure 5e). Holes can be drilled via laser etching (option A) or mechanical drilling (option B). Laser etching is slower due to the many repeated passes needed to cut through the entire thickness of the microscope slide; however, laser etching is more precise and less likely to break the microscope slide. Mechanical drilling is faster but more likely to crack or break the microscope slide from the pressure exerted by the drill or the heat generated from friction.
A Laser etching of inlet and outlet ports
Place the microscope slide back into the laser etching instrument and use the following raster setting for the Epilog Mini 24, 30 watt laser: 1200 dpi, speed 10% power 100% (settings may need to be adjusted for a different engraving laser).
Etch the holes by multiple passes of the laser to cut through the entire thickness of the microscope slide. With our laser-etching instrument, 15–30 passes are sufficient.
B Mechanical drilling of inlet and outlet ports
-
For this approach, use a Dremel rotary tool with a diamond coated bit (Dremel #7134) per manufacturer’s instructions.
CRITICAL STEP Submerse the microscope slide under a thin layer of water to minimize localized heating of the glass due to friction and to prevent cracking during the drilling process.
? TROUBLESHOOTING
-
9
Remove the LaserMask protective film and clean the etched, drilled microscope slide thoroughly with water.
-
10
Submerge the microscope slide in 1 M NaOH for 1 h, rinse thoroughly with water, then with EtOH.
-
11
Clean cover glass implementing the same procedure described in step 10.
CRITICAL STEP For optimal bonding of the adhesive, both the microscope slide and the cover glass must be free from contaminants.
-
12
Place the microscope slide, etched channels facing upwards, onto a heat block set to 70 °C. Heating the glass lowers the viscosity of the optical adhesive and accelerates the flow of adhesive by capillary action between the microscope slide and cover glass. Align and place the cleaned cover glass on top of the microscope slide over the etched channels.
-
13
Using a small volume pipette, transfer ~20 μl of optical adhesive to the four corners of the cover glass (Figure 6a, red arrows). Allow the adhesive to flow between the two pieces of glass via capillary action (Figure 6b, black arrows).
-
14
Add additional adhesive as needed; this is a slow process and will take 20–30 min to complete.
CRITICAL STEP Patience is essential; if this step is rushed, the addition of too much adhesive too quickly can result in the adhesive flowing into and filling the etched pattern.
? TROUBLESHOOTING
-
15
Cure the adhesive by exposing the slide and cover assembly to a 100-watt high-pressure mercury plasma arc-discharge lamp (100 watt HBO lamp, Zeiss): place the assembly at a distance of 30 cm from the lamp for 20 min. The adhesive has a peak absorbance between 325 nm and 365 nm, and the recommended energy required for full cure of the adhesive is 4.5 Joules/cm2.
-
16
Place the UV-cured flow cell at 50 °C for 12 h in an oven or on a heat block for optimal curing. Additional technical information regarding optical adhesive #74 can be found at http://www.norlandprod.com/adhesives/NOA%2074.html.
-
17
Attach PEEK tubing to create inlet and outlet ports. Cut a 2 cm length of tubing for each inlet and outlet port of the flow cell (six pieces in the case of the design presented here).
-
18
Taper the end of each piece of tubing that will be inserted into the holes that were drilled in the microscope slide (see Figure 5h). The end of the sharpened tip may need to be cut off so that it does not extend through the channel and touch the cover glass on the opposite side of the flow cell. This stratagem ensures a tight fit between the tubing and the microscope slide.
-
19
Insert the tapered tubing into each of the inlet and outlet holes in the microscope slide.
-
20
Apply epoxy (Devcon #14210) so as to form a securing seal around the PEEK tubing where it meets the microscope slide and cure the epoxy overnight according the manufacturer’s instructions (Figure 5f).
PAUSE POINT Assembled flow cells can be stored indefinitely at room temperature, as none of the components appear to degrade with time. We have stored assembled flow cells for over 1 year with no effect on their functionality.
Figure 6. Attachment of the cover glass to the etched microscope slide with UV curing adhesive.

(a) The cleaned, etched microscope slide is placed on a heat block at 70 °C, with channel-side up, and a clean cover glass is aligned to cover the etched channel pattern and to enclose the channels. Adhesive is slowly applied drop-wise to the four corners of the cover glass (red arrows). The adhesive is then wicked between the two surfaces by capillary action. The black arrows point to the advancing (darker) front of the adhesive as it moves from the edge of the slide towards its mid-section. (b) Time course of optical adhesive wicking between the slide and cover glass (15–30 minutes to achieve full adhesive coverage).
Attachment of assembled flow cell to the microscope and fluid priming
TIMING 30 min
-
21
Attach the completed flow cell to the microscope stage and connect the inlet channels to the syringe pump. Connections to 1000 μl glass Hamilton Luer-lock syringes on the syringe pump can be made via 3-way valves (Figure 7a). Use PEEK tubing and short pieces of silicone tubing to act as connectors between two ends of PEEK tubing as shown in Figure 7b.
-
22
Connect an outlet channel of the flow cell — the waste line — to a suitable waste container that will collect the solutions as they exit the flow cell. Use PEEK tubing and short pieces of silicone tubing to act as connectors between two ends of PEEK tubing as shown in Figure 7b.
-
23
Connect a 50 μl syringe containing degassed flow cell cleaning buffer to the reservoir inlet and manually depress the plunger on the syringe. Alternatively, a holder with a screw can be fabricated to mount the syringe on the microscope stage (Figure 8).
-
24
Load 1 ml of flow cell cleaning buffer into each of the four inlet syringes.
CRITICAL STEP At this stage, it is crucial to degas all buffers and solutions that will be introduced into the flow cell to minimize the formation of air bubbles.
-
25
Mount the syringes containing flow cell cleaning buffer on the syringe pump, attach inlet tubing, and inject the cleaning solutions at a rate of 5000 μl/h to both clean the glass surface and remove air bubbles.
-
26
Add 1 ml of degassed water to each of the four input syringes and 50 μl of degassed water to the reservoir syringe. Wash the flow cell by injecting the water as in steps 23 and 25 to remove the flow cell cleaning buffer.
? TROUBLESHOOTING
Figure 7. Flow cell installed in the microscope.

(a) Photograph showing various components of the instrumentation. (b) Flow cell connected to input lines, waste lines, and reservoir syringe.
Figure 8. Custom-fabricated holder for a 50-μl reservoir syringe.
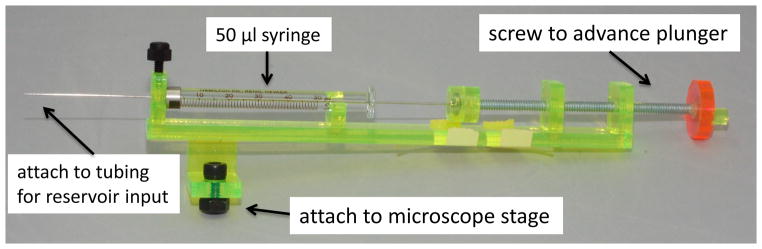
The holder was fabricated from acrylic (6-mm thick) to secure the syringe to the microscope stage. A long screw was attached to the holder to enable controlled manual delivery of the reactant in the syringe into the reservoir inlet port and to prevent back pressure in the flow cell from pushing the plunger out of the syringe.
Blocking the interior surface of the flow cell
TIMING 1–2 h
-
27
Treat the interior surfaces of the flow cell with degassed blocking buffer, following instructions in steps 23–25. Fill the reservoir inlet syringe with 50 μl of blocking buffer and inject. Fill each inlet syringe with 1 ml of blocking buffer and pump 750 μl at a rate of 5000 μl/h. Allow the blocking buffer to remain in the flow cell for a for a minimum of 1 h to reduce non-specific binding of DNA and protein to the surfaces of the flow cell and to decrease background fluorescence.
? TROUBLESHOOTING
-
28
During the blocking incubation, prepare fresh RecA nucleoprotein filaments as described in Box 3.
Preparation of flow cell for reactions
TIMING 20 min
-
29
Disconnect the four 1 ml syringes from the inlet channels and fill them with reaction components as follows (see Figure 2a and 9d for proper channel designation):
Channel 1 syringe. 1 ml of degassed SM1 buffer containing 10–20 fM streptavidin-coated polystyrene beads and 5 nM YOYO-1. The beads readily adsorb YOYO-1 dye enabling their visualization via fluorescence microscopy.
Channel 2 syringe. 1 ml of degassed SM1 buffer containing 10 pM of biotinylated λ DNA (see Box 1)) and 100 nM YOYO-1 (ratio of dye to DNA is ~1:5).
Channel 3 syringe. 1 ml of degassed SM1.
Channel 4 syringe. 1 ml of degassed SM buffer.
-
30
Connect the syringes to the appropriate valves and prime the flow cell by pumping 200 μl of the solutions at a rate of 2000 μl/h (~6 min).
-
31
Decrease the flow rate to maintain a linear velocity of 100 μm/s at the focus of the optical trap within the flow cell.
-
32
Fill the syringe connected to the reservoir, with 50 μl of the RecA nucleoprotein filaments (Box 3).
-
33
Manually prime the reservoir with the RecA nucleoprotein filaments by flushing the reservoir with at least 25 μl of the mentioned mixture.
-
34
Use bright field illumination to position the flow cell on the microscope. Move the flow cell, by adjusting the microscope stage, to a location where the center of the reservoir along the x axis and the outer edge of channel 1 along the y axis (Figure 9d) are positioned in the center of the field of view of the microscope (Figure 9d). This position is designated as 0, 0 (all of the following x, y positions are expressed in mm).
Figure 9. Summary of the protocol for visualization of homologous ssDNA pairing with an individual optically trapped DNA-dumbbell promoted by RecA.

(a) Four-channel flow cell with a flow-free reservoir. (b) DNA-dumbbell assembly and RecA-pairing steps are numbered in blue: (1) Two beads (shown in yellow) are trapped. (2) A λ DNA molecule (green) is captured on one bead. (3) The free DNA end is attached to the second bead using the steerable optical trap. (4) The center-to-center bead distance is set, and YOYO-1 is removed. (5) The DNA-dumbbell is incubated in the reservoir with fluorescent RecA nucleoprotein filaments (red). (6) The DNA-dumbbell is extended for epifluorescence visualization. (c) Images of DNA pairing products using two different RecA–ssDNA nucleoprotein filaments. They are homologous to two different regions of λ DNA as shown in the illustration to the right of the images. (d) Illustration detailing the relative position of the laser traps (red spots) within the flow cell for different steps of the protocol as shown in (a) and described in the text. Panels a–c are adapted from reference.11
DNA-dumbbell formation in the laminar flow channels
TIMING 5 min
-
35
Using fluorescent microscopy for this step and all of the remaining steps to observe beads and DNA, trap a single bead in each of the two traps with the optical traps positioned in channel 1 (bead channel, position 0, −0.125),
? TROUBLESHOOTING
-
36
Move the stage ~0.25 mm along the y-axis to position the trapped beads in channel 2 (DNA channel position 0, −0.375). Observe the beads in real-time; when a λ DNA molecule attaches to one of the beads, it will be immediately evident, as the fluorescent YOYO-1-stained DNA will extend parallel to the direction of buffer flow.
? TROUBLESHOOTING
-
37
Move the trapped beads and DNA ~0.25 mm along the y axis to channel 3 (assembly channel position 0, −0.625), which is devoid of DNA and beads.
-
38
Complete dumbbell assembly by manipulating the steering mirror to align the distal end of the tethered DNA molecule with the unattached bead. Once in close proximity, attachment will occur.
-
39
Confirm distal end capture by moving the steering mirror to verify that the two ends of the DNA molecule are attached to two different beads. Once this confirmation has been achieved, you have made a DNA-dumbbell.
-
40
Move the DNA-dumbbell ~0.25 mm along the y axis to channel 4 (position 0, −0.875) to destain it by incubation in a buffer that contains a magnesium ion concentration (4 mM Mg(OAc)2) that promotes YOYO-1 release.
-
41
Close the excitation shutter to minimize photo-bleaching and photo-cleavage of the DNA-dumbbell during the destaining process. The destaining process will take 1–5 min, depending on the dye concentration and buffer conditions. For the conditions described here, ~1 min is sufficient to remove most of the dye.
? TROUBLESHOOTING
-
42
Set the desired end-to-end distance of the DNA-dumbbell to define the extent of DNA coiled structure (see Figure 1e). If beads of 1 μm of diameter are used, the closest that they can be brought together without the two optical traps affecting one another is 2 μm, center-to-center.
DNA pairing reaction with RecA nucleoprotein filaments
TIMING variable
-
43
Position the DNA-dumbbell in the reservoir region of the flow cell by moving ~5 mm along the y axis (position 0, −5.125).
-
44
Close the excitation shutter to minimize photobleaching, and incubate the DNA-dumbbell with the RecA nucleoprotein filaments for the desired reaction time.
-
45
Move the trapped DNA-dumbbell ~5 mm along the y axis back into channel 4 (position 0, −0.875).
-
46
Extend the DNA-dumbbell to16 μm (distance between the centers of the two beads) to determine the location of any bound RecA nucleoprotein filaments (Figures 3 and 9c). For DNA-dumbbells made with DNA other than λ DNA, extend the beads to just under the calculated B-form contour length of the DNA.
TIMING
The steps required for flow cell fabrication and performing a RecA-mediated DNA pairing assay on relaxed DNA dumbbells are outlined below. This assumes that a fluorescence microscope, with a dual-optical trap is available (required for steps 20–44) and that the required proteins, RecA and SSB, have been obtained (required for steps 26–44).
Reagent Setup
Box 1 steps 1–3, preparation of λ DNA with biotinylated ends: 1 h
Box 2 steps 1–4, generating PCR products: 2 h with overnight precipitation of DNA
Box 2 step 5 and 6, fluorescently label PCR products: 2.5 h
Box 2 steps 7–18, denaturation fluorescently labeled ssDNA: 1.5 h
Box 2 steps 14–18, analysis of ssDNA by gel electrophoresis, buffer exchange, and quantification: 2 h
Box 3 steps 1–6, preparation of RecA nucleoprotein filaments: 1.5 h
Procedure
Step 1, template design: variable, 0–2 h depends on use of the template provided (Supplemental File 1) or on the time to design a new template
Steps 2–19, flow cell fabrication and assembly: 3h plus 12 h to cure adhesive and 12 h to cure epoxy
Steps 20–24, attachment of assembled flow cell to the microscope and fluid priming: 30 min
Step 25, blocking the interior surface of the flow cell: 1–2 h
Step 26, preparation of RecA nucleoprotein filaments (Box 3): 1.5 h performed during the incubation period of step 25
Steps 27–32, loading solutions and reactants into the flow cell: 20 min
Steps 33–37, assembly of DNA dumbbell in situ: 5 min
Steps 38–44, DNA pairing reaction with RecA nucleoprotein filaments: 1–10 min, depending on desired reaction time
See Table 1 for troubleshooting guidelines.
Table 1.
Troubleshooting
| Step | Problem | Possible Reason | Solution |
|---|---|---|---|
| 2 | Air bubbles trapped between the adhesive mask and the glass microscope slide | Improper application of the mask material | Remove film and re-apply |
| 4 | The depth of the etched pattern is too shallow or too deep | Incorrect laser settings or focus for particular instrument | Adjust speed, power settings, or laser focus according to laser engraver instructions |
| 7 | Uneven surface at the bottom of the channels | Poor abrasive blasting technique | Do not direct the blasting gun onto one position; maintain a constant side-to-side, sweeping motion perpendicular to the surface |
| 7 | LaserMask protective layer lifts | Abrasive blasting nozzle held at an angle | Maintain the nozzle of the abrasive blasting gun perpendicular to the surface |
| 8 | Microscope slide cracks or breaks | Too much pressure applied to the slide or too much heat generated when drilling with the Dremel tool | Apply less pressure or submerge the entire slide under a thin layer of water while drilling |
| 14 | Adhesive enters and fills channels | Too much adhesive applied | Separate cover glass and microscope slide; wash off existing adhesive with EtOH or acetone followed by water. Dry cover glass and microscope slide and perform step again |
| 26 | Air bubble present in channels or reservoir | Inefficient priming | Prime again with MeOH followed by water. Ensure that all solutions have been degassed |
| 27 | Nonspecific adsorption of reaction components to the surface | Surface passivation was ineffective | Test other surface-passivating agents, such as casein, polyethylene glycol, or lipids23–25 |
| 35 | Multiple beads captured in a single trap | Traps were positioned in the bead channel too long; bead concentration was too high | Close shutter to release beads then open to trap beads again then move more quickly to DNA channel 2 or reduce bead concentration |
| 36 | DNA not attaching to beads | DNA concentration too low; not enough salt present in buffer | Increase DNA concentration and ensure that 1 mM Mg(OAc)2 is present in SM1 buffer as this is critical for capture “on the fly” |
| 36 | Multiple DNA molecules attach to a single bead | Beads were kept in the DNA channel too long; DNA concentration was too high | Move more quickly to channel 3 immediately after catching a single DNA molecule; reduce DNA concentration |
| 41 | Removal of YOYO-1 is slow or incomplete | Mg(OAc)2 concentration too low in destain channel 4 | Increase Mg(OAc)2 concentration to as high as 10 mM |
| 35–46 | Beads are released from trap while moving between channels | Movement of the stage is too fast relative to laser trap strength | Slow down the movement of the stage; the strength of the traps determines how fast position can be changed without losing the trapped beads |
ANTICIPATED RESULTS
The methods described in this Protocol have proven instrumental in investigating the mechanism of DNA homology search by a RecA–ssDNA nucleoprotein filament.11 The results of this approach visually demonstrated that the homology search occurs by a process termed “intersegmental contact sampling”. The search is facilitated by multivalent contacts between the RecA nucleoprotein filament and the 3D random coiled nature of the target duplex DNA.
The four-channel design of the flow cell permits the sequential real-time assembly of DNA-dumbbells and their interaction with fluorescently labeled RecA-ssDNA nucleoprotein filaments in a flow-free environment. The end result is that after incubation in the flow-free reservoir, the DNA-dumbbell will have a fluorescent RecA–ssDNA nucleoprotein filament bound at the dumbbell’s homologous locus. This fluorescent complex will be visible when the dumbbell assembly is extended to near contour length (16 μm) for observation in channel 4 of the flow cell. Fluorescence images of DNA-dumbbells with a nucleoprotein filament bound at different locations in figures 3b, 3c, and 9c are reported: in one case, the filaments were assembled on the “430” nt ssDNA, which is homologous to a λ DNA region located nearly at the center of the DNA dumbbell, and in the second case, on the “1762” nt ssDNA, which is homologous to a λ DNA region located about 1/3rd of the dumbbell length away from an end of λ the DNA. The lifetime of both the RecA nucleoprotein filament and the homologously paired complex with linear double-strand DNA is affected by ATP hydrolysis as hydrolysis to ADP by RecA promotes dissociation of RecA-DNA complexes. Because the ATP analog, ATPγS, is very poorly hydrolyzed, the paired products are very stable; we have observed paired products for as long as one hour after they were formed, and they are likely to be stable for even longer periods.
A significant fraction of DNA-dumbbells will also display nucleoprotein filaments that are bound non-homologously, as defined by being transiently bound at positions other than the target site. These nucleoprotein filaments will dissociate from the dumbbell within a few seconds. The fraction of dumbbells that exhibit transient non-homologously-bound nucleoprotein filaments is dependent on the length of the ssDNA used to make the nucleoprotein filament. The longer the ssDNA, the more likely one can observe short-lived, non-specific interactions with the DNA-dumbbell. Controls can be performed by using ssDNA that is not homologous to λ DNA to verify the nature of the interactions.
Utilizing the combination of two optical traps with the custom designed flow cell described above permits control over the 3D conformation of the trapped DNA molecule. Additionally, in the reservoir zone of the flow cell, experiments are carried out in the absence of forces generated by flow. Flow-induced forces on a trapped DNA molecule have dramatic effects on DNA conformation and simply decreasing the flow to limit the extension of the DNA is not ideal. This is due to the non-linear nature of the force exerted along the length of a trapped DNA molecule9. Our approach can be extended to study almost any ligands (e.g., proteins) that bind linear polymers (e.g., nucleic acids).
Supplementary Material
File (“Supplemental file 1.*”) containing the template used in the laser-etching step of the flow cell fabrication described herein provided as both Adobe Illustrator (.ai) and Portable Document Format (.pdf) files.
Acknowledgments
The authors are appreciative to members of the Kowalczykowski laboratory for their comments on this work. A.L.F. was funded by an American Cancer Society Postdoctoral Fellowship (PF-08–046–01-GMC); CCD was supported by National Institutes of Health training grant T32 CA108459, and S.C.K. is supported by grants from National Institutes of Health (GM-62653 and GM-64745).
Footnotes
Author Contributions Statement
A.L.F. and C.C.D. conceived the reservoir flow cell design and fabrication process; I.A., C.C.D. and A.L.F. built the microscope; A.L.F and S.C.K. conceived the RecA pairing experiments; A.L.F. carried out the RecA pairing experiments and A.L.F., C.C.D., I.A., and S.C.K. wrote and revised the manuscript.
Competing Interests Declaration
The authors declare that they have no competing financial interests.
References
- 1.Perkins TT, Quake SR, Smith DE, Chu S. Relaxation of a single DNA molecule observed by optical microscopy. Science. 1994;264:822–826. doi: 10.1126/science.8171336. [DOI] [PubMed] [Google Scholar]
- 2.Perkins TT, Smith DE, Chu S. Direct observation of tube-like motion of a single polymer chain. Science. 1994;264:819–822. doi: 10.1126/science.8171335. [DOI] [PubMed] [Google Scholar]
- 3.Walter NG, Huang CY, Manzo AJ, Sobhy MA. Do-it-yourself guide: how to use the modern single-molecule toolkit. Nature methods. 2008;5:475–489. doi: 10.1038/nmeth.1215. [DOI] [PMC free article] [PubMed] [Google Scholar]
- 4.Bianco PR, et al. Processive translocation and DNA unwinding by individual RecBCD enzyme molecules. Nature. 2001;409:374–378. doi: 10.1038/35053131. [DOI] [PubMed] [Google Scholar]
- 5.Amitani I, Baskin RJ, Kowalczykowski SC. Visualization of Rad54, a chromatin remodeling protein, translocating on single DNA molecules. Mol Cell. 2006;23:143–148. doi: 10.1016/j.molcel.2006.05.009. [DOI] [PubMed] [Google Scholar]
- 6.Galletto R, Amitani I, Baskin RJ, Kowalczykowski SC. Direct observation of individual RecA filaments assembling on single DNA molecules. Nature. 2006;443:875–878. doi: 10.1038/nature05197. [DOI] [PubMed] [Google Scholar]
- 7.Hilario J, Amitani I, Baskin RJ, Kowalczykowski SC. Direct imaging of human Rad51 nucleoprotein dynamics on individual DNA molecules. Proc Natl Acad Sci U S A. 2009;106:361–368. doi: 10.1073/pnas.0811965106. 0811965106 [pii] [DOI] [PMC free article] [PubMed] [Google Scholar]
- 8.Gross P, Farge G, Peterman EJ, Wuite GJ. Combining optical tweezers, single-molecule fluorescence microscopy, and microfluidics for studies of DNA-protein interactions. Methods Enzymol. 2010;475:427–453. doi: 10.1016/S0076-6879(10)75017-5. [DOI] [PubMed] [Google Scholar]
- 9.Perkins TT, Smith DE, Larson RG, Chu S. Stretching of a single tethered polymer in a uniform flow. Science. 1995;268:83–87. doi: 10.1126/science.7701345. [DOI] [PubMed] [Google Scholar]
- 10.Candelli A, Wuite GJ, Peterman EJ. Combining optical trapping, fluorescence microscopy and micro-fluidics for single molecule studies of DNA-protein interactions. Phys Chem Chem Phys. 2011;13:7263–7272. doi: 10.1039/c0cp02844d. [DOI] [PubMed] [Google Scholar]
- 11.Forget AL, Kowalczykowski SC. Single-molecule imaging of DNA pairing by RecA reveals a three-dimensional homology search. Nature. 2012;482:423–427. doi: 10.1038/nature10782. [DOI] [PMC free article] [PubMed] [Google Scholar]
- 12.Brewer LR, Bianco PR. Laminar flow cells for single-molecule studies of DNA-protein interactions. Nat Methods. 2008;5:517–525. doi: 10.1038/nmeth.1217. nmeth.1217 [pii] [DOI] [PMC free article] [PubMed] [Google Scholar]
- 13.Amitani I, Liu B, Dombrowski CC, Baskin RJ, Kowalczykowski SC. Watching individual proteins acting on single molecules of DNA. Methods Enzymol. 2010;472:261–291. doi: 10.1016/S0076-6879(10)72007-3. S0076-6879(10)72007-3 [pii] [DOI] [PMC free article] [PubMed] [Google Scholar]
- 14.van Mameren J, et al. Counting RAD51 proteins disassembling from nucleoprotein filaments under tension. Nature. 2009;457:745–748. doi: 10.1038/nature07581. nature07581 [pii] [DOI] [PMC free article] [PubMed] [Google Scholar]
- 15.van Mameren J, et al. Unraveling the structure of DNA during overstretching by using multicolor, single-molecule fluorescence imaging. Proc Natl Acad Sci U S A. 2009;106:18231–18236. doi: 10.1073/pnas.0904322106. 0904322106 [pii] [DOI] [PMC free article] [PubMed] [Google Scholar]
- 16.von Hippel PH, Berg OG. Facilitated target location in biological systems. J Biol Chem. 1989;264:675–678. [PubMed] [Google Scholar]
- 17.Lomholt MA, van den Broek B, Kalisch SM, Wuite GJ, Metzler R. Facilitated diffusion with DNA coiling. Proc Natl Acad Sci U S A. 2009;106:8204–8208. doi: 10.1073/pnas.0903293106. [DOI] [PMC free article] [PubMed] [Google Scholar]
- 18.Foffano G, Marenduzzo D, Orlandini E. Facilitated diffusion on confined DNA. Phys Rev E Stat Nonlin Soft Matter Phys. 2012;85:021919. doi: 10.1103/PhysRevE.85.021919. [DOI] [PubMed] [Google Scholar]
- 19.van den Broek B, Lomholt MA, Kalisch SM, Metzler R, Wuite GJ. How DNA coiling enhances target localization by proteins. Proc Natl Acad Sci U S A. 2008;105:15738–15742. doi: 10.1073/pnas.0804248105. [DOI] [PMC free article] [PubMed] [Google Scholar]
- 20.Berg OG, Winter RB, von Hippel PH. Diffusion-driven mechanisms of protein translocation on nucleic acids. 1. Models and theory. Biochemistry. 1981;20:6929–6948. doi: 10.1021/bi00527a028. [DOI] [PubMed] [Google Scholar]
- 21.Whitesides GM. The origins and the future of microfluidics. Nature. 2006;442:368–373. doi: 10.1038/nature05058. [DOI] [PubMed] [Google Scholar]
- 22.Lee WM, Reece PJ, Marchington RF, Metzger NK, Dholakia K. Construction and calibration of an optical trap on a fluorescence optical microscope. Nat Protoc. 2007;2:3226–3238. doi: 10.1038/nprot.2007.446. [DOI] [PubMed] [Google Scholar]
- 23.Rasnik I, Myong S, Cheng W, Lohman TM, Ha T. DNA-binding orientation and domain conformation of the E. coli rep helicase monomer bound to a partial duplex junction: single-molecule studies of fluorescently labeled enzymes. J Mol Biol. 2004;336:395–408. doi: 10.1016/j.jmb.2003.12.031. [DOI] [PubMed] [Google Scholar]
- 24.Graneli A, Yeykal CC, Prasad TK, Greene EC. Organized arrays of individual DNA molecules tethered to supported lipid bilayers. Langmuir. 2006;22:292–299. doi: 10.1021/la051944a. [DOI] [PubMed] [Google Scholar]
- 25.Persson F, et al. Lipid-based passivation in nanofluidics. Nano Lett. 2012;12:2260–2265. doi: 10.1021/nl204535h. [DOI] [PMC free article] [PubMed] [Google Scholar]
- 26.Mirshad JK, Kowalczykowski SC. Biochemical characterization of a mutant RecA protein altered in DNA-binding loop 1. Biochemistry. 2003;42:5945–5954. doi: 10.1021/bi027233i. [DOI] [PubMed] [Google Scholar]
- 27.Harmon FG, Kowalczykowski SC. RecQ helicase, in concert with RecA and SSB proteins, initiates and disrupts DNA recombination. Genes Dev. 1998;12:1134–1144. doi: 10.1101/gad.12.8.1134. [DOI] [PMC free article] [PubMed] [Google Scholar]
- 28.Menetski JP, Bear DG, Kowalczykowski SC. Stable DNA heteroduplex formation catalyzed by the Escherichia coli RecA protein in the absence of ATP hydrolysis. Proc Natl Acad Sci U S A. 1990;87:21–25. doi: 10.1073/pnas.87.1.21. [DOI] [PMC free article] [PubMed] [Google Scholar]
Associated Data
This section collects any data citations, data availability statements, or supplementary materials included in this article.
Supplementary Materials
File (“Supplemental file 1.*”) containing the template used in the laser-etching step of the flow cell fabrication described herein provided as both Adobe Illustrator (.ai) and Portable Document Format (.pdf) files.