

Abstract
Previous studies from our laboratory have suggested that degenerin proteins contribute to myogenic constriction, a mechanism of blood flow regulation and protection against pressure-dependent organ injury, in renal vessels. The goal of the present study was to determine the importance of one family member, acid-sensing ion channel 2 (ASIC2), in myogenic constriction of renal interlobar arteries, myogenic regulation of whole kidney blood flow, renal injury, and blood pressure using ASIC2+/+, ASIC2+/−, and ASIC2−/− mice. Myogenic constriction in renal interlobar arteries was impaired in ASIC2+/− and ASIC2−/− mice, whereas constriction to KCl/phenylephrine was unchanged. Correction of whole kidney renal vascular resistance (RVR) during the first 5 s after a 10- to 20-mmHg step increase in perfusion pressure, a timeframe associated with myogenic-mediated correction of RVR, was slowed (4.2 ± 0.9, 0.3 ± 0.7, and 2.4 ± 0.3 resistance units/s in ASIC2+/+, ASIC2+/−, and ASIC2−/− mice). Although modest reductions in function were observed in ASIC2−/− mice, greater reductions were observed in ASIC2+/− mice, which may be explained by protein-protein interactions of ASIC2 with other degenerins. Isolated glomeruli from ASIC2+/− and ASIC2−/− mice had modest alterations in the expression of inflammation and injury markers (transforming growth factor-β, mouse anti-target of antiproliferative antibody-1, and nephrin), whereas ASIC2+/− mice had an increase in the remodeling marker collagen type III. Consistent with a more severe loss of function, mean arterial pressure was increased in ASIC2+/− mice (131 ± 3 mmHg) but not in ASIC2−/− mice (122 ± 3 vs. 117 ± 2 mmHg in ASIC2+/+ mice). These results suggest that ASIC2 contributes to transduction of the renal myogenic response and are consistent with the protective role of myogenic constriction against renal injury and hypertension.
Keywords: degenerin, pressure-induced constriction, renal injury, acid-sensing ion channel 2
myogenic constriction is an early onset mechanism of renal blood flow (RBF) regulation. Changes in perfusion pressure evoke changes in vascular resistance to maintain a constant flow. As perfusion pressure increases, blood flow is maintained by vasoconstriction. As perfusion pressure decreases, blood flow is maintained by vasodilation. Changes are fast acting and contribute to flow correction within 5 s (2, 15, 17). Changes in vessel wall stretch are thought to initiate the response by activating a mechanosensor in vascular smooth muscle cells (VSMCs). Activation of the mechanosensor may initiate a signaling cascade leading to VSMC contraction and vasoconstriction (3, 13, 14). While mechanisms of VSMC constriction are well established, the identity of the VSMC mechanosensor that initiates the response remains unclear.
Degenerin proteins are ideal candidates for the mechanosensor in VSMCs because they have a strong evolutionary link to mechanosensing in the nematode Caenorhabditis elegans. Degenerins are a large family of proteins first discovered in the nematode. Most C. elegans degenerin proteins form multimeric ion channels that mediate responses to light touch and muscle stretch (28). Models of the nematode mechanosensor predict that degenerin proteins form the ion-conducting pore of a large multicomponent complex. Two groups of degenerin proteins have been identified in mammals: epithelial Na+ channel (ENaC) and acid-sensing ion channel (ASIC) proteins (1, 20). Several of these degenerin proteins are expressed in VSMCs, and we refer to these collectively as vascular degenerins (6, 7). Our laboratory has previously established a role for βENaC and γENaC proteins in pressure-induced constrictor responses in renal vessels (9, 10, 17, 18). The crystal structure of ASIC1 revealed it is a trimer, and, by extension, other degenerin channels are predicted to form trimers (16). Thus, it is likely that another mammalian degenerin may contribute to renal myogenic constriction. However, the importance of other vascular degenerins in renal myogenic constriction is unknown.
ASIC2 is a vascular degenerin that may also participate in renal myogenic constriction. Its role as a mechanosensor was first demonstrated in sensory neurons (26). Since then, it has been localized in VSMCs, including A10 cells (VSMCs derived from the embryonic aorta) and cerebral VSMCs (8, 11). In middle cerebral arteries, ASIC2 is required for normal myogenic constriction; however, the importance of ASIC2 in transduction of the renal myogenic response remains unknown (8). Therefore, one purpose of the present study was to determine if ASIC2 protein is required for myogenic constriction and myogenic regulation of blood flow in the renal circulation.
In addition to its role as a mechanism of blood flow regulation, the myogenic response plays a critical role in protecting the kidney against hypertension-induced renal injury. Because the myogenic mechanism can rapidly adjust vascular resistance in response to changes in perfusion pressure, it prevents transmission of high systemic pressures to small delicate microvessels of the glomerulus, thereby protecting microvessels against pressure-dependent injury. Consistent with this concept, loss of RBF autoregulation is associated with renal injury and hypertension (21, 22). However, the whether loss of ASIC2-mediated myogenic responsiveness leads to renal injury and/or hypertension remains unknown. Therefore, the second purpose of the present study was to determine if loss of ASIC2 suppresses RBF regulation and induces renal injury and/or hypertension.
METHODS
All protocols and procedures used in the present study were reviewed and approved by the Institutional Animal Care and Use Committee of the University of Mississippi Medical Center. Male and female mice were used for all experiments. All protocols used a similar ratio of male and female mice among the ASIC2 genotype groups studied.
ASIC2 mouse model.
Dr. Michael J. Welsh and Dr. Margaret P. Price (University of Iowa) generously provided our laboratory with ASIC2+/− mating pairs. Generation of the knockout model, created by insertion of a neomycin resistance cassette into a region coding for the second membrane-spanning domain, has been previously described (26). The animal colony was maintained by mating heterozygous pairs, and genotypic analysis of offspring was completed as previously described (8). Genotypes were confirmed by postexperimental analysis from liver DNA.
Detection of ASIC2 message in renal vessels.
We used RT-PCR to determine if renal vascular tissues express ASIC2 message. Renal vessels were dissected from adjacent tissue using a sieving technique. Briefly, mice were perfused transcardially with ice-cold PBS, and kidneys were removed, hemisected, and then gently pressed through a 100-μm mesh screen using the plunger of a glass 30-ml syringe. Tissue remaining on the mesh screen was rinsed by a forceful wash with cold PBS ejected through a 30-guage needle connected to a 60-ml syringe. Vessels (with some adjacent tissue) were collected from the screen and used for RNA isolation (RNAstat, Tel-test). cDNA was obtained using iScript according to manufacturer's instructions (Bio-Rad) and amplified using oligonucleotides (5′-TCCGAGAACATTCTTGTTCTGGAT-3′ and 5′-GTTCTCATCATGGCTCCCTTCCTC-3′) (8). Oligonucleotides were designed to the 3′-end of ASIC2 message and thus do not distinguish between ASIC2a or ASIC2b variants. Samples were held at 94°C for 2 min and then cycled at 94°C for 30 s, 55°C for 30 s, and 68°C for 30 s for 40 cycles. GAPDH primers were used as an internal control and cycled under similar conditions except that the annealing temperature was 60°C (27).
Immunolabeling of ASIC2 in renal VSMCs.
Localization of ASIC2 in renal VSMCs was determined using immunolabeling in enzymatically dissociated VSMCs and paraffin-embedded renal sections. For labeling of dissociated VSMCs, kidneys were harvested from isoflurane-anesthetized mice and hemisected, and the renal vasculature was dissected free from tubular tissue. VSMCs were enzymatically dispersed as previously described (18) from ASIC2+/+, ASIC2+/−, and ASIC2−/− mice (n = 2 each), fixed in 4% paraformaldehyde (10 min), and then briefly air dried to charged glass slides at 37°C. For labeling of renal sections, isoflurane-anesthetized mice were infused with 10 ml PBS followed by 10 ml of 4% paraformaldehyde transcardially. Kidneys were embedded in paraffin and sectioned in 20-μm sections. Renal sections were deparaffinized before being immunolabeled. Dissociated renal VSMCs and renal sections were rinsed in PBS and then incubated with 5% normal donkey serum (NDS) and 0.1–0.3% Triton X-100 in PBS for 1 h. Afterward, samples were incubated with rabbit anti-ASIC2a/b antibodies (1:100) and mouse anti-α-smooth muscle actin (1:00, Sigma Chemicals, St. Louis, MO) in 5% NDS overnight at 4°C. Samples were then rinsed and incubated with donkey anti-mouse Alexa 488 (1:1,000, Invitrogen) and donkey anti-rabbit Cy3 (1:100, Jackson Immunological) in 5% NDS for 1 h. Samples were then rinsed, covered in Gel Mount mounting media, and coverslipped. Antibody localization was visualized using confocal microscopy (Leica TCS SP2). Importantly, samples from animals were collected, immunolabeled, and imaged side by side under identical conditions. In dissociated VSMCs, ASIC2 immunolabeling was normalized to α-smooth muscle actin (an internal control). All images were prepared in Photoshop CS3 (Adobe Systems).
Cannulation of the mouse renal interlobar artery for analysis of myogenic tone.
After anesthetization with isoflurane, male ASIC2+/+, ASIC2+/−, and ASIC2−/− mice (9.4 ± 0.8, 9.1 ± 0.5, and 8.6 ± 0.2 wk of age, P = 0.61) were decapitated, and the kidneys were removed and placed in ice-cold physiological saline solution (PSS) containing (in mM) 130 NaCl, 4 KCl, 1.2 MgSO4, 4 NaHCO3, 1.8 CaCl2, 10 HEPES, 1.18 KH2PO4, 6 glucose, and 0.03 EDTA (pH adjusted to 7.4 with NaOH). A renal interlobar artery (length: ∼0.5–1 mm and inner diameter: 82.07 ± 12.08 μm at 50 mmHg in control animals) was dissected free from the surrounding tissue and placed in a vessel chamber (Living Systems, Burlington, VT) with PSS. The proximal end of the artery was placed on a tapered glass cannula and secured in place with two silk fibers. The artery was then gently flushed to remove blood before the distal end was cannulated. The vessel was then carefully stretched longitudinally to estimate its length in vivo. The vessel chamber was placed on the stage of a Nikon Elipse TE200 microscope. The vessel was pressurized to 75 mmHg, gently heated to 37°C, and equilibrated for 30 min. Bright-field images were collected with a Photometrics CoolSnapfx camera (Roper Scientific, Trenton, NJ). MetaMorph software (Universal Imaging, Downingtown, PA) was used for the determination of inner and outer vessel diameters.
Depolarization and agonist-induced constriction.
Increasing concentrations of KCl (20, 40, and 80 mM) and the α-adrenergic receptor agonist phenylephrine (PE; 10−7–10−4 M) were used to assess depolarization- and agonist-induced vasoconstrictor reactivity in isolated renal interlobar arteries. Increasing concentrations of KCl or PE were exchanged, and images were captured at peak constriction (30–60 s for KCl and 5 min for PE). Vasoconstrictor responses to KCl were assessed before, and responses to PE after, determination of myogenic reactivity. Vasoconstrictor responses were calculated as a percentage of baseline inner diameter. Vessels that failed to constrict >50% to 80 mM KCl or 10−4 M PE were excluded from analysis.
Myogenic vascular reactivity in renal interlobar arteries.
Vessels were exposed to intraluminal pressure steps (5 min, 25 mmHg each) from 25 to 150 mmHg in Ca2+-containing PSS to evaluate myogenic reactivity. Images were collected at the end of each 5-min equilibration period to determine inner diameter. After the pressure steps, vessels were allowed to equilibrate for 30 min with Ca2+-free PSS containing (in mM) 130 NaCl, 4 KCl, 1.2 MgSO4, 4 NaHCO3, 10 HEPES, 1.18 KH2PO4, 6 glucose, 0.03 EDTA, and 2 EGTA (equilibrated to 7.4 pH with NaOH) plus papaverine (10−4 M). The same pressure steps were repeated to determine the passive diameter of each vessel. At each pressure step, myogenic tone was calculated as follows: [(diameter in Ca2+-free conditions − diameter in Ca2+-containing conditions)/diameter in Ca2+-free conditions]. Vessels that failed to dilate >20 μm under Ca2+-free conditions between 25 to 150 mmHg were excluded from analysis.
Whole kidney RBF myogenic regulation.
We wanted to determine if the loss of myogenic constriction observed in renal interlobar artery segments in ASIC2+/− and ASIC2−/− mice are associated with altered whole kidney RBF regulation responses. To address this goal, we evaluated changes in RBF immediately after a step increase in arterial pressure. ASIC2+/+, ASIC2+/−, and ASIC2−/− mice (19.4 ± 1.8, 16.2 ± 1.8, and 16.9 ± 1.9 wk of age, P = 0.48) were maintained under isoflurane anesthesia on a heating pad to maintain body temperature at 37°C (rectal) for the duration of the study. The depth of anesthesia was monitored by the response to toe pinching. Mice were instrumented with a fluid-filled carotid artery catheter to measure arterial blood pressure and a jugular vein catheter for fluid infusion. For the determination of RBF, the left kidney was approached through a retroperitoneal flank incision. The renal artery, celiac artery, mesenteric artery, and lower abdominal aorta were freed from adjacent tissue. The celiac and superior mesenteric arteries were ligated, and a temporary ligature was placed around the lower abdominal aorta. A perivascular flow probe (0.5 PSB, Transonic, Ithaca, NY) was positioned on the left renal artery. RBF was measured using an ultrasound transit-time flowmeter (TS420, Transonic, low-pass filter: 30–40 Hz) along with blood pressure and recorded with a computerized chart recorder (LabChart 6.0, PowerLab, AD Instruments, Colorado Springs, CO).
To achieve a 10- to 20-mmHg step increase in mean arterial pressure (MAP), the ligature around the lower abdominal aorta was tightened, and RBF was recorded for at least 30 s. At the conclusion of the experiments, animals were euthanized by an overdose of isoflurane followed by cervical dislocation. MAP and RBF data were recorded at 1,000 Hz. RBF was normalized to left kidney weight and reported as milliliters per minute per gram kidney weight. RBF responses were obtained in littermate controls of equivalent age and body weight (see Table 2).
Table 2.
Morphological characteristics and baseline hemodynamic properties in anesthetized ASIC2 mice used in renal blood flow regulation experiments
| ASIC2 Genotype |
||||
|---|---|---|---|---|
| +/+ | +/− | −/− | P Value | |
| Left kidney weight, g | 0.20 ± 0.02 | 0.16 ± 0.02 | 0.18 ± 0.02 | 0.33 |
| Mean arterial pressure, mmHg | 83 ± 3 | 85 ± 5 | 87 ± 1 | 0.60 |
| Renal blood flow, ml−1·min−1·g kidney wt−1 | 5.2 ± 0.6 | 6.1 ± 0.8 | 5.7 ± 0.4 | 0.58 |
| Renal vascular resistance, mmHg·ml−1·min−1·g kidney wt−1 | 18.1 ± 2.3 | 15.7 ± 2.4 | 16.2 ± 1.6 | 0.70 |
| N | 9 | 7 | 11 | |
Values are means ± SE; n, sample size. P values were obtained by one-way ANOVA.
Renal vascular resistance (RVR) was calculated as MAP/RBF and reported as resistance units (RU; equal to mmHg·ml−1·min−1·g kidney wt−1). To quantify renal regulation, we continuously recorded pressure and RBF 10 s before and for at least 30 s after a step increase in pressure. Data were extracted at 1-s intervals in LabChart and exported to Microsoft Excel for analysis. The first time point where MAP or RBF increased 5% or more above baseline was used to identify the zero time point. Similar to our previous studies and those of others, the sensitivity of the myogenic mechanism was assessed by the slope of the time-RVR relationship at 0–5 s using linear regression (9, 10, 19).
Assessment of renal injury.
Mice (ASIC2+/+: 23 ± 1 wk of age, n = 8; ASIC2+/−: 23 ± 1 wk of age, n = 8; and ASIC2−/−: 22 ± 1 wk of age, n = 9) were anesthetized with isoflurane until respiration ceased, the heart was exposed, and a small snip was placed in the liver. Mice were flushed with 10–30 ml ice-cold PBS followed by 1–3 ml of 5% Evans blue in PBS via left ventricular injection. Glomeruli were isolated by gently pressing kidney hemisections through a 100-μm mesh screen onto the surface of a 70-μm screen with the plunger of a 30-ml glass syringe. Glomeruli were washed with PBS, identified as small intensely blue stained balls, collected off of the 70-μm screen, and then stored at −80°C until use.
Glomeruli were homogenized in 2× sample buffer containing DTT, and lysates were separated on 12.5% SDS-PAGE gels and transferred to nitrocellulose membranes. Membranes were incubated with antibodies to an inflammatory marker including 1) mouse anti-target of antiproliferative antibody-1, a leukocyte marker (1:1,000, Abcam, Cambridge, MA); 2) mouse anti-collagen type III, a marker of extracellular matrix expansion (1:500, Abcam); 3) rabbit anti-nephrin (1:2,000, Abcam), a marker of glomerular podocyte integrity; and 4) mouse anti-transforming growth factor (TGF)-β1, a cytokine associated with renal fibrosis (1:1,000, Abcam). Rabbit or mouse anti-β-actin antibody (1:5,000 or 10,000, Abcam) was used as a loading control where appropriate. Membranes were incubated with donkey anti-rabbit and anti-mouse IR700/800 (1:2,000, Rockland Immunological, Rockland, IL) and then visualized using the Odyssey Infrared Imaging System (LiCor, Lincoln, NE). To quantify marker expression, we used Odyssey quantization software. Pixel intensity was normalized to the β-actin loading control for each sample.
Blood pressure measurement.
Arterial pressure was measured using intra-arterial carotid catheters in separate groups of ASIC2 mice. Mice (18 ± 1, 18 ± 1, and 19 ± 1 wk of age for ASIC2+/+, ASIC2+/−, and ASIC2−/− mice, n = 15–20) were anesthetized with isoflurane, and catheters were implanted into the left common carotid and tunneled under the skin, exiting between the shoulder blades. Mice were allowed 24 h of recovery from surgery, after which time heart rate and blood pressure were continuously recorded 3 h/day for up to 3 days. Data were collected and stored using LabChart 6 software and exported into Microsoft Excel for analysis.
Statistics.
All data are presented as means ± SE. One-way ANOVA was used when a single variable was compared among the three genotypes. Two-way ANOVA with repeated measures was used for drug (KCl and PE) and pressure steps (SigmaStat 3.0, San Jose, CA). Differences among groups were determined using Student-Newman-Keuls post hoc analysis. A two-tailed t-test was used where appropriate. Statistical significance was set at P < 0.05. P values are shown to denote confidence.
RESULTS
ASIC2 expression and localization in renal VSMCs.
Figure 1 shows the expression and localization of ASIC2 message and protein. ASIC2 message was detected in renal vessels isolated from ASIC2+/+ mice but not ASIC2−/− mice (Fig. 1A). ASIC2 protein was localized in freshly dissociated renal VSMCs in a pattern similar to that previously shown in cerebral VSMCs (Fig. 1B). The small level of fluorescence in ASIC2−/− VSMCs represents background signal. Figure 1C shows images of a cross-section through arterioles (diameter: ∼4–8 μm, paraffin sections), which indicates that ASIC2 is expressed in VSMCs. The immunofluorescence signal was not robust; however, a signal difference was present among ASIC2+/+, ASIC2+/−, and ASIC2−/− samples.
Fig. 1.

Acid-sensing ion channel 2 (ASIC2) message and protein expression in the renal vasculature in ASIC2 mice. A: RT-PCR detection of ASIC2 and GAPDH message in dissected renal vessels. RT, reverse transcriptase. B: representative images of ASIC2 localization in enzymatically dispersed renal vascular smooth muscle cells (VSMCs) and semiquantitative analysis of ASIC2 labeling in VSMCs from ASIC2+/+ and ASIC2−/− mice. Data are means ± SE; n = 20 VSMCs/group obtained from 2 animals. C: ASIC2 localization in a renal arteriole labeled with an ASIC2 antibody directed to the COOH-terminus (ASIC2cterm). *Significantly different from ASIC2+/+ mice using a two-tail test at the P value indicated. L, vessel lumen; Cb, VSMC cell body.
Agonist-induced constriction.
Vasoconstrictor responses to KCl and PE were measured to determine if the ASIC2 genotype altered general vasoconstrictor ability. Vasoconstrictor responses in renal interlobar artery segments to KCl [4 (control), 20, 40, and 80 mM] and PE (10−7-10−4 M) were not different among the ASIC2 genotypes (Fig. 2, A and B, respectively), suggesting that vasoconstriction per se is unaltered in ASIC2+/− and ASIC2−/− mice.
Fig. 2.
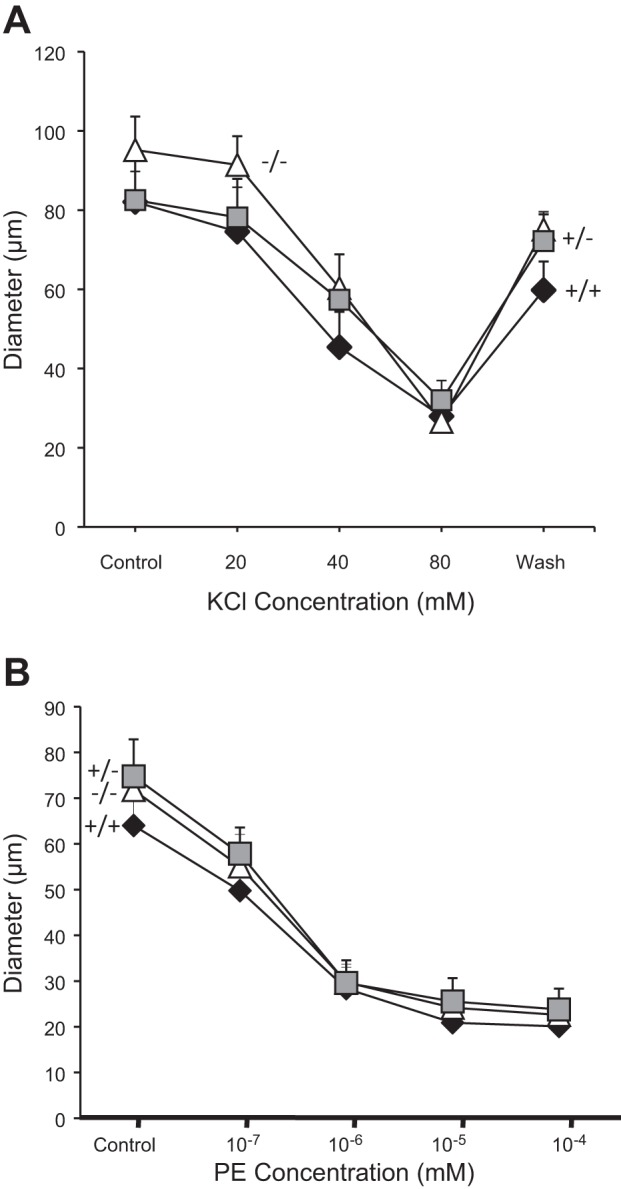
Agonist-induced constriction in renal interlobar arteries from ASIC2 mice. Vasoconstrictor responses to the depolarizing agent KCl (A) and α-adrenergic agonist phenylephrine (PE; B) were similar in ASIC2+/+ (solid diamonds, n = 6), ASIC2+/− (shaded squares, n = 7) and ASIC2−/− (open triangles, n = 8) mice. Data are means ± SE.
Pressure-induced constriction.
The morphological characteristics of the renal interlobar arteries used to assess pressure-induced constriction at the end of the initial equilibration period are shown in Table 1. Inner diameter, outer diameter, wall thickness, and the wall thickness-to-lumen ratio were not different among genotypes (Table 1); however, the low statistical power for a few of the variables shown in Table 1 suggests caution in interpreting this outcome. Changes in renal interlobar artery intraluminal diameter in response to 25-mmHg incremental increases in intraluminal pressure are shown in Fig. 3. Mean inner diameter responses in Ca2+-containing (solid line) and Ca2+-free conditions (dashed line) for ASIC2+/+, ASIC2+/−, and ASIC2−/− mice are shown in Fig. 3A. Under Ca2+-containing conditions, interlobar artery segments from ASIC2+/+ mice maintained a constant diameter with increasing pressure, whereas segments from ASIC2+/− and ASIC2−/− mice dilated. Interlobar artery segments from ASIC2+/+, ASIC2+/−, and ASIC2−/− genotypes dilated similarly to stepwise increases in pressure under Ca2+-free conditions; at 150 mmHg, the inner diameter was not different among groups (118 ± 15, 106 ± 10, and 127 ± 10 μm in ASIC2+/+, ASIC2+/−, and ASIC2−/− mice, respectively, P = 0.43). This latter finding suggests that the ability to dilate was similar among the ASIC2 genotypes. The effect of ASIC2 genotype on the development of myogenic tone is shown in Fig. 3B. In ASIC2+/+ mice, myogenic tone increased as pressure increased from 25 to 150 mmHg. However, in ASIC2+/− and ASIC2−/− mice, renal interlobar segment myogenic tone remained constant and did not increase with increasing intraluminal pressure. Compared with ASIC2+/+ mice, there was significantly less myogenic tone developed in ASIC2+/− mice at 75–150 mmHg and in ASIC2−/− mice at 125 and 150 mmHg (identified by asterisks in Fig. 3B). Additionally, compared with ASIC2−/− mice, renal myogenic tone was significantly reduced in ASIC2+/− mice at 100–150 mmHg (identified by the double dagger symbols in Fig. 3B), suggesting ASIC2+/− mice develop less renal myogenic tone than ASIC2−/− mice. The slope of the pressure at 25–150 mmHg versus myogenic tone relationship from Fig. 3B is shown in Fig. 3C. Compared with ASIC2+/+ mice, the slope of the pressure at 25–150 mmHg versus myogenic tone relationship was significantly lower in ASIC2+/− and ASIC2−/− mice (0.40 ± 0.19, −0.04 ± 0.06, and 0.03 ± 0.05% myogenic tone/mmHg in ASIC2+/+, ASIC2+/−, and ASIC2−/− mice, respectively, P = 0.023). These findings demonstrate that the myogenic response in renal interlobar artery segments is inhibited in ASIC2+/− and ASIC2−/− mice.
Table 1.
Morphological characteristics and renal interlobar dimensions in ASIC2 mice
| ASIC2 Genotype |
||||
|---|---|---|---|---|
| +/+ | +/− | −/− | P Value | |
| Body weight, g | 27.9 ± 1.0 | 27.9 ± 0.6 | 28.6 ± 1.2 | 0.85 |
| Inner diameter, μm | 49.2 ± 7.4 | 42.6 ± 5.4 | 52.9 ± 4.9 | 0.46 |
| Outer diameter, μm | 81.2 ± 8.6 | 79.9 ± 9.4 | 96.1 ± 4.4 | 0.22 |
| Thickness, μm | 32.0 ± 3.6 | 37.3 ± 5.6 | 43.2 ± 2.8 | 0.15 |
| Wall-to-lumen ratio | 0.73 ± 0.14 | 0.89 ± 0.12 | 0.88 ± 0.10 | 0.57 |
| n | 6 | 7 | 8 | |
Values are means ± SE; n, sample size.
ASIC2, acid-sensing ion channel 2.
P values were obtained by one-way ANOVA.
Fig. 3.

Myogenic constriction in renal interlobar arteries from ASIC2 mice. A: inner diameter responses to step increases in intraluminal pressure under Ca2+-containing (+Ca2+, solid line) and Ca2+-free (−Ca2+, dashed line) conditions in ASIC2+/+ (solid diamonds, n = 6; left), ASIC2+/− (shaded squares, n = 7; middle), and ASIC2−/− (open diamonds, n = 8; right) mice. B: calculated myogenic tone (in %) increases with increasing intraluminal pressure in ASIC2+/+ but not ASIC2+/− or ASIC2−/− artery segments. C: mean slope of the intraluminal pressure versus myogenic tone (in %) relationship in B. Morphological characteristics and baseline parameters are shown in Table 1. Data are means ± SE. *Significantly different compared with ASIC2+/+ mice at a given pressure step (P < 0.05); ‡significantly different compared with ASIC2−/− mice at a given pressure step (P < 0.05).
Myogenic regulation of whole kidney blood flow.
To determine if changes in myogenic responsiveness translated into changes in RBF regulation, we examined changes in whole kidney blood flow immediately after a step increase in renal perfusion pressure. The morphological characteristics and baseline steady-state renal hemodynamic parameters were similar between ASIC2+/+, ASIC2+/−, and ASIC2−/− mice (Table 2). Dynamic RBF and RVR responses to a step increase in MAP are shown in Fig. 4, A–C. The data normalized to the baseline values are shown in Fig. 4, D–F. Peak changes in MAP, RBF, and RVR are shown in Fig. 4, G–I. Despite a similar step increase in MAP (Fig. 4, A, D, and G), RBF increased to a greater extent in ASIC2+/− and ASIC2−/− mice (Fig. 4, B, E, and H). The correction of RVR during the first 5 s after the step increase in MAP (which corresponds to the timeframe where the myogenic mechanism is active) is shown on an expanded scale in Fig. 5A, and the slope of time-RVR0–5 s relationship (rate of RVR correction as a percentage of baseline) is shown in Fig. 5B. The rate of the RVR0–5 s correction was greater in ASIC2+/+ mice (4.2 ± 0.9) compared with ASIC2+/− and ASIC2−/− mice (0.3 ± 0.7 and 2.4 ± 0.3, respectively, P = 0.0005). These findings indicate that the in vivo speed of the myogenic response is reduced in ASIC2+/− and ASIC2−/− mice. Similar to the in vitro experiments in renal interlobar artery segments (Fig. 3), the in vivo myogenic response was inhibited to a greater extent in ASIC2+/− mice compared with ASIC2−/− mice. These results suggest that in vivo myogenic regulation is weakened in ASIC2+/− and ASIC2−/− mice.
Fig. 4.

Renal blood flow (RBF) and renal vascular resistance (RVR) correction after a step increase in mean arterial pressure (MAP). A–F: time course of the response of MAP (A and D), RBF (B and E), and RVR (C and F) in ASIC2 mice to a step increase in MAP in ASIC2+/+ (solid diamonds, n = 9), ASIC2+/− (shaded squares, n = 7), and ASIC2−/− (open triangles, n = 11) mice. The time course shows the responses 15 s before and 20 s after the step increase in pressure (time 0). Absolute values are shown in A–C, whereas values normalized to baseline (%baseline) are shown in D–F. KW, kidney weight; RU, resistance units. G–I: changes in MAP (G), RBF (H), and RVR (I) at the time period indicated from baseline. Morphological characteristics and baseline hemodynamic parameters are shown in Table 2. Data are means ± SE. *Significantly different compared with ASIC2+/+ mice (P < 0.05).
Fig. 5.
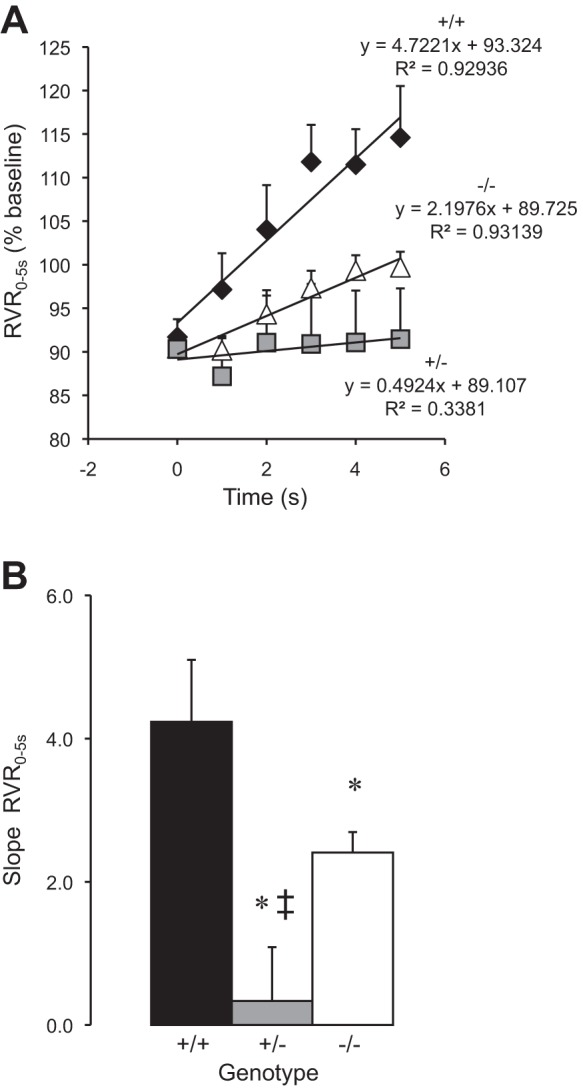
Myogenic regulation of RBF after a step increase in MAP. A: the slope of the linear regression of RVR from time = 0–5 s, the time period in which the myogenic response is active, was used to determine the speed of myogenic RBF mechanisms in ASIC2+/+ (solid diamonds, n = 9), ASIC2+/− (shaded squares, n = 7), and ASIC2−/− (open triangles, n = 11) animals. B: group data. Data are means ± SE. *Significantly different compared with ASIC2+/+ mice (P < 0.05); ‡significantly different compared with ASIC2−/− mice (P < 0.05).
Renal inflammation, injury, and remodeling markers.
To determine if loss of myogenic responsiveness is associated with renal injury, we used Western blot analysis to assess changes in inflammatory and injury markers in the glomeruli of ASIC2 mice. As shown in Fig. 6A, TGF-β, a marker of renal fibrosis, was elevated in ASIC2+/− and ASIC2−/− mice. We also found upregulation of an inflammatory marker (target of antiproliferative antibody-1) and downregulation of a podocyte integrity marker (nephrin). Extracellular matrix expansion (collagen type III) was detected only in ASIC2+/− mice. We also evaluated TNF-α expression, renal histology, and macrophage infiltration, but found no evidence differences among groups (data not shown). Taken together, these findings suggest that although ASIC2+/− and ASIC2−/− mice do not have overt renal injury, they do have evidence of mild renal injury.
Fig. 6.

Evidence of mild renal injury associated with loss of ASIC2. A–D: Western blot analysis of inflammatory markers transforming growth factor (TGF)-β (A) and target of antiproliferative antibody (TAPA)-1 (B) and injury markers collagen type III (C) and nephrin (D) from isolated glomeruli suggesting mild renal injury in mice lacking ASIC2. *Significantly different between the indicated groups (P < 0.05).
Blood pressure.
Since renal injury is associated with hypertension, we wanted to determine if ASIC2+/− and ASIC2−/− mice had increases in blood pressure. Resting MAP in conscious mice measured over a 3-day period during the light cycle indicated that ASIC2+/− mice, but not ASIC2−/− mice, have increased MAP compared with ASIC2+/+ control mice. There was no difference in resting heart rate (Table 3).
Table 3.
Resting mean arterial pressure and heart rate in conscious ASIC2 mice
| ASIC2 Genotype |
||||
|---|---|---|---|---|
| +/+ | +/− | −/− | P Value | |
| Mean arterial pressure, mmHg | 117 ± 2 | 132 ± 3* | 122 ± 3 | 0.003 |
| Heart rate, beats/min | 560 ± 28 | 595 ± 16 | 586 ± 21 | 0.049 |
| n | 17 | 20 | 15 | |
Values are means ± SE; n, sample size.
Significantly different compared with ASIC2+/+ or ASIC2−/− mice (P < 0.01).
DISCUSSION
The myogenic response was first characterized over 100 yr ago; however, the mechanisms underlying the initiation of the myogenic response are still unclear. One hypothesis is that the response is initiated by a mechanosensor, which activates a signaling cascade leading to VSMC contraction and vasoconstriction. Our laboratory has considered the possibility that degenerin proteins are candidates for the vascular mechanosensor because of their strong evolutionary link to mechanotransduction (6, 20, 28). A large body of genetic, electrophysiological, and behavioral evidence suggests that the nematode mechanosensor model is a very large heteromeric complex formed by the extracellular matrix, cytoskeleton, and pore-forming subunits (24, 28, 29). We have used the nematode mechanosensor model as a starting point to determine the identity of the mammalian vascular mechanosensor. The importance of two other mammalian degenerin proteins, βENaC and γENaC, has been established in renal myogenic constriction (9, 17). However, it is unknown if ASIC2, another mammalian degenerin with a link to mammalian mechanotransduction, is also required for renal myogenic constriction. Therefore, one purpose of the present investigation was to determine the importance of ASIC2 in transduction of the renal myogenic response. Findings from the present investigation suggest that ASIC2 is also required for normal renal myogenic constriction.
ASIC2 expression in renal VSMCs.
The myogenic response is mediated by VSMCs; thus, if ASIC2 is a component of a mechanosensor, then ASIC2 should be localized in VSMCs isolated from the renal vasculature. Previous studies (8, 11, 12) have suggested that ASIC2 is present in freshly dissociated cerebral VSMCs and the cultured A10 cell line. We used RT-PCR and immunolabeling to demonstrate that ASIC2 message and protein are expressed in renal vessels and VSMCs, respectively. Our reagents did not discriminate between splice variants. In general, our immunolabeling signal was not robust; however, the signal was consistently greater in ASIC2+/+ samples. It is unknown if this is due to a low level of ASIC2 protein expression or sensitivity of the antibodies. ASIC2 is also expressed in very small arteries and arterioles, a key site in the development of vascular resistance, a finding that demonstrates that ASIC2 is appropriately expressed to participate in myogenic regulation of RVR and RBF.
Myogenic regulation is attenuated in ASIC2+/− and ASIC2−/− mice.
The findings from our studies in renal interlobar arteries suggest an important role for ASIC2 in myogenic responsiveness. The sensitivity of the myogenic response with the in vitro preparation, as assessed by the slope of the pressure-tone relationship, fell ∼90% or greater in ASIC2+/− and ASIC2−/− animals. We also observed a loss of sensitivity in myogenic responsiveness in mice with reduced levels of βENaC in previous studies (5, 10). These findings indicate that loss of βENaC or ASIC2 has a substantial impact on myogenic tone using in vitro preparations, suggesting that both degenerin proteins may contribute to transduction of the renal myogenic response.
ASIC2 contributes to myogenic regulation of RBF.
The renal myogenic mechanism is fast and begins to correct renal vascular resistance within 5 s after a pressure fluctuation (2, 15, 17). Our findings suggest that the speed of myogenic regulation of RVR was significantly attenuated in ASIC2+/− and ASIC2−/− mice. We also observed a similar loss of in vivo myogenic regulation in mice with reduced levels of βENaC. This finding further suggests that ASIC2, in addition to βENaC, contributes to renal myogenic responsiveness.
Why is myogenic regulation altered to a greater extent in ASIC2+/− mice?
The finding that the myogenic response was suppressed to a greater extent in ASIC2+/− versus ASIC2−/− mice was expected since previous studies from our laboratory have demonstrated a similar finding in the middle cerebral artery of ASIC2+/− and ASIC2−/− mice. However, the exact mechanism underlying this finding is unclear. We have previously shown that expression of other mechanosensory degenerin proteins (βENaC and γENaC) were also suppressed in cerebral VSMCs from ASIC2+/− mice but not in ASIC2−/− mice (8). As previously mentioned, βENaC and γENaC are two other degenerin proteins that are required for renal myogenic constriction and hypothesized to associate to form the mechanosensor. Thus, we speculate that reduced expression of βENaC and γENaC also contributes to the reduced responsiveness in the ASIC2+/− model.
Is ASIC2 a component of a heteromultimeric vascular mechanosensor?
Our laboratory has shown that disruption of two different degenerin proteins (βENaC or ASIC2) using genetically modified mice (βENaCm/m and ASIC2−/−) reduces renal myogenic responses using in vitro and in vivo approaches (9, 10). One important question that has not been addressed is whether or not ASIC2 and βENaC act independently to control myogenic tone or whether they interact to form a heteromeric mechanosensor. We favor the scenario that βENaC and ASIC2 associate and form a single heteromeric mechanosensor rather than two distinct homomeric mechanosensors. There are several lines of evidence to support this likelihood. First, some models of the nematode mechanosensor suggest that at least two different degenerin proteins form the ion-conducting pore (28). Second, ASIC2 biochemically interacts with βENaC (25). Third, βENaC and ASIC2 colocalize in distinct punctae near the surface of cerebral VSMCs (8). Fourth, suppression of either ASIC2 or βENaC expression leads to a near abolishment of the in vitro myogenic response, suggesting a synergistic interaction rather than an additive interaction (9). Given these independent findings, we speculate that ASIC2 and βENaC may associate to form a heteromeric mechanosensor. However, additional studies are required to confirm this association in renal VSMCs.
Loss of myogenic regulation is associated with renal injury and hypertension.
Animal models with reduced renal autoregulatory capacity have an increased susceptibility to pressure-dependent renal injury (21, 22). Loutzenhiser et al. (21, 22) have proposed the fast nature of the myogenic response provides protection by preventing transmission of higher systemic blood pressures to the delicate microvasculature. To assess renal injury in our model, we used expression of inflammatory cytokines, extracellular matrix components, and podocyte integrity markers. Consistent with this hypothesis, ASIC2+/− mice with dramatic losses in myogenic regulation also have mild renal injury and elevated blood pressure. We have previously demonstrated that mice with reduced levels of βENaC have reduced myogenic control of renal vascular tone and whole kidney blood flow, which is also associated with mild renal injury and elevated blood pressures (5, 10). Although the ASIC2 and βENaC models have similar phenotypes that are consistent with the hypothesis that myogenic regulation protects against end-organ injury, the link between renal myogenic responsiveness and renal injury/hypertension in our study is only associative. It is unclear if the renal injury and elevated blood pressures are a result of the loss of the myogenic response or if the reduced myogenic responsiveness is a result of the renal injury/elevated blood pressure. Furthermore, the loss of myogenic responsiveness and mild renal injury may increase susceptibility to renal injury/hypertension with a second assault.
Lu et al. (23) have demonstrated ASIC2−/− mice have modest elevations in MAP during nocturnal periods. In the present study, MAP was recorded during daylight periods, and we found no difference in MAP in ASIC2−/− mice, similar to Lu et al. Here, we show, for the first time, that MAP is elevated in ASIC2+/− mice compared with ASIC2+/+ and ASIC2−/− mice. It is important to keep in mind that ASIC2 is also expressed outside of VSMCs and a contribution of non-VSMC ASIC2 to the integrated responses observed in the present study cannot be totally excluded. Therefore, VSMC-specific knockout models will be important in excluding a role for non-VSMC ASIC2 in the regulation of RBF, renal injury, and hypertension.
In summary, the findings of the present investigation demonstrate that ASIC2 is expressed in VSMCs from small renal arteries and arterioles. ASIC2−/− and ASIC2+/− mice have weakened myogenic control of small arteries and whole kidney blood flow, mild renal injury, and increased blood pressure in the ASIC2+/− model. Our findings suggest that ASIC2 is an important mediator of renal myogenic constriction, which may protect against pressure-dependent renal injury and subsequent hypertension.
GRANTS
This work was supported by National Institutes of Health Grants HL-51971, GM-104357, and F30-NS-061365 (to K. P. Gannon) and American Heart Association Grant 20410022.
DISCLOSURES
No conflicts of interest, financial or otherwise, are declared by the author(s).
AUTHOR CONTRIBUTIONS
Author contributions: K.P.G. and H.A.D. conception and design of research; K.P.G., S.E.M., D.E.S., and H.A.D. performed experiments; K.P.G., S.E.M., and H.A.D. analyzed data; K.P.G. and H.A.D. interpreted results of experiments; K.P.G., S.E.M., and H.A.D. prepared figures; K.P.G. drafted manuscript; K.P.G., S.E.M., D.E.S., and H.A.D. approved final version of manuscript; S.E.M. and H.A.D. edited and revised manuscript.
ACKNOWLEDGMENTS
The authors thank Dr. Michael Welsh and Dr. Margaret Price (University of Iowa) for generously providing our laboratory with the ASIC2−/− mouse model.
Present address of K. P. Gannon: Dept. of Neurology, Univ. of Pennsylvania, Philadelphia, PA 19104 (e-mail: kimberly.gannon@uphs.upenn.edu).
Present address of S. E. McKey: Dept. of Pediatrics, Univ. of Mississippi Medical Center, Jackson, MS 39216-4505 (e-mail: smckey@umc.edu).
REFERENCES
- 1.Benos DJ, Stanton BA. Functional domains within the degenerin/epithelial sodium channel (Deg/ENaC) superfamily of ion channels. J Physiol 520: 631–644, 1999. [DOI] [PMC free article] [PubMed] [Google Scholar]
- 2.Cupples WA, Braam B. Assessment of renal autoregulation. Am J Physiol Renal Physiol 292: F1105–F1123, 2007. [DOI] [PubMed] [Google Scholar]
- 3.Davis MJ, Hill MA. Signaling mechanisms underlying the vascular myogenic response. Physiol Rev 79: 387–423, 1999. [DOI] [PubMed] [Google Scholar]
- 4.Drummond HA. betaENaC is a molecular component of a VSMC mechanotransducer that contributes to renal blood flow regulation, protection from renal injury, and hypertension. Front Physiol 3: 341, 2012. [DOI] [PMC free article] [PubMed] [Google Scholar]
- 5.Drummond HA, Grifoni SC, Abu-Zaid A, Gousset M, Chiposi R, Barnard JM, Murphey B, Stec DE. Renal inflammation and elevated blood pressure in a mouse model of reduced β-ENaC. Am J Physiol Renal Physiol 301: F443–F449, 2011. [DOI] [PMC free article] [PubMed] [Google Scholar]
- 6.Drummond HA, Grifoni SC, Jernigan NL. A new trick for an old dogma: ENaC proteins as mechanotransducers in vascular smooth muscle. Physiology (Bethesda) 23: 23–31, 2008. [DOI] [PubMed] [Google Scholar]
- 7.Drummond HA, Jernigan NL, Grifoni SC. Sensing tension: epithelial sodium channel/acid-sensing ion channel proteins in cardiovascular homeostasis. Hypertension 51: 1265–1271, 2008. [DOI] [PMC free article] [PubMed] [Google Scholar]
- 8.Gannon KP, Vanlandingham LG, Jernigan NL, Grifoni SC, Hamilton G, Drummond HA. Impaired pressure-induced constriction in mouse middle cerebral arteries of ASIC2 knockout mice. Am J Physiol Heart Circ Physiol 294: H1793–H1803, 2008. [DOI] [PubMed] [Google Scholar]
- 9.Ge Y, Gannon KP, Gousset M, Liu R, Murphey B, Drummond HA. Impaired myogenic constriction of the renal afferent arteriole in a mouse model of reduced betaENaC expression. Am J Physiol Renal Physiol 302: F1486–F1493, 2012. [DOI] [PMC free article] [PubMed] [Google Scholar]
- 10.Grifoni SC, Chiposi R, McKey SE, Ryan MJ, Drummond HA. Altered whole kidney blood flow autoregulation in a mouse model of reduced β-ENaC. Am J Physiol Renal Physiol 298: F285–F292, 2010. [DOI] [PMC free article] [PubMed] [Google Scholar]
- 11.Grifoni SC, Jernigan NL, Hamilton G, Drummond HA. ASIC proteins regulate smooth muscle cell migration. Microvasc Res 75: 202–210, 2008. [DOI] [PMC free article] [PubMed] [Google Scholar]
- 12.Grifoni SC, McKey SE, Drummond HA. Hsc70 regulates cell surface ASIC2 expression and vascular smooth muscle cell migration. Am J Physiol Heart Circ Physiol 294: H2022–H2030, 2008. [DOI] [PubMed] [Google Scholar]
- 13.Hill MA, Davis MJ, Meininger GA, Potocnik SJ, Murphy TV. Arteriolar myogenic signalling mechanisms: Implications for local vascular function. Clin Hemorheol Microcirc 34: 67–79, 2006. [PubMed] [Google Scholar]
- 14.Hill MA, Zou H, Potocnik SJ, Meininger GA, Davis MJ. Invited review: arteriolar smooth muscle mechanotransduction: Ca2+ signaling pathways underlying myogenic reactivity. J Appl Physiol 91: 973–983, 2001. [DOI] [PubMed] [Google Scholar]
- 15.Holstein-Rathlou NH, Wagner AJ, Marsh DJ. Dynamics of renal blood flow autoregulation in rats. Kidney Int Suppl 32: S98–S101, 1991. [PubMed] [Google Scholar]
- 16.Jasti J, Furukawa H, Gonzales EB, Gouaux E. Structure of acid-sensing ion channel 1 at 1.9 A resolution and low pH. Nature 449: 316–323, 2007. [DOI] [PubMed] [Google Scholar]
- 17.Jernigan NL, Drummond HA. Myogenic vasoconstriction in mouse renal interlobar arteries: role of endogenous β and γENaC. Am J Physiol Renal Physiol 291: F1184–F1191, 2006. [DOI] [PubMed] [Google Scholar]
- 18.Jernigan NL, Drummond HA. Vascular ENaC proteins are required for renal myogenic constriction. Am J Physiol Renal Physiol 289: F891–F901, 2005. [DOI] [PubMed] [Google Scholar]
- 19.Just A, Arendshorst WJ. Dynamics and contribution of mechanisms mediating renal blood flow autoregulation. Am J Physiol Regul Integr Comp Physiol 285: R619–R631, 2003. [DOI] [PubMed] [Google Scholar]
- 20.Kellenberger S, Schild L. Epithelial sodium channel/degenerin family of ion channels: a variety of functions for a shared structure. Physiol Rev 82: 735–767, 2002. [DOI] [PubMed] [Google Scholar]
- 21.Loutzenhiser R, Bidani A, Chilton L. Renal myogenic response: kinetic attributes and physiological role. Circ Res 90: 1316–1324, 2002. [DOI] [PubMed] [Google Scholar]
- 22.Loutzenhiser R, Griffin KA, Bidani AK. Systolic blood pressure as the trigger for the renal myogenic response: protective or autoregulatory? Curr Opin Nephrol Hypertens 15: 41–49, 2006. [DOI] [PubMed] [Google Scholar]
- 23.Lu Y, Ma X, Sabharwal R, Snitsarev V, Morgan D, Rahmouni K, Drummond HA, Whiteis CA, Costa V, Price M, Benson C, Welsh MJ, Chapleau MW, Abboud FM. The ion channel ASIC2 is required for baroreceptor and autonomic control of the circulation. Neuron 64: 885–897, 2009. [DOI] [PMC free article] [PubMed] [Google Scholar]
- 24.Mano I, Driscoll M. DEG/ENaC channels: a touchy superfamily that watches its salt. Bioessays 21: 568–578, 1999. [DOI] [PubMed] [Google Scholar]
- 25.Meltzer RH, Kapoor N, Qadri YJ, Anderson SJ, Fuller CM, Benos DJ. Heteromeric assembly of acid-sensitive ion channel and epithelial sodium channel subunits. J Biol Chem 282: 25548–25559, 2007. [DOI] [PubMed] [Google Scholar]
- 26.Price MP, Lewin GR, McIlwrath SL, Cheng C, Xie J, Heppenstall PA, Stucky CL, Mannsfeldt AG, Brennan TJ, Drummond HA, Qiao J, Benson CJ, Tarr DE, Hrstka RF, Yang B, Williamson RA, Welsh MJ. The mammalian sodium channel BNC1 is required for normal touch sensation. Nature 407: 1007–1011, 2000. [DOI] [PubMed] [Google Scholar]
- 27.Stec DE, Drummond HA, Gousette MU, Storm MV, Abraham NG, Csongradi E. Expression of heme oxygenase-1 in thick ascending loop of henle attenuates angiotensin II-dependent hypertension. J Am Soc Nephrol 23: 834–841, 2012. [DOI] [PMC free article] [PubMed] [Google Scholar]
- 28.Syntichaki P, Tavernarakis N. Genetic models of mechanotransduction: the nematode Caenorhabditis elegans. Physiol Rev 84: 1097–1153, 2004. [DOI] [PubMed] [Google Scholar]
- 29.Welsh MJ, Price MP, Xie J. Biochemical basis of touch perception: mechanosensory function of degenerin/epithelial Na+ channels. J Biol Chem 277: 2369–2372, 2002. [DOI] [PubMed] [Google Scholar]