

Abstract
Tp53-induced glycolysis and apoptosis regulator (TIGAR) activation blocks glycolytic ATP synthesis by inhibiting phosphofructokinase-1 activity. Our data indicate that TIGAR is selectively induced and activated in renal outermedullary proximal straight tubules (PSTs) after ischemia-reperfusion injury in a p53-dependent manner. Under severe ischemic conditions, TIGAR expression persisted through 48 h postinjury and induced loss of renal function and histological damage. Furthermore, TIGAR upregulation inhibited phosphofructokinase-1 activity, glucose 6-phosphate dehydrogenase (G6PD) activity, and induced ATP depletion, oxidative stress, autophagy, and apoptosis. Small interfering RNA-mediated TIGAR inhibition prevented the aforementioned malevolent effects and protected the kidneys from functional and histological damage. After mild ischemia, but not severe ischemia, G6PD activity and NADPH levels were restored, suggesting that TIGAR activation may redirect the glycolytic pathway into gluconeogenesis or the pentose phosphate pathway to produce NADPH. The increased level of NADPH maintained the level of GSH to scavenge ROS, resulting in a lower sensitivity of PST cells to injury. Under severe ischemia, G6PD activity and NADPH levels were reduced during reperfusion; however, blockade of TIGAR enhanced their levels and reduced oxidative stress and apoptosis. Collectively, these results demonstrate that inhibition of TIGAR may protect PST cells from energy depletion and apoptotic cell death in the setting of severe ischemia-reperfusion injury. However, under low ischemic burden, TIGAR activation induces the pentose phosphate pathway and autophagy as a protective mechanism.
Keywords: ATP depletion, glycolytic inhibition, ischemic renal injury, phosphofructokinase, proximal straight tubules, Tp53-induced glycolysis and apoptosis regulator
acute kidney injury (AKI) is a devastating clinical syndrome with a high mortality rate (5). Renal ischemia reperfusion injury (IRI), generally accepted as the major cause of AKI, results from the compromised perfusion of renal tissues. After IRI, it has been demonstrated that a persistent perfusion deficit exists, and, even at 24 h postreperfusion, the medullary partial pressure of oxygen is restored to only 10% of its normal levels (7, 34, 53). Therefore, outermedullary nephron segments may switch from respiration to glycolytic energy metabolism, in an attempt to generate ATP, for up to 48 h postreperfusion (30, 36, 52). Intriguingly, however, significant amounts of ATP are generated by anaerobic glycolysis in the thick ascending limbs but not by proximal tubular cells (1), especially in the S3 segment located in the outer medullary region. The S3 segment of the proximal straight tubule (PST), despite having a higher glycolytic capacity than other proximal tubule segments under normal conditions, has inhibited glycolytic capacity under ischemic conditions in vivo, resulting in PST cell death (47). The molecular mechanism by which glycolysis is selectively inhibited in the PST in the setting of renal ischemia has not yet been elucidated (26). A better understanding of the mechanisms of selective PST injury will enable us to intervene in their functions to prevent the development of PST injury and the clinical consequences of AKI (37). It has been previously suggested that the differences in glucose utilization are not due to a difference in the distribution of glycolytic enzyme activities but due to a differential regulation of hemodynamic factors (41, 42).
Glycolysis is the sequence of reactions that metabolizes one molecule of glucose to two molecules of pyruvate with the concomitant net production of two molecules of ATP. This process is anaerobic. GAPDH plays a key role in glycolysis and gluconeogenesis by reversibly catalyzing the oxidation and phosphorylation of d-glyceraldehyde-3-phosphate to 1,3-diphospho-glycerate (9). Our previous reports (13, 58) indicate that poly(ADP-ribose) polymerase (PARP)1 is selectively induced and activated in PSTs after renal ischemia. PARP gene ablation enhanced the survival (reduced necrosis) of proximal tubular cells and attenuated the inflammatory response after renal ischemia (15, 29). Our recent report (13) established that inhibition of GAPDH enzyme activity via poly(ADP-ribosyl)ation is one of the mechanisms by which glycolysis is inhibited in IRI. However, PARP1 inhibition only partially preserved ATP levels, preventing necrotic cell death only by 33%, and, although it delayed apoptosis, it had no effect on apoptosis at 1 day post-IRI, suggesting alternate mechanisms of glycolytic inhibition may occur to induce PST injury and cell death.
Phosphofructokinase (PFK)-1 is the most important control element in the mammalian glycolytic pathway (8). The activity of PFK increases when the ATP-to-AMP ratio is lowered, whereas a fall in pH (acidosis) inhibits its activity. Another potent activator of PFK-1 is fructose 2,6-bisphosphate, which activates it by increasing its affinity for fructose 6-phosphate and diminishing the inhibitory effect of ATP (8). Two enzymes regulate the concentration of this important regulator of glycolysis by phosphorylating fructose 6-phosphate and dephosphorylating fructose 2,6-bisphosphate. Fructose 2,6-bisphosphate is formed in a reaction catalyzed by PFK-2, a different enzyme from PFK (40). Fructose 2,6-bisphosphate is hydrolyzed to fructose 6-phosphate by a specific phosphatase, fructose bisphosphatase-2, which blocks the third step of glycolysis.
Recently, Tp53-induced glycolysis and apoptosis regulator (TIGAR) has been directly implicated in glucose metabolism by altering the concentration of fructose 2,6-bisphosphate (3). TIGAR shares functional sequence similarities with the bisphosphatase domain of the bifunctional enzyme PFK-2/fructose bisphosphatase-2, which degrades fructose 2,6-bisphosphate. Fructose 2,6-bisphosphate stimulates 6-phospho-1-kinase to convert fructose 6-phosphate to fructose 1,6-bisphosphate at the third rate-limiting step in glycolysis; when fructose 2,6-bisphosphate decreases, the formation of fructose 6-phosphate is favored. TIGAR activation causes a decline in fructose 2,6-bisphosphate levels (by degrading fructose 2,6-bisphosphate) and thereby blocks PFK-1 activity and glycolysis at the third step, resulting in inhibition of ATP synthesis. A consequence of increased TIGAR activity is that it can shift glycolysis to the pentose phosphate pathway (PPP), which generates NADPH to maintain glutathione in a reduced status. Glucose 6-phosphate dehydrogenase (G6PD) is a rate-limiting enzyme in the PPP and can regulate the production of NADPH through the PPP. GSH curbs ROS levels. Our data indicate that TIGAR is selectively induced and activated in PSTs after IRI. Therefore, the possibility exists that increased TIGAR activity via reducing ROS levels may moderate apoptosis and induces autophagy to protect PST cells. On the other hand, enhanced TIGAR activity may inhibit PFK-1 activity and, consequently, ATP production by anaerobic pathways in PST cells, making them more susceptible to ischemic renal injury. In the present study, we determined if TIGAR plays a benevolent or malevolent role in kidneys after mild and severe ischemic burdens.
MATERIALS AND METHODS
Renal IRI.
Male C57BL/6J mice aged 8 to 10 wk were purchased from Jackson Laboratories (Bar Harbor, ME). Male p53 knockout (KO) mice with a C57BL/6J background have been previously described (14, 35). All mouse experiments were performed in accordance with animal protocols approved by the Institutional Animal Care and Use Committee of the University of Nebraska Medical Center. IRI was carried out as previously described (20). Mice were subjected to either 20 or 30 min of bilateral renal ischemia followed by 1, 3, 6, 12, 24, or 48 h of reperfusion under anesthetization with an intraperitoneal injection of a cocktail containing ketamine (200 mg/kg body wt) and xylazine (16 mg/kg body wt). Sham-operated mice underwent the same surgical procedure without ischemia. To use a small interfering (si)RNA targeting TIGAR (siTIGAR) in vivo, TIGAR siSTABLE siRNA (50 μg in 1 ml PBS) modified from siGENOME (catalog no. D-056801-02, Dharmacon, Lafayette, CA) or siSTABLE nontargeting siRNA (siControl; 50 μg in 1 ml PBS, catalog no. D-001700-01) was injected within 10 s into tail veins at 48 and 24 h before ischemia, as previously described (16).
Renal function.
Blood samples were taken from the retroocular vein plexus. Concentrations of plasma creatinine and blood urea nitrogen (BUN) were measured using the QuantiChrom assay kit (BioAssay Systems, Hayward, CA).
Immunohistochemistry.
Immunohistochemical staining of kidneys and cells was performed as previously described (23). Briefly, 4% paraformaldehyde-fixed kidney sections were labeled with antibodies against TIGAR (catalog no. ab62533, Abcam, Cambridge, MA). Periodic acid-Schiff-stained sections were used for tubular injury scoring as previously described (21). TUNEL assay on kidney sections was carried out using the In Situ Cell Death Detection kit with fluorescein (Roche, Mannheim, Germany) (19).
Western blot analysis.
We performed electrophoresis of protein extracts derived from whole kidneys or the outer medullary region using Tris-glycine buffer systems and subsequent blotting as previously described (22). Membranes were incubated with antibodies against TIGAR (catalog no. ab62533, Abcam) or light chain 3 (LC3; catalog no. PM036, MBL, Watertown, MA). Anti-β-actin antibody (catalog no. A5316, Sigma, St. Louis, MO) was used to load controls on stripped membranes. Bands were quantified using Lab Works analysis software (Ultra-Violet Products, Cambridge, UK).
PFK-1 and G6PD activity.
PFK-1 activity was measured as previously described (12). Briefly, whole kidneys or renal outer medullary tissues were homogenized in cold sucrose buffer [0.32 M sucrose and 10 mM Tris·HCl (pH 7.4), Sigma]. Homogenates were centrifuged at 13,000 rpm for 20 min. The supernatant was incubated in 50 mM Tris·HCl (pH 8.0) buffer including 2 mM MgCl2, 2.6 mM DTT, 1 mM EDTA, 5 mM (NH4)2SO4, 40 units aldose, 250 units triosephosphate isomerase, 40 units α-glycerophosphate dehydrogenase, 100 mM fructose 6-phosphate, 100 mM ATP, and 16 mM NADH. The decrease in optical density at 340 nm due to the oxidation of NADH was then measured for 60 s. G6PD activity was measured in a reaction mixture containing 55 mM Tris (pH 7.8), 3.3 mM MgCl2, and 4 mM glucose 6-phosphate with 240 μM NADP+ (Sigma) by the absorbance at 340 nm, as previously described (12).
ATP level, ratio of NADPH to NADPH + NADP+, ratio of GSH to GSSG, and lipid hydroperoxide level.
ATP level, ratio of NADPH to NADPH + NADP+, ratio of GSH to GSSG, and lipid hydroperoxide level in mouse kidneys were assessed by an ATP assay kit, NADP+/NADPH Quantification kit, Glutathione assay kit (BioVision, Mountain View, CA), and Lipid Hydroperoxide assay kit (Cayman, Ann Arbor, MI) following the respective manufacturer's protocols.
Cell culture and immunocytochemistry.
MCT cells were maintained in RPMI-1640 supplemented with 10% FBS (Invitrogen, Carlsbad, CA) at 37°C with 5% CO2. Cells were exposed to normoxia or hypoxia for 3 or 5 h, as we have previously described (13). Immunocytochemistry with a TIGAR antibody (catalog no. 62533, Abcam) was performed as we have previously described (43).
Statistical analyses.
ANOVA was used to compare data among groups using Systat SigmaPlot. Differences between two groups were assessed by two-tailed unpaired Student's t-tests. P values of <0.05 were considered statistically significant.
RESULTS
Enhanced TIGAR expression in mouse kidneys post-IRI is dependent on the ischemic burden and p53.
Spatial and temporal expressions of TIGAR were analyzed using immunohistochemistry and immunoblot analysis, respectively. Sections of the outermedullary region derived from sham-operated, p53 KO, and wild-type IRI kidneys are shown in Fig. 1A. TIGAR immunoreactivity was detected in the outer medullary region but was absent in the cortex and innermedullary regions of the IRI kidney at 6 h after injury. The high-magnification (×400) photograph shows TIGAR expression in the cytoplasmic region of proximal tubular cells, whereas expression was absent in nonproximal tubular cells. To confirm the proximal tubular expression of TIGAR, in vitro experiments using a mouse proximal tubular cell line (MCT cells) were exposed to hypoxic injury for 3 or 5 h. Hypoxia induced the expression of TIGAR in MCT cells at both time points (Fig. 1B). The relatively low TIGAR expression in normoxic cells demonstrated a mostly diffuse cytoplasmic localization. A relocalization of TIGAR to the perinuclear region was observed in posthypoxic cells at both time points, although it was more significant after 5 h of hypoxia (Fig. 1B). Expression of TIGAR was not observed in p53 KO IRI renal tissues using immunohistochemistry (Fig. 1A). To confirm that TIGAR is expressed in a p53-dependent manner after renal IRI, Western blot analysis was carried out on protein derived from WT and p53 KO IRI kidneys. The data shown in Fig. 1C demonstrate that expression of TIGAR was induced in a p53-dependent manner, as its expression was completely prevented in p53-deficient mice at 3 h post-IRI.
Fig. 1.

Ischemia-reperfusion injury (IRI) increases Tp53-induced glycolysis and apoptosis regulator (TIGAR) expression in proximal straight tubule (PST) cells. A: TIGAR expression in the outer medulla in kidneys derived from wild-type or p53 knockout (KO) mice at 6 h of reperfusion after sham operation or 30 min of ischemia using immunohistochemistry. C, cortex; D, distal tubule; im, inner medulla (n = 3). B: TIGAR expression in MCT cells exposed to normoxia or hypoxia for 3 or 5 h using immunohistochemistry (n = 3). Magnification: ×400. C: expression of kidney TIGAR in wild-type or p53 KO mice at 6 h of reperfusion after sham operation or 30 min of ischemia using Western blot analysis (n = 3).
Effect of the ischemic burden on renal function and tissue morphology.
To test the effect of the period of ischemia on renal function, we evaluated renal function in wild-type mice at various time points of reperfusion after 20 or 30 min of ischemia. Renal function was assessed by measuring both plasma creatinine and BUN (Fig. 2A). Plasma creatinine levels were significantly elevated from 6 to 48 h after 30 min of ischemia compared with sham-operated animals. However, 20 min of ischemia did not significantly alter plasma creatinine levels at any of the above time points compared with those of sham-operated mice. Similarly, BUN levels were significantly elevated in mice subjected to 30 min of ischemia and 3–48 h of reperfusion compared with sham-operated mice and were not altered in mice subjected to 20 min of ischemia. Taken together, these data suggest that an increased level of initial injury can worsen renal function after reperfusion.
Fig. 2.

Renal dysfunction, tubular damage, and TIGAR expression after mild or severe IRI. A: concentrations of plasma creatinine and blood urea nitrogen (BUN) at various time points of reperfusion after sham operation or 20 or 30 min of renal ischemia. B: tubular damage in the outer medulla (left) represented by periodic acid-Schiff (PAS) stain on kidney sections at 48 h after sham operation or 20 or 30 min of renal ischemia. Scale bars = 50 μm. Right, tubular injury score measured on PAS-stained kidney sections. C: TIGAR expression in whole kidneys at various time points of reperfusion after sham operation or 20 or 30 min of renal ischemia using Western blot analysis. Values are means ± SD; n = 4. *P < 0.05 vs. sham.
Morphological evaluation after mild or severe IRI.
The level of histopathological injury after IRI was assessed by tubular injury scoring. Photographs of periodic acid-Schiff-stained kidney sections originating from wild-type mice that underwent sham operation or 20 or 30 min of ischemia followed by 48 h of reperfusion are shown in Fig. 2B. Kidneys derived from mice that underwent 30 min of ischemia showed widespread necrosis, tubular cast formation, and sloughed cells in PSTs, whereas these features were dramatically reduced in mice that underwent 20 min of ischemia. Mouse kidneys that endured 20 min of ischemia showed only mild injury at 24 and 48 h of reperfusion. However, kidneys derived from mice that underwent 30 min of ischemia had significantly increased tubular injury from 1 to 48 h postreperfusion (Fig. 2B).
Temporal expression pattern of TIGAR.
Temporal expression of TIGAR was analyzed by Western blot analysis on protein extracted from whole kidneys of mice rendered ischemic for 20 or 30 min and reperfused for various time periods (Fig. 2C). Densitometric quantification of the immunoblot data showed that TIGAR protein was significantly induced in extracts of kidneys of mice that underwent IRI at different time points postinjury compared with those of sham-operated animals. Mild injury due to 20 min of ischemia induced the expression of TIGAR maximally at 1 and 3 h postreperfusion; however, when the duration of ischemia increased from 20 to 30 min, maximal TIGAR expression was observed at 6 h postinjury, and its expression persisted at a higher level up to 48 h postinjury. Collectively, these data suggest that the induced level of TIGAR expression is dependent on the ischemic burden and that its expression may correlate with the extent of functional loss and histological damage.
Increased TIGAR expression correlates with decreased PFK-1 activity and ATP levels after ischemia.
TIGAR activation has been implicated in reducing fructose 2,6-bisphosphate levels and thereby blocking PFK-1 activity at the third step of glycolysis, resulting in inhibition of ATP synthesis (3). We carried out a PFK-1 activity assay in renal outer medullary tissues derived from mice that underwent mild or severe ischemia. The data shown in Fig. 3A indicate that severe renal ischemia decreased PFK-1 activity during reperfusion, whereas its activity was not suppressed from 24 to 48 h after mild ischemia, a condition under where TIGAR activity was increased. Similarly, the level of ATP production in the renal outer medulla after severe ischemia was decreased during reperfusion, but mild ischemia did not suppress the level of ATP production in the renal outer medulla from 12 to 48 h of reperfusion (Fig. 3B). These data suggest that increased TIGAR expression may inhibit glycolysis and anaerobic ATP production in kidneys that underwent ischemia, implicating a potential mechanism by which energy depletion occurs specifically in PSTs.
Fig. 3.
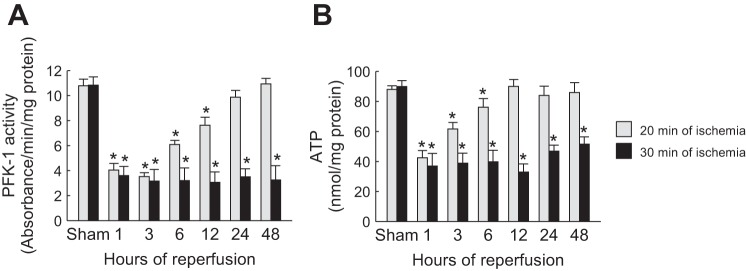
Phosphofructokinase (PFK)-1 activity and ATP level in the renal outer medulla correlated with TIGAR expression after IRI. A: PFK-1 activity in the outer medullary region of kidneys at various time points of reperfusion after sham operation or 20 or 30 min of renal ischemia. B: ATP concentration in the outer medullary region of kidneys at various time points of reperfusion after sham operation or 20 or 30 min of ischemia. Values are means ± SD; n = 4. *P < 0.05 vs. sham.
Increased TIGAR expression correlates with increased G6PD activity, ratio of NADPH to NADPH + NADP+, and ratio of GSSG to GSSG + GSH as well as reduced oxidative stress after IRI.
Increased TIGAR expression can divert the glycolytic pathway toward the PPP (3). One of the key enzymes in activating the PPP is G6PD (2). To determine if the increased TIGAR expression is associated with activation of the PPP, we assayed G6PD in kidneys at different time points of reperfusion after mild or severe ischemia. After mild ischemia, G6PD activity significantly decreased from 1 to 3 h (Fig. 4A). In contrast, G6PD activity persisted at a lower level up to 48 h after severe IRI, even though TIGAR expression was increased (Fig. 4A). To determine if activation of the PPP is associated with increased production of the PPP metabolic product, we assessed the ratio of NADPH to NADPH + NADP+. Consistent with G6PD levels, NADPH levels also were decreased from 1 to 3 h of reperfusion after mild ischemia but persistently decreased up to 48 h after severe IRI (Fig. 4B). These data suggest that moderate TIGAR activation under mild ischemia can promote the PPP, but excessive TIGAR activation after severe ischemia does not activate the PPP.
Fig. 4.

Glucose 6-phosphate dehydrogenase (G6PD), NADPH, oxidative stress, and glutathione in kidneys after mild or severe IRI. Mice were subjected to either 20 or 30 min of bilateral renal ischemia followed by 1, 3, 6, 12, 24, or 48 h of reperfusion. A: G6PD activity in kidneys. B: ratio of NADPH to NADPH + NADP+ in kidneys. C: lipid hydroperoxide levels in kidneys. D: ratio of GSSG to GSSG + GSH in kidneys. Values are means ± SD; n = 4. *P < 0.05 vs. sham.
An increased NADPH level is important in redox homeostasis and can mitigate ROS production via scavenging of ROS by GSH (2, 3). To determine if TIGAR expression is associated with oxidative stress, we assessed lipid hydroperoxide levels. After mild ischemia, lipid hydroperoxide levels were significantly increased from 24 to 48 h (Fig. 4C). In contrast, increased lipid hydroperoxide levels were observed after severe ischemia from 3 to 48 h postreperfusion (Fig. 4C). To determine if ROS levels after mild or severe ischemia are associated with GSH levels, we determined the ratio of GSSG to GSSG + GSH in ischemic kidneys at different time points of reperfusion. The data shown in Fig. 4D indicate that after mild ischemia, the ratio of GSSG to GSSG + GSH was increased from 12 to 24 h of reperfusion, suggesting a possible mechanism for the decreased oxidative stress after mild ischemia. After severe ischemia, the ratio of GSSG to GSSG + GSH rose from 3 to 48 h of reperfusion, consistent with the increased oxidative stress observed through this period of reperfusion.
Increased TIGAR expression correlates with increased autophagy after mild and severe ischemia.
To determine if changes in TIGAR expression and the consequent modulation of ROS levels can affect autophagy, we monitored the level of autophagy by measuring the modification of the ubiquitin-like protein LC3 from LC3-I to LC3-II by Western blot analysis. Our data indicate that oxidative stress was not altered after mild ischemia but that autophagy was increased at 6–24 h but not at 48 h, suggesting that the autophagic response correlated with increased levels of TIGAR expression but may be independent of oxidative stress. The pattern for autophagy after severe ischemia was different and showed an increase from 12 to 48 h (Fig. 5).
Fig. 5.
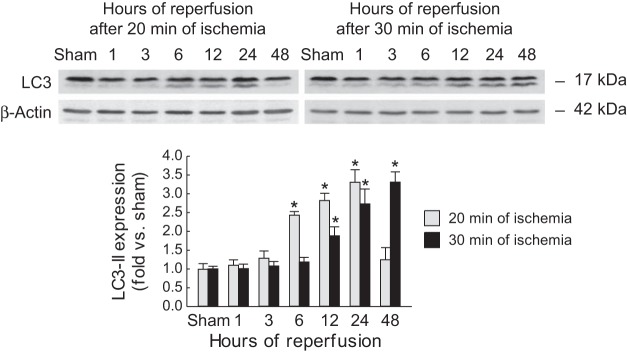
Light chain 3 (LC3) expression in kidneys after mild or severe IRI. Mice were subjected to either 20 or 30 min of bilateral renal ischemia followed by 1, 3, 6, 12, 24, or 48 h of reperfusion. LC3-I (top bands) and LC3-II (bottom bands) expression was assessed in kidneys using Western blot analysis. Values are means ± SD; n = 4. *P < 0.05 vs. sham.
TIGAR inhibition improves renal function and prevents histological damage in severe ischemic kidneys.
To downregulate TIGAR expression in IRI kidneys, we administered siTIGAR in wild-type mice, as detailed in materials and methods. The outermedullary region of the kidney was microdissected, and Western blot analysis was performed. As shown in Fig. 6A, siTIGAR effectively downregulated the expression of TIGAR in the ischemic kidney to levels found in the sham-operated kidneys at 6 h postinjury. TIGAR inhibition led to improved renal function after severe ischemia, as demonstrated by a significant blunting of plasma creatinine and BUN levels at 6 and 24 h post-IRI in siTIGAR-treated mice compared with those in siControl-treated mice (Fig. 6B). To examine if TIGAR inhibition leads to histopathological improvement after severe IRI, we examined tubular damage, necrosis, cast formation, and tubular dilation in IRI kidneys. Kidneys of siControl-treated mice showed severe tubular damage in the outer medulla, as evaluated by tubular necrosis, cast formation, and tubular dilation, whereas this damage was reduced in kidneys of siTIGAR-treated mice (Fig. 6C). Tubular injury scoring based on these parameters was carried out as we have previously described (21). Quantification of the data demonstrated a significant reduction in the tubular injury score at both 6 and 24 h post-IRI in siTIGAR-treated mouse kidneys compared with siControl-treated mouse kidneys (Fig. 6C). These data indicate that TIGAR upregulation contributes to functional and histological damage and that its inhibition can prevent renal IRI.
Fig. 6.

TIGAR inhibition reduces renal dysfunction and tubular damage after severe IRI. Small interfering (si)RNA for TIGAR (siTIGAR) or control siRNA (siControl) (50 μg in 1 ml PBS) was injected within 10 s into mouse tail veins at 48 and 24 h before ischemia. Mice were subjected to 30 min of bilateral renal ischemia or sham operation followed by 6 or 24 h of reperfusion (n = 6). A: TIGAR expression in kidneys at 6 h after IRI or sham operation. B: plasma creatinine and BUN concentration. C: tubular damage in the outer medulla (left) represented by PAS stain on kidney sections at 24 h after 30 min of renal ischemia. Scale bars = 50 μm. Right, tubular injury score measured on PAS-stained kidney sections. Values are means ± SD. *P < 0.05 vs. sham; #P < 0.05 vs. siControl.
siRNA-mediated TIGAR inhibition increased PFK-1 activity, ATP levels, G6PD activity, and ratio of NADPH to NADPH + NADP+ in severe IRI kidneys.
Severe IRI reduced PFK-1 activity and ATP levels and was directly correlated with the level of TIGAR expression (Fig. 3, B and D). To confirm this observation, PFK-1 activity was measured after TIGAR downregulation in kidneys derived from mice subjected to 30 min of ischemia. The data shown in Fig. 7A demonstrate that after siRNA-mediated TIGAR knockdown, PFK-1 activity was restored to a similar level to that in siControl-administered sham-operated kidneys. Similarly, siTIGAR administration restored ATP levels in IRI kidneys to 92.7% of that in siControl-administered sham-operated kidneys (Fig. 7B). These results suggest that the inhibition of PFK by TIGAR upregulation is the critical step in the inhibition of anaerobic glycolysis and ATP synthesis in PSTs after IRI.
Fig. 7.

Protective effect of TIGAR inhibition on PFK-1 activity, ATP concentration, G6PD activity, NADPH level, lipid hydroperoxide level, and GSH level after severe IRI. siTIGAR or siControl (50 μg in 1 ml PBS) was injected within 10 s into mouse tail veins at 48 and 24 h before ischemia. Mice were subjected to 30 min of bilateral renal ischemia or sham operation followed by 6 or 24 h of reperfusion (n = 6). A: PFK-1 activity in kidneys. B: ATP concentration in kidneys. C: G6PD activity in kidneys. D: ratio of NADPH to NADPH + NADP+ in kidneys. E: lipid hydroperoxide level in kidneys. F: ratio of GSSG to GSSG + GSH in kidneys. Values are means ± SD. *P < 0.05 vs. sham; #P < 0.05 vs. siControl.
Increased TIGAR expression can divert the glycolytic pathway toward the PPP pathway and increase G6PD and NADPH levels (2, 3). However, our data demonstrated that G6PD activity and the ratio of NADPH to NADPH + NADP+ were not restored after severe ischemia (Fig. 4, A and B), even though TIGAR expression was increased (Fig. 2C). We next examined if TIGAR inhibition promotes the PPP and increases G6PD activity and the ratio of NADPH to NADPH + NADP+ after severe IRI. Intriguingly, TIGAR blockade enhanced levels of both G6PD activity (Fig. 7C) and the ratio of NADPH to NADPH + NADP+ (Fig. 7D) at 6 and 24 h of reperfusion. These data suggest that in IRI kidneys, high levels of TIGAR expression can block the PPP, whereas TIGAR downregulation promotes the PPP. These data are consistent with our observation that after mild ischemia, low levels of TIGAR expression promote the PPP.
Increased PPP can mitigate ROS production via scavenging of ROS by GSH (2, 3). To determine if TIGAR inhibition in the setting of severe IRI can mitigate oxidative stress, we assessed lipid hydroperoxide levels. After severe ischemia, the lipid hydroperoxide level was reduced after TIGAR inhibition compared with the control (Fig. 7E). To determine if the modulation of ROS after TIGAR inhibition was associated with GSH levels after severe IRI, we determined the ratio of GSSG to GSSG + GSH in ischemic kidneys at different time points of reperfusion. The data shown in Fig. 7F indicate that the ratio of GSSG to GSSG + GSH was increased at 6 and 24 h of reperfusion but that TIGAR inhibition decreased the ratio.
To confirm that TIGAR inhibition in mild ischemic kidneys reduces the PPP, G6PD activity, and ratio of NADPH to NADPH + NADP+ were measured after TIGAR downregulation in kidneys derived from mice subjected to 20 min of ischemia. PFK-1 activity was significantly increased in siTIGAR-administered sham-operated and ischemic kidneys at 6 h postreperfusion compared with that in siControl-administered kidneys (Fig. 8A). siTIGAR-administered mouse kidneys showed a reduction of G6PD activity at 24 h after IRI compared with that in siControl-administered mouse kidneys (Fig. 8B). Similarly, siTIGAR administration reduced the ratio of NADPH to NADPH + NADP+ in IRI kidneys at 24 h postreperfusion (Fig. 8C). Additionally, siRNA-mediated TIGAR inhibition in mild IRI significantly increased lipid peroxidation (Fig. 8D) and worsened renal function (Fig. 8E) at 24 h of reperfusion. These results suggest that TIGAR inhibition in mild IRI worsens the injury via reduction of the PPP in mouse kidneys.
Fig. 8.

Renal injury aggravated by TIGAR inhibition on PFK-1 activity, G6PD activity, NADPH level, lipid hydroperoxide level, and BUN concentration after mild IRI. siTIGAR or siControl (50 μg in 1 ml PBS) was injected within 10 s into mouse tail veins at 48 and 24 h before ischemia. Mice were subjected to 20 min of bilateral renal ischemia or sham operation followed by 6 or 24 h of reperfusion (n = 6). A: PFK-1 activity in kidneys. B: G6PD activity in kidneys. C: ratio of NADPH to NADPH + NADP+ in kidneys. D: lipid hydroperoxide level in kidneys. E: BUN concentration in mice. Values are means ± SD. *P < 0.05 vs. sham; #P < 0.05 vs. siControl.
TIGAR inhibition attenuated apoptotic cell death and autophagy in severe ischemic kidneys.
TUNEL assay was performed to determine the effects of siTIGAR-mediated inhibition of TIGAR on the number of cells undergoing apoptosis in severe IRI mouse kidneys. Quantification of the number of TUNEL-positive apoptotic tubular cells demonstrated that TIGAR inhibition significantly attenuated apoptosis post-IRI (Fig. 9A). The number of apoptotic tubular cells in siTIGAR-treated kidneys at 24 h after severe IRI was 37.3 ± 8.4 compared with 13.3 ± 6.2 in siControl-treated kidneys. To determine the effect of TIGAR inhibition on autophagy, we analyzed the induction and conversion of the autophagic marker LC3-I to LC3-II after severe IRI. As shown in Fig. 9B, TIGAR inhibition decreased LC3-I to LC3-II conversion at 24 h postreperfusion compared with that in siControl-treated mouse kidneys. These data suggest that the induction of apoptosis and autophagy are dependent on TIGAR function after severe IRI.
Fig. 9.

Preventive effect of TIGAR inhibition on tubular apoptosis and autophagy after severe IRI. siTIGAR or siControl (50 μg in 1 ml PBS) was injected within 10 s into mouse tail veins at 48 and 24 h before ischemia. Mice were subjected to 30 min of bilateral renal ischemia or sham operation followed by 24 h of reperfusion (n = 6). A: TUNEL assay on kidney sections (left). Scale bars = 50 μm. Apoptosis in tubular cells represented by TUNEL-positive tubular cells were counted on kidney sections (right). B: LC3-I (top bands) and LC3-II (bottom bands) expression in kidneys using Western blot analysis. Values are means ± SD. *P < 0.05 vs. sham; #P < 0.05 vs. siControl.
DISCUSSION
Compromised perfusion of renal tissue after IRI results in a persistent perfusion deficit, especially in the outer medullary region of the kidney. Consequently, nephron segments of this region switch to anaerobic glycolysis for ATP synthesis and survival. Significant amounts of ATP are generated by the thick ascending limbs, but glycolysis and ATP generation are inhibited in proximal tubular cells (6, 7). A fundamental understanding of the mechanisms by which selective energy depletion occurs in PSTs is critical as it is the primary effect that leads to ATP depletion, cellular injury and death, and the subsequent renal dysfunction after IRI (51). We have previously reported that PARP1-mediated poly(ADP-ribosyl)ation and inhibition of the glycolytic enzyme GAPDH, selectively in proximal tubules, is a critical mechanism by which ATP depletion and injury occur in PST cells. However, PARP1 inhibition or genetic inhibition only partially restored ATP levels, and it has been proposed that glycolytic inhibition at other steps, including blockade of PFK-1, may occur (13).
Previous reports (46, 50) have shown that p53 activation can induce renal tubular cell apoptosis in animal models of ischemic and nephrotoxic AKI. Pharmacological or genetic inhibition of p53 protects against apoptosis and improves renal function in these models of AKI (18, 45, 50, 56). Interestingly, evidence is accumulating that apart from the apoptotic role of p53, it is also an important regulator of cellular stress pathways via mechanisms that modulate metabolic pathways (3, 31, 48, 49). The role of p53 in bioenergetic changes in nephron segments after renal ischemia has not been investigated. In the present study, we demonstrated that the p53 target TIGAR is induced after renal ischemia and that its activation leads to inhibition of PFK-1, providing a physiological role for its activation in the regulation of glycolysis, energy homeostasis, and cellular fate after renal ischemia.
Our data indicate that TIGAR is induced after renal ischemia in outer medullary proximal tubular segments but not in any other nephron segments. Based on the proposed function of TIGAR, this would suggest that TIGAR may play a role in glycolytic inhibition by blocking the glycolytic rate-limiting enzyme PFK-1 (3). Thus, TIGAR activation along with PARP activation (13) could be key mechanisms involved in the cellular regulation of selective inhibition of glycolysis in ischemic kidney PSTs.
The expression of TIGAR is p53 dependent, as expression of TIGAR is completely absent in ischemic renal tissues derived from p53 KO mice. p53 protein is upregulated as early as 1.5 h after renal IRI (18) and rapidly activates TIGAR transcription under cellular stress (28). Based on previous reports (10, 32, 44–46, 56) on the functional consequences of p53 ablation after IRI, we investigated the temporal expression of TIGAR in relation to varying degrees of ischemic stress. Our results demonstrate that TIGAR expression was induced from 1 to 12 h after mild ischemia, whereas its expression persisted for up to 48 h after severe IRI. It is possible that transient activation of TIGAR after mild ischemia may inhibit glycolysis and redirect glycolytic metabolic intermediates to the oxidative branch of the PPP (2, 3). This, in turn, leads to increased production of the reduced form of NADPH, which contributes to the scavenging of ROS by GSH, resulting in a survival response by increasing autophagy and decreasing sensitivity of the cells to oxidative stress-associated apoptosis (3). Indeed, our data indicate that G6PD, NADPH, ROS, and GSH levels were all increased after mild ischemia. This may provide an explanation for TIGAR activation and glycolytic inhibition in this setting, modulating metabolism and thus reducing oxidative stress in PSTs under mild ischemic conditions. These data are consistent with those previously reported in different cells, where TIGAR activation functioned to limit ROS, with protection against ROS-induced cell death (3, 27, 49, 54, 55).
Under a severe ischemic burden, sustained TIGAR expression may lead to the complete shutdown of glycolysis, and the cells will no longer have the capacity to generate ATP. It has been previously reported that increased TIGAR expression can attenuate glycolysis and decrease the growth rate of cytokine-dependent lymphoid cells (3) and induce cardiomyocyte apoptosis (17, 24). Contrary to data supporting a malevolent role for TIGAR in severe ischemia, a recent report has demonstrated that TIGAR was protective in the setting of brain ischemia. Collectively, these results suggest that the consequences of TIGAR expression on glycolysis and ROS regulation can depend, in part, on cell type, cellular metabolism, extent of injury, and TIGAR expression level (25). However, these findings present a question as to why increased TIGAR expression after severe renal ischemia is unable to divert the glycolytic pathway to the PPP. Our data indicate that, after severe renal ischemia, G6PD and NADPH levels are unaltered and that oxidative stress is increased, despite higher levels of TIGAR expression. Furthermore, knockdown of TIGAR attenuated the oxidative injury in IRI models accompanied by increased NADPH and GSH levels. Although the mechanism is undefined, it is possible that the ischemia induced severe ATP depletion, mitochondrial swelling, and Ca2+ accumulation, which may overwhelm the cellular energy metabolism, leading to mitochondrial injury, collapse, and, eventually, cell death. Thus, despite the increased TIGAR expression, the PPP was not activated, as shown by unaltered levels of G6PDH and NADPH, and may suggest that alternatively activated mechanisms may offset the protective effects of TIGAR after severe ischemia.
Why would TIGAR activation inhibit glycolysis and ATP synthesis when it is essentially required for PST cell survival after severe ischemia? Although this question remains unanswered, it should be emphasized that several of the proteins, including p53 and PARP1, that are activated may play benevolent or malevolent roles depending on their temporal expression and/or activity levels (38, 39, 57). Under mild stress conditions, PARP1 functions as a DNA repair enzyme. However, under severe stress conditions, such as IRI, DNA damage results in excessive activation of PARP1, which exacerbates ATP depletion and triggers signaling cascades, leading to cellular death (4). Recent reports have suggested that p53 displays different expression dynamics based on the stimulus and dose. For example, double-stranded breaks by γ-irradiation trigger p53 expression in a series of pulses with fixed amplitude and duration, whereas higher doses of radiation increase the number of pulses without affecting the amplitude or duration. These differential p53 dynamics after mild to severe injury can switch downstream cellular responses from cell cycle arrest and repair of DNA to apoptosis and senescence (39). The function of p53 after renal IRI also appears to be dependent on the ischemic burden as its genetic ablation protects from severe ischemia, whereas it exacerbates the injury after mild ischemia (33, 45, 46, 50, 56). One explanation for this discrepancy after mild injury may be that systemic deletion of p53 results in increased and prolonged infiltration of leukocytes. It has been proposed that leukocyte expression of p53 may be protective from renal ischemia by reducing the extent and duration of inflammation by promoting the anti-inflammatory M2 macrophage phenotype (45). In contrast, our recent report (56) demonstrated that proximal tubule-specific deletion of p53 prevents ischemic renal injury. These observations further support the notion that benevolent and malevolent functions of key proteins, including TIGAR, can be dependent on the type of cells, injury stimulus, and their level of expression.
Collectively, these results demonstrate that expression of TIGAR is physiologically important and that p53-dependent TIGAR functions are a key mediator of glycolytic inhibition, selective PST cell injury, and necrotic/apoptotic cell death in renal ischemia. Inhibition of their functions may protect ischemic PST cells from energy depletion and cell death in the setting of severe IRI.
GRANTS
This work is supported by National Institute of Diabetes and Digestive and Kidney Diseases Grant R56-DK-090332 and American Heart Association Grant-In-aid 10GRNT4040022 (to B. J. Padanilam).
DISCLOSURES
No conflicts of interest, financial or otherwise, are declared by the author(s).
AUTHOR CONTRIBUTIONS
Author contributions: J.K., K.D.-N., and B.J.P. conception and design of research; J.K. and K.D.-N. performed experiments; J.K. and B.J.P. analyzed data; J.K. and B.J.P. interpreted results of experiments; J.K. and K.D.-N. prepared figures; J.K. and B.J.P. drafted manuscript; J.K., K.D.-N., and B.J.P. edited and revised manuscript; B.J.P. approved final version of manuscript.
ACKNOWLEDGMENTS
The authors thank Youngsu Cho for technical assistance with Western blot analysis and immunohistochemistry and Kelly E. Long and Sherry N. Westphal for mouse care.
Present address of K. Devalaraja-Narashimha: Cardiovascular and Renal Research Group, Regeneron Pharmaceuticals, 777 Old Saw Mill River Rd., Tarrytown, NY 10598.
REFERENCES
- 1.Bagnasco S, Good D, Balaban R, Burg M. Lactate production in isolated segments of the rat nephron. Am J Physiol Renal Fluid Electrolyte Physiol 248: F522–F526, 1985. [DOI] [PubMed] [Google Scholar]
- 2.Bensaad K, Cheung EC, Vousden KH. Modulation of intracellular ROS levels by TIGAR controls autophagy. EMBO J 28: 3015–3026, 2009. [DOI] [PMC free article] [PubMed] [Google Scholar]
- 3.Bensaad K, Tsuruta A, Selak MA, Vidal MN, Nakano K, Bartrons R, Gottlieb E, Vousden KH. TIGAR, a p53-inducible regulator of glycolysis and apoptosis. Cell 126: 107–120, 2006. [DOI] [PubMed] [Google Scholar]
- 4.Berger NA. Poly(ADP-ribose) in the cellular response to DNA damage. Radiat Res 101: 4–15, 1985. [PubMed] [Google Scholar]
- 5.Berl T. American Society of Nephrology Renal Research Report. J Am Soc Nephrol 16: 1886–1903, 2005. [DOI] [PubMed] [Google Scholar]
- 6.Bonventre JV. Dedifferentiation and proliferation of surviving epithelial cells in acute renal failure. J Am Soc Nephrol 14, Suppl 1: S55–S61, 2003. [DOI] [PubMed] [Google Scholar]
- 7.Bonventre JV. Mechanisms of ischemic acute renal failure. Kidney Int 43: 1160–1178, 1993. [DOI] [PubMed] [Google Scholar]
- 8.Chesney J. 6-phosphofructo-2-kinase/fructose-2,6-bisphosphatase and tumor cell glycolysis. Curr Opin Clin Nutr Metab Care 9: 535–539, 2006. [DOI] [PubMed] [Google Scholar]
- 9.Chuang DM, Hough C, Senatorov VV. Glyceraldehyde-3-phosphate dehydrogenase, apoptosis, and neurodegenerative diseases. Annu Rev Pharmacol Toxicol 45: 269–290, 2005. [DOI] [PubMed] [Google Scholar]
- 10.Dagher PC. Apoptosis in ischemic renal injury: roles of GTP depletion and p53. Kidney Int 66: 506–509, 2004. [DOI] [PubMed] [Google Scholar]
- 11.De Bock K, Georgiadou M, Schoors S, Kuchnio A, Wong BW, Cantelmo AR, Quaegebeur A, Ghesquière B, Cauwenberghs S, Eelen G, Phng LK, Betz I, Tembuyser B, Brepoels K, Welti J, Geudens I, Segura I, Cruys B, Bifari F, Decimo I, Blanco R, Wyns S, Vangindertael J, Rocha S, Collins RT, Munck S, Daelemans D, Imamura H, Devlieger R, Rider M, Van Veldhoven PP, Schuit F, Bartrons R, Hofkens J, Fraisl P, Telang S, Deberardinis RJ, Schoonjans L, Vinckier S, Chesney J, Gerhardt H, Dewerchin M, Carmeliet P. Role of PFKFB3-driven glycolysis in vessel sprouting. Cell 154: 651–663. [DOI] [PubMed] [Google Scholar]
- 12.Deng H, Yu F, Chen J, Zhao Y, Xiang J, Lin A. Phosphorylation of Bad at Thr-201 by JNK1 promotes glycolysis through activation of phosphofructokinase-1. J Biol Chem 283: 20754–20760, 2008. [DOI] [PMC free article] [PubMed] [Google Scholar]
- 13.Devalaraja-Narashimha K, Padanilam BJ. PARP-1 inhibits glycolysis in ischemic kidneys. J Am Soc Nephrol 20: 95–103, 2009. [DOI] [PMC free article] [PubMed] [Google Scholar]
- 14.Eischen CM, Boyd K. Decreased Mdm2 expression inhibits tumor development and extends survival independent of Arf and dependent on p53. PLos One 7: e46148, 2012. [DOI] [PMC free article] [PubMed] [Google Scholar]
- 15.Filipovic DM, Meng X, Reeves WB. Inhibition of PARP prevents oxidant-induced necrosis but not apoptosis in LLC-PK1 cells. Am J Physiol Renal Physiol 277: F428–F436, 1999. [DOI] [PubMed] [Google Scholar]
- 16.Hamar P, Song E, Kokeny G, Chen A, Ouyang N, Lieberman J. Small interfering RNA targeting Fas protects mice against renal ischemia-reperfusion injury. Proc Natl Acad Sci USA 101: 14883–14888, 2004. [DOI] [PMC free article] [PubMed] [Google Scholar]
- 17.Hoshino A, Matoba S, Iwai-Kanai E, Nakamura H, Kimata M, Nakaoka M, Katamura M, Okawa Y, Ariyoshi M, Mita Y, Ikeda K, Ueyama T, Okigaki M, Matsubara H. p53-TIGAR axis attenuates mitophagy to exacerbate cardiac damage after ischemia. J Mol Cell Cardiol 52: 175–184, 2012. [DOI] [PubMed] [Google Scholar]
- 18.Kelly KJ, Plotkin Z, Vulgamott SL, Dagher PC. P53 mediates the apoptotic response to GTP depletion after renal ischemia-reperfusion: protective role of a p53 inhibitor. J Am Soc Nephrol 14: 128–138, 2003. [DOI] [PubMed] [Google Scholar]
- 19.Kim J, Kim DS, Park MJ, Cho HJ, Zervos AS, Bonventre JV, Park KM. Omi/HtrA2 protease is associated with tubular cell apoptosis and fibrosis induced by unilateral ureteral obstruction. Am J Physiol Renal Physiol 298: F1332–F1340, 2010. [DOI] [PMC free article] [PubMed] [Google Scholar]
- 20.Kim J, Kim KY, Jang HS, Yoshida T, Tsuchiya K, Nitta K, Park JW, Bonventre JV, Park KM. Role of cytosolic NADP+-dependent isocitrate dehydrogenase in ischemia-reperfusion injury in mouse kidney. Am J Physiol Renal Physiol 296: F622–F633, 2009. [DOI] [PMC free article] [PubMed] [Google Scholar]
- 21.Kim J, Long KE, Tang K, Padanilam BJ. Poly(ADP-ribose) polymerase 1 activation is required for cisplatin nephrotoxicity. Kidney Int 82: 193–203, 2012. [DOI] [PubMed] [Google Scholar]
- 22.Kim J, Padanilam BJ. Loss of poly(ADP-ribose) polymerase 1 attenuates renal fibrosis and inflammation during unilateral ureteral obstruction. Am J Physiol Renal Physiol 301: F450–F459, 2011. [DOI] [PubMed] [Google Scholar]
- 23.Kim J, Padanilam BJ. Renal nerves drive interstitial fibrogenesis in obstructive nephropathy. J Am Soc Nephrol 24: 229–242, 2013. [DOI] [PMC free article] [PubMed] [Google Scholar]
- 24.Kimata M, Matoba S, Iwai-Kanai E, Nakamura H, Hoshino A, Nakaoka M, Katamura M, Okawa Y, Mita Y, Okigaki M, Ikeda K, Tatsumi T, Matsubara H. p53 and TIGAR regulate cardiac myocyte energy homeostasis under hypoxic stress. Am J Physiol Heart Circ Physiol 299: H1908–H1916, 2010. [DOI] [PubMed] [Google Scholar]
- 25.Li M, Sun M, Cao L, Gu JH, Ge J, Chen J, Han R, Qin YY, Zhou ZP, Ding Y, Qin ZH. A TIGAR-regulated metabolic pathway is critical for protection of brain ischemia. J Neurosci 34: 7458–7471, 2014. [DOI] [PMC free article] [PubMed] [Google Scholar]
- 26.Lieberthal W, Nigam SK. Acute renal failure. I. Relative importance of proximal vs. distal tubular injury. Am J Physiol Renal Physiol 275: F623–F631, 1998. [DOI] [PubMed] [Google Scholar]
- 27.Lui VW, Lau CP, Cheung CS, Ho K, Ng MH, Cheng SH, Hong B, Tsao SW, Tsang CM, Lei KI, Yamasaki Y, Mita A, Chan AT. An RNA-directed nucleoside anti-metabolite, 1-(3-C-ethynyl-beta-d-ribo-pentofuranosyl)cytosine (ECyd), elicits antitumor effect via TP53-induced glycolysis and apoptosis regulator (TIGAR) downregulation. Biochem Pharmacol 79: 1772–1780, 2010. [DOI] [PubMed] [Google Scholar]
- 28.Madan E, Gogna R, Kuppusamy P, Bhatt M, Pati U, Mahdi AA. TIGAR induces p53-mediated cell-cycle arrest by regulation of RB-E2F1 complex. Br J Cancer 107: 516–526, 2012. [DOI] [PMC free article] [PubMed] [Google Scholar]
- 29.Martin DR, Lewington AJ, Hammerman MR, Padanilam BJ. Inhibition of poly(ADP-ribose) polymerase attenuates ischemic renal injury in rats. Am J Physiol Regul Integr Comp Physiol 279: R1834–R1840, 2000. [DOI] [PubMed] [Google Scholar]
- 30.Mason J, Torhorst J, Welsch J. Role of the medullary perfusion defect in the pathogenesis of ischemic renal failure. Kidney Int 26: 283–293, 1984. [DOI] [PubMed] [Google Scholar]
- 31.Matoba S, Kang JG, Patino WD, Wragg A, Boehm M, Gavrilova O, Hurley PJ, Bunz F, Hwang PM. p53 regulates mitochondrial respiration. Science 312: 1650–1653, 2006. [DOI] [PubMed] [Google Scholar]
- 32.Megyesi J, Udvarhelyi N, Safirstein RL, Price PM. The p53-independent activation of transcription of p21 WAF1/CIP1/SDI1 after acute renal failure. Am J Physiol Renal Fluid Electrolyte Physiol 271: F1211–F1216, 1996. [DOI] [PubMed] [Google Scholar]
- 33.Molitoris BA, Dagher PC, Sandoval RM, Campos SB, Ashush H, Fridman E, Brafman A, Faerman A, Atkinson SJ, Thompson JD, Kalinski H, Skaliter R, Erlich S, Feinstein E. siRNA targeted to p53 attenuates ischemic and cisplatin-induced acute kidney injury. J Am Soc Nephrol 20: 1754–1764, 2009. [DOI] [PMC free article] [PubMed] [Google Scholar]
- 34.Molitoris BA, Sandoval R, Sutton TA. Endothelial injury and dysfunction in ischemic acute renal failure. Crit Care Med 30: S235–S240, 2002. [DOI] [PubMed] [Google Scholar]
- 35.Montes de Oca Luna R, Wagner DS, Lozano G. Rescue of early embryonic lethality in mdm2-deficient mice by deletion of p53. Nature 378: 203–206, 1995. [DOI] [PubMed] [Google Scholar]
- 36.Olof P, Hellberg A, Kallskog O, Wolgast M. Red cell trapping and postischemic renal blood flow. Differences between the cortex, outer and inner medulla. Kidney Int 40: 625–631, 1991. [DOI] [PubMed] [Google Scholar]
- 37.Padanilam BJ. Cell death induced by acute renal injury: a perspective on the contributions of apoptosis and necrosis. Am J Physiol Renal Physiol 284: F608–F627, 2003. [DOI] [PubMed] [Google Scholar]
- 38.Pieper AA, Verma A, Zhang J, Snyder SH. Poly (ADP-ribose) polymerase, nitric oxide and cell death. Trends Pharmacol Sci 20: 171–181, 1999. [DOI] [PubMed] [Google Scholar]
- 39.Purvis JE, Karhohs KW, Mock C, Batchelor E, Loewer A, Lahav G. p53 dynamics control cell fate. Science 336: 1440–1444, 2012. [DOI] [PMC free article] [PubMed] [Google Scholar]
- 40.Rider MH, Bertrand L, Vertommen D, Michels PA, Rousseau GG, Hue L. 6-Phosphofructo-2-kinase/fructose-2,6-bisphosphatase: head-to-head with a bifunctional enzyme that controls glycolysis. Biochem J 381: 561–579, 2004. [DOI] [PMC free article] [PubMed] [Google Scholar]
- 41.Ruegg CE, Mandel LJ. Bulk isolation of renal PCT and PST. I. Glucose-dependent metabolic differences. Am J Physiol Renal Fluid Electrolyte Physiol 259: F164–F175, 1990. [DOI] [PubMed] [Google Scholar]
- 42.Ruegg CE, Mandel LJ. Bulk isolation of renal PCT and PST. II. Differential responses to anoxia or hypoxia. Am J Physiol Renal Fluid Electrolyte Physiol 259: F176–F185, 1990. [DOI] [PubMed] [Google Scholar]
- 43.Singaravelu K, Devalaraja-Narashimha K, Lastovica B, Padanilam BJ. PERP, a p53 proapoptotic target, mediates apoptotic cell death in renal ischemia. Am J Physiol Renal Physiol 296: F847–F858, 2009. [DOI] [PubMed] [Google Scholar]
- 44.Singaravelu K, Padanilam BJ. p53 target Siva regulates apoptosis in ischemic kidneys. Am J Physiol Renal Physiol 300: F1130–F1141, 2011. [DOI] [PMC free article] [PubMed] [Google Scholar]
- 45.Sutton TA, Hato T, Mai E, Yoshimoto M, Kuehl S, Anderson M, Mang H, Plotkin Z, Chan RJ, Dagher PC. p53 is renoprotective after ischemic kidney injury by reducing inflammation. J Am Soc Nephrol 24: 113–124, 2013. [DOI] [PMC free article] [PubMed] [Google Scholar]
- 46.Sutton TA, Wilkinson J, Mang HE, Knipe NL, Plotkin Z, Hosein M, Zak K, Wittenborn J, Dagher PC. p53 regulates renal expression of HIF-1α and pVHL under physiological conditions and after ischemia-reperfusion injury. Am J Physiol Renal Physiol 295: F1666–F1677, 2008. [DOI] [PMC free article] [PubMed] [Google Scholar]
- 47.Venkatachalam MA, Bernard DB, Donohoe JF, Levinsky NG. Ischemic damage and repair in the rat proximal tubule: differences among the S1, S2, and S3 segments. Kidney Int 14: 31–49, 1978. [DOI] [PubMed] [Google Scholar]
- 48.Vousden KH, Prives C. Blinded by the light: the growing complexity of p53. Cell 137: 413–431, 2009. [DOI] [PubMed] [Google Scholar]
- 49.Wanka C, Steinbach JP, Rieger J. Tp53-induced glycolysis and apoptosis regulator (TIGAR) protects glioma cells from starvation-induced cell death by up-regulating respiration and improving cellular redox homeostasis. J Biol Chem 287: 33436–33446, 2012. [DOI] [PMC free article] [PubMed] [Google Scholar]
- 50.Wei Q, Dong G, Yang T, Megyesi J, Price PM, Dong Z. Activation and involvement of p53 in cisplatin-induced nephrotoxicity. Am J Physiol Renal Physiol 293: F1282–F1291, 2007. [DOI] [PMC free article] [PubMed] [Google Scholar]
- 51.Weinberg JM. The cell biology of ischemic renal injury. Kidney Int 39: 476–500, 1991. [DOI] [PubMed] [Google Scholar]
- 52.Yagil Y, Miyamoto M, Jamison RL. Inner medullary blood flow in postischemic acute renal failure in the rat. Am J Physiol Renal Fluid Electrolyte Physiol 256: F456–F461, 1989. [DOI] [PubMed] [Google Scholar]
- 53.Yamamoto K, Wilson DR, Baumal R. Outer medullary circulatory defect in ischemic acute renal failure. Am J Pathol 116: 253–261, 1984. [PMC free article] [PubMed] [Google Scholar]
- 54.Ye L, Zhao X, Lu J, Qian G, Zheng JC, Ge S. Knockdown of TIGAR by RNA interference induces apoptosis and autophagy in HepG2 hepatocellular carcinoma cells. Biochem Biophys Res Commun 437: 300–306, 2013. [DOI] [PubMed] [Google Scholar]
- 55.Yin L, Kufe T, Avigan D, Kufe D. Targeting MUC1-C is synergistic with bortezomib in downregulating TIGAR and inducing ROS-mediated myeloma cell death. Blood 123: 2997–3006, 2014. [DOI] [PMC free article] [PubMed] [Google Scholar]
- 56.Ying Y, Kim J, Westphal SN, Long KE, Padanilam BJ. Targeted deletion of p53 in the proximal tubule prevents ischemic renal injury. J Am Soc Nephrol 25: 2707–2716, 2014. [DOI] [PMC free article] [PubMed] [Google Scholar]
- 57.Zhang J, Dawson VL, Dawson TM, Snyder SH. Nitric oxide activation of poly(ADP-ribose) synthetase in neurotoxicity. Science 263: 687–689, 1994. [DOI] [PubMed] [Google Scholar]
- 58.Zheng J, Devalaraja-Narashimha K, Singaravelu K, Padanilam BJ. Poly(ADP-ribose) polymerase-1 gene ablation protects mice from ischemic renal injury. Am J Physiol Renal Physiol 288: F387–F398, 2005. [DOI] [PubMed] [Google Scholar]