Abstract
Background:
The chemical characterization is essential to validate the pharmaceutical use of vegetable raw materials. Ultraviolet spectroscopy is an important technique to determine flavonoids, which are important active compounds from Ocimum basilicum.
Objective:
The objective of this work was to optimize a spectrophotometric method, based on flavonoid-aluminum chloride (AlCl3) complexation to determine the total flavonoid content (TFC) in leaves of O. basilicum (herbal material), using response surface methodology.
Materials and Methods:
The effects of (1) the herbal material: Solvent ratio (0.02, 0.03, 0.05, 0.07, and 0.08 g/mL), (2) stock solution volume (0.8, 2.3, 4.4, 6.5, and 8.0 mL) and (3) AlCl3 volume (0.8, 1.0, 1.2, 1.4, and 1.6 mL) on the TFC were evaluated. The analytical performance parameters precision, linearity and robustness of the method were tested.
Results:
The herbal material: Solvent ratio and stock solution volume showed an important influence on the method response. After choosing the optimized conditions, the method exhibited a precision (RSD%) lower than 6% for repeatability (RSD%) and lower than 8% for intermediate precision (on the order of literature values for biotechnological methods), coefficient of correlation of 0.9984, and no important influence could be observed for variations of the time of complexation with AlCl3. However, the time and temperature of extraction were critical for TFC method and must be carefully controlled during the analysis.
Conclusion:
Thus, this study allowed the optimization of a simple, fast and precise method for the determination of the TFC in leaves of O. basilicum, which can be used to support the quality assessment of this herbal material.
Keywords: Flavonoids, Ocimum basilicum, response surface, spectrophotometry
INTRODUCTION
Ocimum basilicum L. (Lamiaceae), known in the traditional medicine as Manjericão and Basil,[1,2,3] has biologically active constituents associated with antiulcerogenic,[4] antibacterial, antifungal effects.[4,5,6,7] Flavonoids, including nevadensin, salvigenin, cirsileol, eupatorin, apigenin, acacetin, cirsimaritin, quercetin and ladanein, are among the main secondary metabolites identified in Basil,[8,9] besides the high essential oils content.[1,2,3,4,5,6]
The analysis of the content of main active components in raw materials and phytomedicines is an essential step to evaluate the quality of products and validate the efficacy and safety of their therapeutic use.[10] A widely used technique for the quantification of flavonoids is based on its complexation with aluminum chloride (AlCl3) and the spectrophotometric determination of the formed complex, which provides a bathochromic displacement and the hyperchromic effect. In this method, several factors are crucial for the formation of the flavonoid-AlCl3 complexes and must be optimized to improve the method performance such as the reaction time, the complexant concentration, flavonoid: Herbal material ratio and the chemical structure of the polyphenol. Thus, a multivariate approach can be used to evaluate the effect of the critical variables on the selected response. Experimental designs are multivariate tools used for the systematic and effective evaluation of simultaneous modifications of several variables in a specific system.[11]
Response surface methodology (RSM) is a set of mathematical and statistical techniques useful for designing experiments, building models and analyzing the effects of several independent factors. RSM comprises the evaluation of empirical models fitted to experimental data. The advantages of its application on the optimization of analytical procedures are widely disseminated, since the design of polynomial experiments allow testing, simultaneously, several factors with potential influence on the response, producing large amounts of information from a relatively small number of experiments.[12]
The objective of this work was to optimize a spectrophotometric method based on flavonoid-AlCl3 complexation to determine the total flavonoids content in leaves of O. basilicum, using RSM.
MATERIALS AND METHODS
Material
Plant material
The dried and ground leaves of O. basilicum L. of d90 ≤ 0.500 mm (herbal material) used in the experiments were obtained from specimens collected on August 2011, in Joinville, SC, Brazil. The voucher specimen deposited in the herbarium Joinvillea (number 8234) was taxonomically identified.
Chemicals and reagents
The standard of quercetin dehydrate (≥98% HPLC) was purchased from Sigma Co. (St. Louis, MO, USA). Absolute ethanol from Labmaster (Pinhais, PR, Brazil), methanol from Cromato Produtos Químicos (Diadema, SP, Brazil), AlCl3 hexahydrate from Nuclear (Diadema, SP, Brazil) pro analysis grade. Distilled water was prepared with distiller Quimis Q-341 (Diadema, SP, Brazil).
Instrumentation
Spectrophotometric measurements were performed on an ultraviolet (UV)-1601PC UV/visible (UV-Vis) spectrophotometer (Shimadzu, Kyoto, Japan) equipped with 1 cm quartz cells.
Methods
Wavelength selection
For the determination of the maximum absorption, the herbal material: 60% ethanol (v/v) extract (0.08 g/mL) was subjected to a general procedure for flavonoid quantification (sub-section General method for total flavonoids content [TFC] determination).[13] The UV-Vis spectra (300-500 nm) were obtained in a spectrophotometer after complexation with AlCl3 2% (w/v). The same sample without AlCl3 was used as a blank solution.
Optimizing the determination of the TFC
Conditions for the optimal TFC were determined by RSM, which was performed using the software Design-Expert® 8.0.6 from Stat-Ease, Inc. (Minneapolis, MN, USA). A central composite design (CCD) was used to investigate the effects of three independent variables, which are coded as (A) the herbal material: Ethanol ratio (w/v), (B) the volume of stock solution and (C) the AlCl3 volume, on the dependent variable (TFC in mg/g herbal material). The data obtained from the CCD was fitted to a second order polynomial equation. The generalized nonlinear computer-generated quadratic model is given as Equation 1.

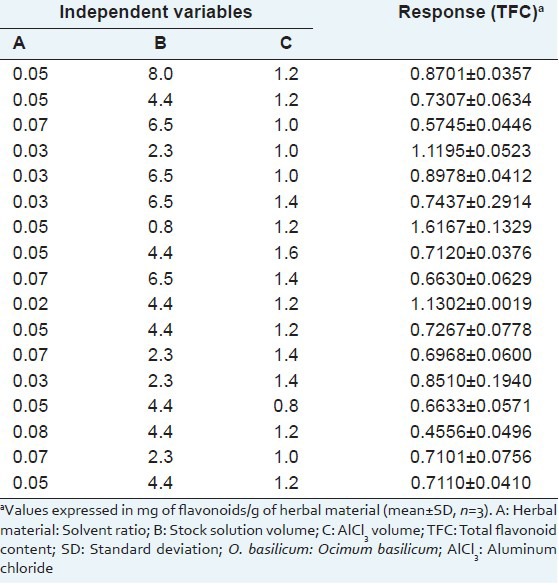
where, Y is the predicted response associated with each factor level combination; β0 is the intercept; βi is the linear coefficient; βii is the quadratic coefficient; βij is the interaction coefficient; and Xi and Xj are the coded levels of independent variables. The terms Xi Xj and Xi2 represent the interaction and quadratic terms, respectively. From preliminary experiments, the levels of the independent variables were selected: (A) 0.02, 0.03, 0.05, 0.07, and 0.08 g/mL; (B) 0.8, 2.3, 4.4, 6.5, and 8.0 mL; (C): 0.8, 1.0, 1.2, 1.4 and 1.6 mL. The experimental conditions for CCD and the TFC results are presented in Table 1. The experimental design required 17 experiments, including five replicates at the center point to estimate the overall error. The experiments were performed in random order to avoid systematic error. All trials were carried out in triplicate and the data were reported as means ± standard deviation (SD).
Table 1.
Randomization of the experimental design for the optimization of TFC in herbal material (leaves of O. basilicum) and the obtained results
The adequacy of the model was determined by evaluating the lack of fit, coefficient of regression (R2) and the Fisher test value (F-value) obtained from the analysis of variance (ANOVA) considering P < 0.05 as significant. The software uses the quadratic model equation shown above to generate response surfaces. Three-dimensional response surface plots were generated by keeping one response variable at its optimal level and plotting it against two factors (independent variables).
General method for total flavonoid content determination
The herbal material was extracted under reflux conditions (80 °C) with 20.0 mL water-ethanol solution 60% (v/v) (pH = 5.06) during 60 min. The extract was cooled to room temperature and filtered. The residue was re-extracted under equivalent conditions. Both hydroalcoholic extract and re-extract were combined, and the volume was completed to 50 mL of water-ethanol solution 60% (v/v), resulting in the stock solution.
An aliquot of the stock solution was transferred to a 10.0 mL volumetric flask and made to volume with methanol, resulting in the blank solution. A second aliquot of the stock solution was transferred to another 10.0 mL volumetric flask, a volume of the 2% AlCl3 was added and made to volume with methanol, which was named test solution. After 25 min the absorbance of the test solution was measured at 430 nm against blank solution.
TFCherbal material results were calculated, as quercetin, using Equation 2, and it represents the average of three-determinations. The results were expressed as the amount of flavonoid (mg)/g of herbal material (corrected for moisture content).

where TFCtestsolution is the total concentration of flavonoids in the test solution (mg/mL), 1.25 corresponds to the dilution factor, 50 is the volume of the stock solution (mL), w is the mass of herbal material (g), and ld is the loss on drying of herbal material.
Calibration curve and linearity
Standard solution of quercetin in methanol (0.050 mg/mL) was prepared in triplicate and diluted to concentrations of 0.001, 0.006, 0.011, 0.016, and 0.021 mg/mL. The absorbance of diluted solutions was measured at 430 nm 25 min after adding AlCl3 against the blank solution. The calibration curve was constructed by plotting the measurements of mean absorbance versus the concentration of the standard solutions. The results were analyzed by linear regression and the correlation coefficient (R2) was calculated GraphPad Prism 5.00 from GraphPad Software, Inc. (La Jolla, CA, USA). One-way ANOVA was calculated to compare the replicates of the calibration curve.
Precision
The intra-day and inter-day variabilities were studied to assess the precision of the method. Intra-day variability was determined by analyzing within 24 h. TFC was measured 6 times under the optimized method conditions and the relative standard deviation (RSD%) was considered a measure of repeatability. Inter-day variability was determined by performing the analysis in sextuplicate by two analysts in four different days (analyst A performed the analysis in days 1, 2, and 3, while analyst B performed the analysis in day 4), the RSD% being considered a measure of intermediate precision.
Robustness
Robustness was evaluated by the variation of the following conditions of the TFC method: Time of complexation with AlCl3 solution (15 and 35 min), time of extraction of herbal material (50 and 70 min) and temperature of extraction (70 °C and 90 °C). The results were evaluated by two-way ANOVA followed by Bonferroni post-hoc test, with a confidence level of 95% (GraphPad Prism® 5.00).
RESULTS AND DISCUSSION
Wavelength selection
The UV-spectra for herbal material and standard quercetin after reaction with AlCl3 are presented in Figure 1. Both UV-profiles observed for the tested samples presented a maximum at 430 nm, defining this wavelength for the TFC analysis.
Figure 1.
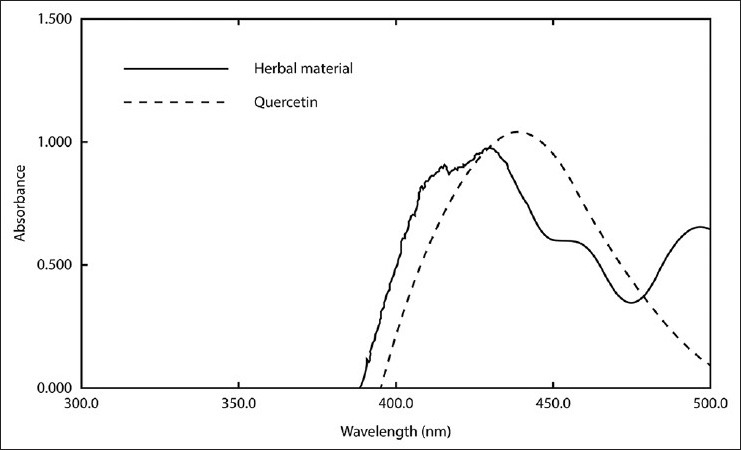
Spectrum for aluminum chloride-flavonoid complexes: Herbal material (leaves of Ocimum basilicum) and standard (quercetin)
Optimizing the determination of the total flavonoid content
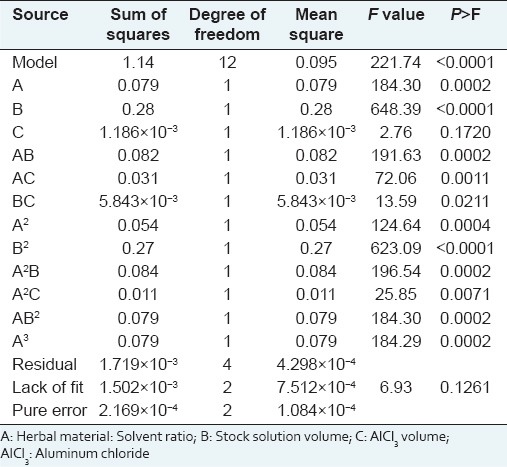
Table 1 shows the experimental design employed and the corresponding TFC results. Figure 2 illustrates response surface plots showing the effect of herbal material: 60% ethanol ratio and volume of stock solution on TFC response. The results of ANOVA for TFC with corresponding coefficients of multiple determination (R2) for leaves of O. basilicum are shown in Table 2. The model was adequate and explained most of the observed variability. For the model fitted, the software generates model coefficients, R2-values, F-values and significant probabilities and hence one can justify the significance of each experimental variable. The maximum predictable response for TFC was obtained based on a total of 17 experiments required for determining 12 regression coefficients of the model [Table 2]. A plot of experimental and theoretical values indicated an excellent fit of the model (F = 6.93; P = 0.126; R2 = 0.9985).
Figure 2.
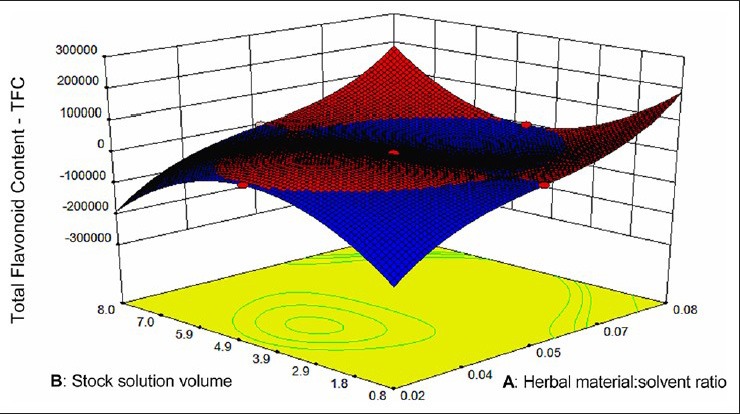
Response surface (three-dimension) showing the effect of factors (high aluminum chloride volume as fixed factor; (a) Herbal material: Solvent ratio; (b) Stock solution volume) added on TCF
Table 2.
Analysis of variance for response surface of reduced quadratic model
The data listed in Table 1 were converted into a second-order polynomial equation with three independent variables. Consequently, the polynomial models describing the correlation between the response (TFC) and the variables were presented as follows:

where A, B and C denoted the herbal material: 60% ethanol ratio (w/v), the volume of stock solution and the AlCl3 volume, respectively. The values of adjusted R2( 0.9940), a measurement for fitness of the regressed model (Equation 3), indicate a high degree of correlation between observed and predicted values. The analysis of variance (ANOVA) of the regression model was performed to determine the significance. The F = 221.74 implies that the model is highly significant (P < 0.0001), that is, there is a chance of only 0.01% of the model occur due to noise, as can be seen in Table 2. A lack of fit was not significant (P > 0.05) showing that the reduced quadratic model is valid for the spatial influence of variables on the response. The linear and quadratic terms of the herbal material: 60% ethanol ratio and the volume of stock solution, the cubic term of herbal material: 60% ethanol ratio, the linear interactions between these terms and between them and the AlCl3 volume, the interactions between the square of the herbal material: 60% ethanol ratio and the other two factors, the interaction of the square of the volume of stock solution and the herbal material: 60% ethanol ratio had statistically significant effects on TFC (P < 0.05).
The model (Equation 3) clearly demonstrates that A and B have negative effects on TFC, while C has a positive effect on it. The absolute value for the coefficient of A is much greater than those of B and C. This indicates that the linear term influence of A is more significant than those of B and C. The response surface of the TFC model indicates that the lower the herbal material: 60% ethanol ratio (0.02 g/mL or 1:66), the higher the content of flavonoids, independent of the AlCl3 volume, when intermediate levels of stock solution are used. These results indicate that the herbal material: Solvent ratio has a negative influence on TFC. The use of extreme volumes (0.8 or 8.0 mL) of the stock solution implies in higher TFC when herbal material: 60% ethanol ratio is higher (0.08 g/mL).
Based on the preceding analysis, and considering that higher herbal material: 60% ethanol ratio provides more precise results, the optimized conditions for the TFC method were: An herbal material: 60% ethanol ratio of 0.08 g/mL, 8.0 mL of stock solution and 1.6 mL of AlCl3 solution.
Calibration curve and linearity
Calibration solutions were prepared in triplicate and analyzed under the optimal conditions as described above. The one-way ANOVA calculated to compare the replicates of the calibration curve showed no significant difference between groups (F = 0.00007, P > 0.99). The calibration curve was found to be linear in the range 0.001-0.021 mg/mL for quercetin dihydrate (C15H10O7) [Figure 3]. The regression equation (y = 80.79 × – 0.0734) and correlation coefficient of 0.9984 revealed a good linearity response for the method developed, since according to the literature a coefficient of determination for standard curves >0.99 indicates that the calculated line could explain more than 99% of the experimental data.[11]
Figure 3.
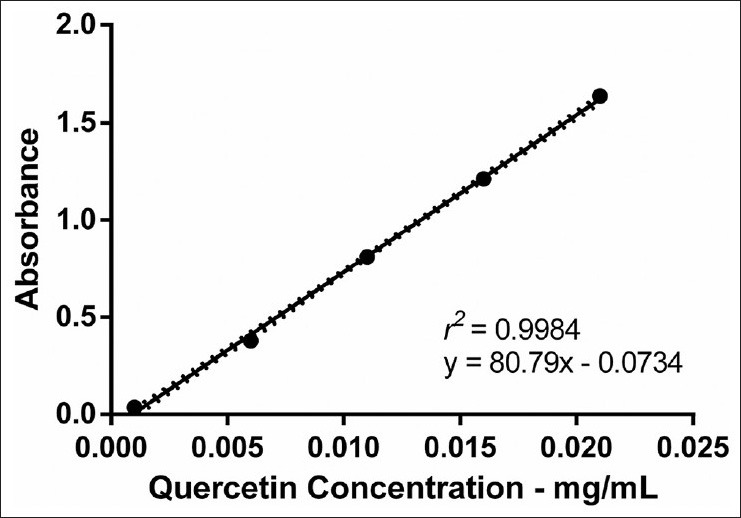
Calibration curve for standard quercetin- aluminum chloride complex spectrophotometrically assayed at 430 nm
Precision
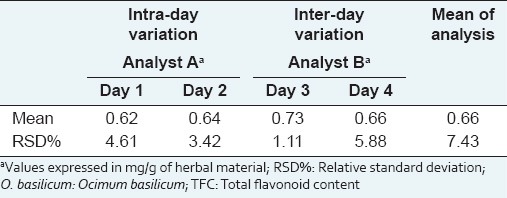
Due to their complex nature, analytical procedures for biological and biotechnological products can present a higher inherent variation. The results of repeatability (intra-day variation) and intermediary precision (inter-day variation) showed RSD% values below 6% and below 8%, respectively [Table 3]. For intermediary precision, no statistical difference was detected when the same analyst evaluated the method on different days and when different analysts performed it on different days (P < 0.05). Replicates of all performed analysis included the extraction, complexation and quantification steps. Although this approach increases the sources of variation, it allows evaluating the influence of all involved steps on the precision of the method. Therefore, our data indicate an acceptable precision and they are in accordance with those found in other works for samples of the same nature.[14,15]
Table 3.
Repeatability and intermediate precision of the TFC method for leaves of O. basilicum (herbal material)
Robustness
Results of TFC obtained under variation of analytical conditions of the method for robustness evaluation are presented in the Table 4. The analysis by two-way ANOVA revealed that the response (TFC) was not affected by any significant interference when small changes were inserted in the time of complexation with AlCl3 (P > 0.05). However, the statistical analysis points out that variations in the time or temperature of extraction influence the TFC results (P < 0.05) [Figure 4]. These results show that the time and the temperature of extraction are critical for the TFC method and should be carefully controlled during the analysis.
Table 4.
TFC obtained under variations of the analytical conditions of the method for robustness evaluation

Figure 4.
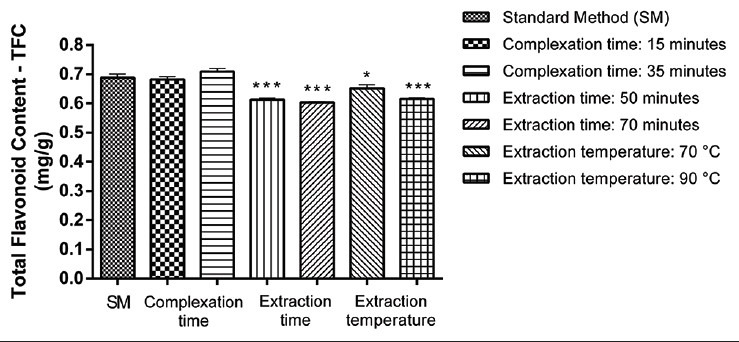
Robustness evaluation of the total flavonoid content (TFC) obtained under variations of analytical conditions. *P < 0.05 and ***P < 0.001 compared with the TFC obtained under general method conditions
CONCLUSION
This study allowed the optimization of a simple, fast and precise method for the determination of the TFC in leaves of O. basilicum, which can be used to support the quality assessment of this herbal material.
ACKNOWLEDGMENTS
The authors wish to acknowledge the Research Support Fund-FAP/UNIVILLE, and the trainees of the Laboratory of Pharmacognosy of UNIVILLE.
Footnotes
Source of Support: Nil
Conflict of Interest: None declared.
REFERENCES
- 1.Grayer RJ, Kite GC, Goldstone FJ, Bryan SE, Paton A, Putievsky E. Infraspecific taxonomy and essential oil chemotypes in sweet basil, Ocimum basilicum. Phytochemistry. 1996;43:1033–9. doi: 10.1016/s0031-9422(96)00429-3. [DOI] [PubMed] [Google Scholar]
- 2.Nacar S, Tansi S. Chemical components of different basil (Ocimum basilicum L.) cultivars grown in Mediterranean regions in Turkey. Isr J Plant Sci. 2000;48:109–12. [Google Scholar]
- 3.Deschamps C, Simon J. Agrobacterium tumefaciens-mediated transformation of Ocimum basilicum and O. citriodorum. Plant Cell Rep. 2002;21:359–64. [Google Scholar]
- 4.Bilal A, Jahan N, Ahmed A, Bilal SN, Habib S, Hajra S. Phytochemical and pharmacological studies on Ocimum basilicum Linn-A review. Int J Curr Res Rev. 2012;4:73–83. [Google Scholar]
- 5.Opalchenova G, Obreshkova D. Comparative studies on the activity of basil – an essential oil from Ocimum basilicum L. – against multidrug resistant clinical isolates of the genera Staphylococcus, Enterococcus and Pseudomonas by using different test methods. J Microbiol Methods. 2003;54:105–10. doi: 10.1016/s0167-7012(03)00012-5. [DOI] [PubMed] [Google Scholar]
- 6.Hussain AI, Anwar F, Sherazi ST, Przybylski R. Chemical composition, antioxidant and antimicrobial activities of basil (Ocimum basilicum) essential oils depends on seasonal variations. Food Chem. 2008;108:986–95. doi: 10.1016/j.foodchem.2007.12.010. [DOI] [PubMed] [Google Scholar]
- 7.Zhang JW, Li SK, Wu WJ. The main chemical composition and in vitro antifungal activity of the essential oils of Ocimum basilicum Linn. var. pilosum (Willd.) Benth. Molecules. 2009;14:273–8. doi: 10.3390/molecules14010273. [DOI] [PMC free article] [PubMed] [Google Scholar]
- 8.Lee J, Scagel CF. Chicoric acid found in basil (Ocimum basilicum L.) leaves. Food Chem. 2009;115:650–6. [Google Scholar]
- 9.Grayer RJ, Bryan SE, Veitch NC, Goldstone FJ, Paton A, Wollenweber E. External flavones in sweet basil, Ocimum basilicum, and related taxa. Phytochemistry. 1996;43:1041–7. doi: 10.1016/s0031-9422(96)00429-3. [DOI] [PubMed] [Google Scholar]
- 10.Bara MT, Ribeiro PA, Arantes MC, Amorim L, Paula JR. Determination of active principles in vegetable raw materials. J Pharmacogn. 2006;16:211–5. [Google Scholar]
- 11.Fernandes AJ, Ferreira MR, Randau KP, de Souza TP, Soares LA. Total flavonoids content in the raw material and aqueous extractives from Bauhinia monandra kurz (Caesalpiniaceae) Scientific World J. 2012:923462. doi: 10.1100/2012/923462. [DOI] [PMC free article] [PubMed] [Google Scholar]
- 12.Bezerra MA, Santelli RE, Oliveira EP, Villar LS, Escaleira LA. Response surface methodology (RSM) as a tool for optimization in analytical chemistry. Talanta. 2008;76:965–77. doi: 10.1016/j.talanta.2008.05.019. [DOI] [PubMed] [Google Scholar]
- 13.Paris: Ministère de la Santé; 1992. France. Pharmacopée Française. [Google Scholar]
- 14.Butnariu M, Coradini CZ. Evaluation of biologically active compounds from Calendula officinalis flowers using spectrophotometry. Chem Cent J. 2012;6:35. doi: 10.1186/1752-153X-6-35. [DOI] [PMC free article] [PubMed] [Google Scholar]
- 15.Motilva MJ, Macià A, Romero MP, Labrador A, Domínguez A, Peiró L. Optimisation and validation of analytical methods for the simultaneous extraction of antioxidants: Application to the analysis of tomato sauces. Food Chem. 2014;163:234–43. doi: 10.1016/j.foodchem.2014.04.096. [DOI] [PubMed] [Google Scholar]


