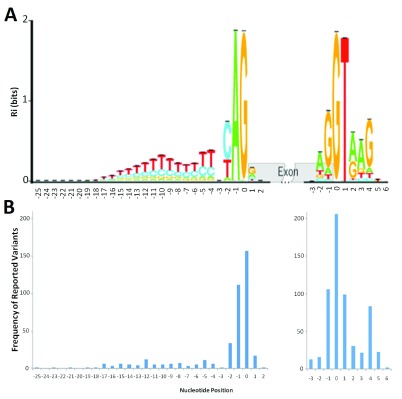
Figure 1. Distribution of deleterious natural site variants relative to information content.

A) The sequence logo for human acceptor and donor splice sites based on the positive (+) strand of the October 2000 (hg5) genome draft. The logo shows the distribution of information contents ( R i in bits) at each position over the region of 28 nucleotides for acceptor [-25, +2] and 10 nucleotides for donor [-3, +6] from the first nucleotide of the splice junction (position 0). Nucleotide height represents its frequency at that position. The horizontal bar atop each stack indicates the standard deviation at that position. This figure was modified from Rogan et al. (2003) to include splice sites in genes on both strands of the annotated human reference genome 30. B) The distribution of deleterious single-nucleotide variants reported at the natural acceptor (left) and donor (right) splice sites. The variants used to populate this graph ( Supplementary Table 8) were included only if they were reported to negatively affect splicing (N = 419 for acceptors, 599 for donors). The image was aligned to the sequence logo ( A) to illustrate potential correlation of number of splicing variants at a position to the information content at that position.
