Abstract
Background and Aims:
Pulmonary changes in patients with cystic fibrosis (CF) with CFTR I1234V mutation have not been extensively documented. Impact of geographic influence on phenotypical expression is largely unknown. This descriptive clinical study presents the high-resolution computed tomography (HRCT) pulmonary findings and computed tomography (CT) scoring with respect to pulmonary function tests (PFT) in a small subset of CF group.
Materials and Methods:
We examined 29 patients between 2 and 31 years of age with CFTR I1234V mutation. HRCT and PFT were performed within 2 weeks of each other. Imaging abnormalities on HRCT were documented and analyzed by utilizing the scoring system described by Bhalla et al., Brody et al., Helbich et al.,and Santamaria et al. Efficacy of the scoring system with respect to PFT was compared.
Statistical Analysis:
Inter-observer reliability of the scoring systems was tested using intraclass correlation (ICC) between the two observers. Spearman correlation coefficients were calculated between the scoring systems and between the scoring systems and PFT results.
Results:
In our study, right upper and middle lobes were the most frequently involved sites of involvement. Bronchiectasis and peribronchial thickening were the most frequent imaging findings. Scores with all four scoring systems were reproducible, with good ICC coefficient of 0.69. There was good agreement between senior radiologists in all scoring systems.
Conclusion:
We noted pulmonary imaging abnormalities in a large majority (96%) of our CF patients. There was no significant difference in the CT scores observed from various systems. The CT evaluation system by Broody is detailed and time consuming, and is ideal for research and academic setup. On the other hand, the systems by Bhalla and Santamaria are easy to use, quick, and equally informative. We found the scoring system by Santamaria preferable over that of Bhalla by virtue of additional points of evaluation and ease of use, and therefore better suited for busy clinical practice.
Keywords: CFTR I1234V mutation, cystic fibrosis, high-resolution computed tomography, HRCT, low-dose CT
Introduction
Cystic fibrosis (CF) is an autosomal recessive disorder resulting from mutations in a gene on the long arm of chromosome 7.[1] The gene product is the CF transmembrane conductance regulator (CFTR) which regulates and facilitates transport of electrolytes across the epithelial cells and other membranes. Epithelial cell ion transport abnormalities lead to a disease that starts early in life and leads to chronic, progressive pulmonary disease.[1,2] CFTR I 1234 mutation is one of the common mutations found in the Arabian Gulf region and is associated with pancreatic insufficiency.[3] Early manifestations include mucosal glandular hypertrophy, depletion of airway's surface fluid, and ineffective clearance of mucus. These changes further lead to airway obstruction, airway inflammation, infection, and regional air trapping. These findings initially appear on radiographs as areas of peribronchial thickening and linear shadows due to atelectasis, subsequently leading to bronchiectasis. Not long ago, pulmonary function tests (PFT) were considered the gold standard of lung disease in children aged > 6 years. However, since lung function in children is only indirectly related to lung structure, it is likely that high-resolution computed tomography (HRCT) is more sensitive than PFT in the detection of structural changes.[4] Published data[5,6,7,8,9] demonstrate that children with CF have structural abnormalities detectable by HRCT from an early age and that these abnormalities are progressive. The role of HRCT in assessment of these changes is well documented. There have been many methods in assessing and grading these changes. Since some of these changes are reversible, HRCT has a definite role in the follow-up examinations and assessing the response to therapy. The purpose of our study is to assess the extent and severity of lung disease in our group of patients and to assess the relative efficacy of scoring systems with PFT. We also had a close look at the beneficial aspect of low-dose HRCT protocol in view of reducing radiation burden.
Materials and Methods
This is a descriptive clinical study on patients who attended the CF clinic at our hospital over a period of approximately 2 years. The patients who satisfied the inclusion criteria underwent clinical examination, gene testing, PFT, and HRCT lung. The study was approved by the institutional review board.
The study population consisted of 29 patients with CFTR mutation I1234V. The CFTR gene was analyzed using established DNA techniques. All patients were homozygous for I1234V mutation of the CFTR gene and belonged to a specific Arab tribe.
All patients in this group had an initial clinical assessment and work-up for CF gene profile. The diagnosis of CF was confirmed on two sweat chloride values greater than 60 mEq/L, along with a typical history of pulmonary disease or a positive family history. The sweat test was performed using the Macroduct collection system (Wescor, Inc. Logan, Utah, USA) and advanced sweat chloride analyzer. We included all CF patients of both genders with CFTR I1234V mutation and no history of respiratory infections 6-8 weeks before HRCT and PFT were performed. We excluded all patients who had a HRCT examination within the last 2 years, in order to not repeat CT. Also, all CF patients with non CFTR I1234V mutation were excluded.
PFT were performed in children aged more than 6 years. Spirometric tests were performed in children aged more than 6 years in the respiratory laboratory unit in accordance with the standards of The American Thoracic Society (Guidelines for Assessing and Managing Asthma Risk at Work, School and Recreation).[10] Multi-detector CT (MDCT) imaging with 64-slice capability (Somatom AG; Siemens, Erlangen, Germany) was performed for the evaluation of patients with CF. Patients who had undergone CT examination in the last 2 years were excluded from the study.
Patients above the age of 5 years were not sedated and those below 5 years of age were administered appropriate medications for conscious sedation. Patients were examined in the supine position. Inspiratory scans of 1mm thickness were performed at 8mm intervals at end inspiration. Images were obtained using the following parameters: 100 kV and 0.6 sec scanning time with variable mA (40-60 mA) using “Care Dose” protocol (default protocol of Siemens AG, Germany). Respiratory control on sedated patients was achieved by controlled ventilation [bi-level positive airway pressure (BIPAP)] technique under the supervision of a respiratory therapist. An additional set of limited expiratory images was obtained at the level of aortic arch, at carina, at the inferior edge of the right hilum, and 2cm above the right diaphragm. Minimal field of view for the assessment of lung field was utilized. To assess radiation burden, CT dose index (CTDI) and dose length product (DLP) were measured and total radiation dose was calculated. Images were displayed and documented with window level of -600 HU and window widths of -1500 to +1500 HU.
Scoring system
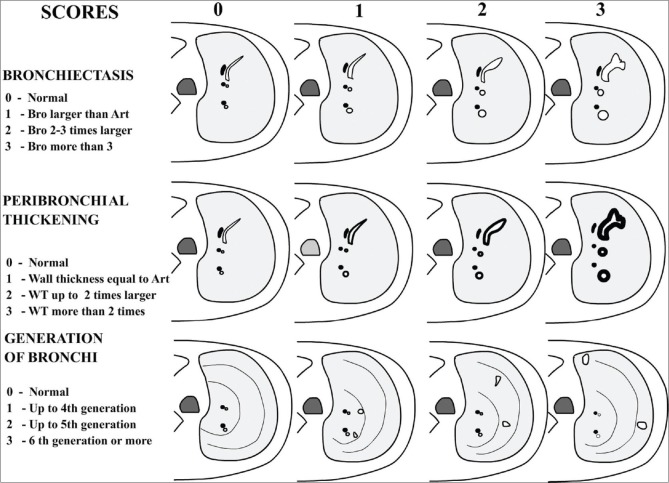
Since 1991, several chest HRCT scoring systems have been developed to monitor the extent and severity of CF.[2,3] The system originally described by Bhalla et al. has been modified by several authors.[4,11] Roles of various scoring systems have been critically reviewed.[12] The elements that were evaluated include bronchial airway observations (bronchiectasis, peribronchial thickening, mucus plugging, sacculation/abscess) and lung parenchymal observations (bullae, emphysema, collapse, consolidation, acinar nodules, septal thickening and/or air trapping) in a semi-quantitative manner. Basis of scoring system was described by Bhalla et al., wherein scores from 0 to 3 were assigned for each bronchial and parenchymal abnormality. The score 0 indicated normal and 3 represented the most severe abnormality with intervening mild to moderate grades [Figure 1]. The components that were assessed included severity of bronchiectasis, peribronchial thickening, extent of bronchiectasis, sacculations and abscesses, generations of bronchial divisions involved, number of bullae, extent of emphysema, and presence of segmental or subsegmental collapse consolidations. Finally, a total severity score was derived out of the possible maximum, which was 25 in Bhalla system. Other scoring systems differed from Bhalla system either by inclusion of additional assessment criteria (like inclusion of ground-glass opacities in Santamaria system) or complex method of calculation of the extent at different lung zones/segments and inclusion of weighting factors as per the Broody system. Expectedly, each system had variable maximal points.
Figure 1.
Basis of CT scoring for important criteria, diagrammatic representation (modified from Bhalla system)
We scored the lung changes utilizing the four scoring systems described by Bhalla et al.,[11] Allan Brody et al.,[4] Helbich et al.,[13] and Santamaria et al.[14] The maximal scores are 100, 27, 29 and 25 for Broody, Helbich, Santamaria, and Bhalla systems, respectively. Validity of the scoring systems is well established in clinical studies.[6]
In an extensive analysis by de Jong et al., all the above four HRCT scoring systems were reviewed[6,15] and found to be reproducible with interclass correlation coefficients greater than or equal to 0.74 and inter-reader correlation coefficients greater than or equal to 0.74. All scoring systems also significantly correlated with percent-predicted forced expiratory volume at 1 min (FEV1) and forced expiratory volume range between 25-75% (FEV25-75%,) as well as measured the bronchial-arterial diameter.
Statistical methods
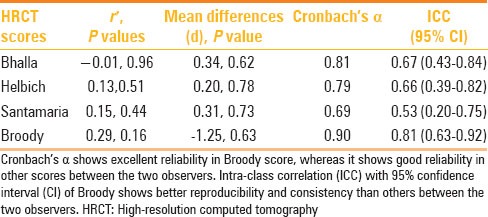
Descriptive statistics were performed in the form of percentages. Correlation coefficients were calculated between the scoring systems and PFT results. Inter-observer reliability of the scoring systems was tested with the intraclass correlation (ICC) coefficient (Ri). Values of Ri greater than 0.80 are generally considered to represent a good agreement between observers. Paired t tests were used to find statistical significance between the two observers and mean differences, and P values along with correlation coefficient (r′) of averages and differences of scores were calculated between the two observers to further strengthen the agreement. Cronbach's alpha was used to check the score reliability of the two observers. P value ≤ 0.05 (two tailed) was considered statistically significant. Statistical software package (SPSS, version 10.0; SPSS, Chicago, IL, USA) was used for statistical analysis.
Results
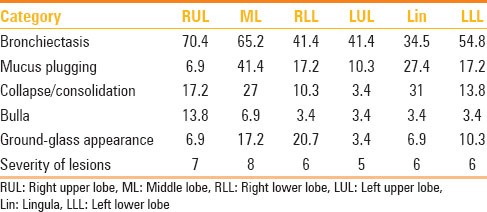
We examined 29 patients aged between 2 and 31 years with the mean age of the group being 14.2 years. There was slight male preponderance (17 males, 12 females). All patients underwent HRCT lung examination according to the set protocol. PFT results were available in 28 patients; hence, CT and PFT correlation was possible in this group. HRCT imaging provided structural data for the evaluation of phenotypical expression of pulmonary changes. HRCT examinations were interpreted independently by two experienced radiologists. Radiologist 1 (VB), with 30 yrs of mostly pediatric imaging background; Radiologst 2 (KG) with 32 yrs experience with adult chest imaging team. The most frequent observation in our patients was peribronchial thickening (79%), followed by bronchiectasis (72%) [Figure 2], mucus plugging, and presence of acinar nodules (62% and 55%, respectively). The frequency of lesions was highest in the right upper lobe, followed by the right middle lobe and the left lower lobe [Table 1]. Other observations like air trapping, collapse, consolidation, and ground-glass opacification were also frequent [Figure 3] and comparable to the observations of many series.[6]
Figure 2(A-D).
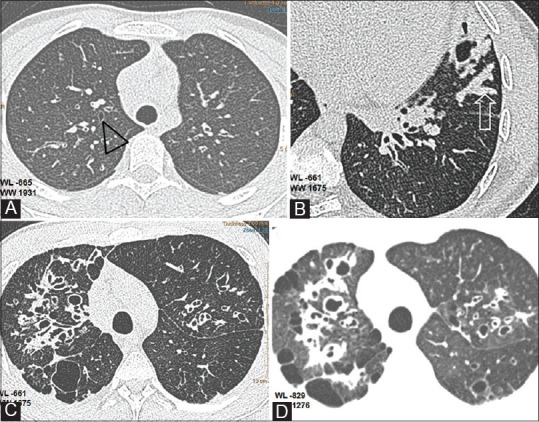
Bronchiectasis and related findings. (A) Axial CT shows early bronchiectatic changes in right upper lobe bronchus (black triangle) (B)Mucus plug in lingular subsegment (open arrow) (C) Extensive bronchiectasis in right upper lobe with saccular cavities posteriorly (D) Thin section with soft algorithm (WL -829, WW 1276),reveals pulmonary aeration and bullous changes in the upper lobes with greater detail
Table 1.
Prevalence of categories of lung changes in our patients with CF
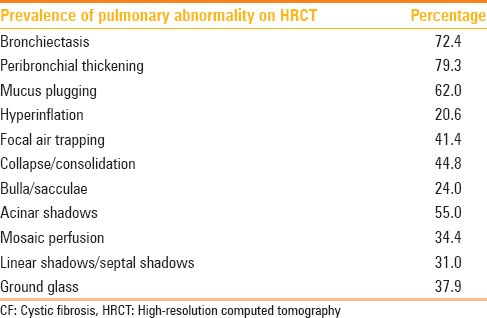
Figure 3(A-D).
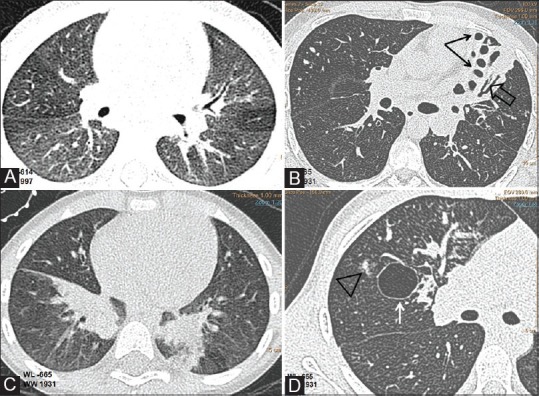
CF lung changes. Axial CT images(WL-665,WW 1931) showing (A) uneven lung aeration(B)cystic(black arrows) and cylindrical bronchiectasis(open arrow), lung collapse(C) lower lobe subsegmental atelectasis and (D) acino-nodular(triangle) and bulbous lung changes(arrow)
Incidence of various findings and distribution of structural lesions with respect to various lobes are shown in Tables 1 and 2.
Table 2.
Distribution of lesions in lobes
Clinical respiratory disability was objectively assessed in respiratory laboratory by PFT. Pulmonary functional reserve was effectively measured by spiromeric evaluation of lung function. FEV1 correlated well with pulmonary function. The relation between results of spirometry and HRCT scoring was assessed with statistical methods [Graph 1a–d]. FEV1 and FEV25-75% values (which linearly reflect the extent of pulmonary disability) and the CT scores of all systems showed good correlation. Additional assessment of total score versus severity of forced vital capacity (FVC) and FEV1/FVC was also performed. Patients were categorized into four groups based on the functional capacity as reflected by FEV1values:
Graph 1.
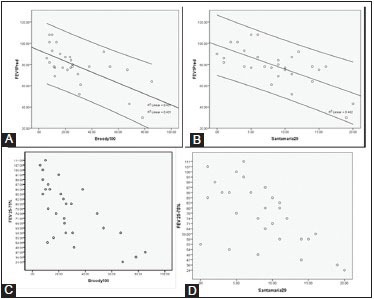
Scattergraph showing linear relation of diminishing FEV1 with increasing CT score [Broody (A) and Santamaria (B)]. Similar relation is also noted with FEV25-75% (C and D)
Normal FEV1values (FEV1 expected values for the age)
Mild reduction: FEV1 between 85% and 65% of the expected value
Moderate reduction: FEV1 between 50%and 65% of the expected value
Severe reduction: FEV1 values below 50% of the expected value.
CT grading of these groups was compared. Patients belonging to the normal group (10 patients) had a CT mean score of 16.3. Mildly affected patients (total 14) had a CT score of 26.4 [Figure 4]. Moderately affected patients (four patients) had CT mean score of 49.1. Two severely affected patients had a mean CT score of 65.8 [Figure 5]. Thus, an inverse linear relationship between CT scores and the level of pulmonary function was observed. Amongst the various parameters of PFT, a more linear correlation was observed with FEV25-75% values, although there was no statistically significant difference between the CT scoring correlations with FEV1 or FEV25-75% [Graph 1].
Figure 4.
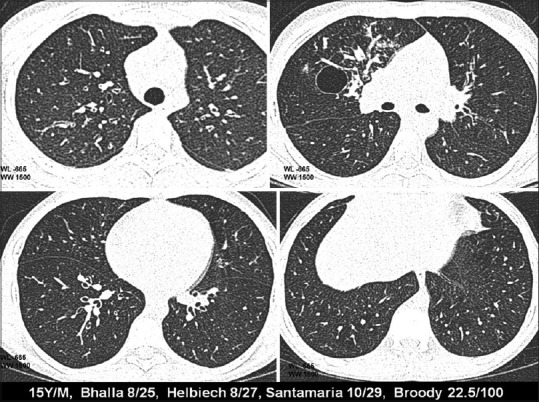
HRCT changes at different levels in relation to CF scores (mild disease)
Figure 5.
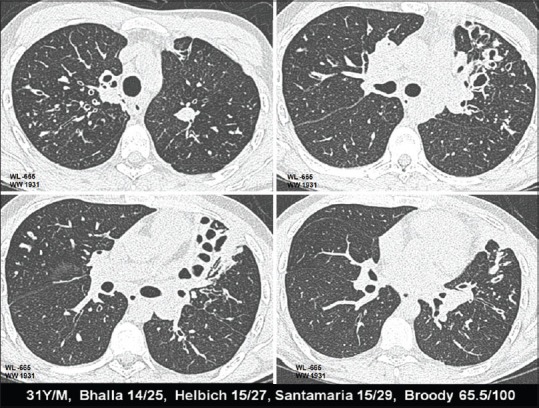
HRCT changes at different levels in relation to CF scores (severe disease)
CT scoring systems fared well and showed comparable results without significant inter-system variability. The chart in Table 3 provides a glimpse of the comparison among the various scoring systems in our patients. Regarding the inter-observer differences in detection of HRCT observations and scoring, Cronbach's alpha showed excellent reliability in Broody score, indicating consistent, good inter-observer correlation. There was good reliability with other scores between the two observers as well [Table 4].
Table 3.
Correlation of HRCT scoring system with PFT levels
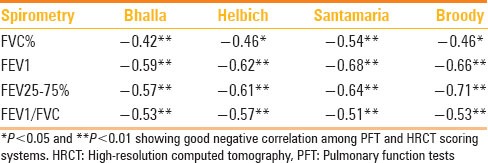
Table 4.
Agreement between observers 1 and 2
Discussion
Pulmonary changes in patients with CF are non-specific in nature and are easily appreciable in HRCT. Essential observations include a wide spectrum of abnormalities ranging from normal appearances to bronchiectasis, peribronchial thickening, sacculations, mucus plugging, air trapping, acinar shadowing, atelectasis, consolidation, etc., Scoring systems have become inevitable for a better quantitation of lung changes and to bring objectivity in patient follow-up. Therapeutic options for CF lung disease are developing rapidly, hence the necessity for an outcome measure that can be applied in clinical intervention trials.[16]
In their observation after extensive study, Broody et al. commented on the future of CF scoring “Thus the study of de Jong and colleagues completes an important step in the journey that will lead to the use of CT as an outcome surrogate for lung disease in CF. Completion of this journey should result in provision of a valuable new tool that will help improve the care that patients with CF receive. While the use of CT in CF is currently being evaluated as a research tool, the application of CT as a tool for clinical care is an exciting opportunity that will need to be addressed in order to develop useful recommendations.”
The authors go one step further in suggesting a new concept of imaging biomarkers, which might open a concept to include the imaging observations in clinical follow-up protocols.[17]
The evaluation of the severity of CF has many components. Each component has a weighting factor in the evaluation of severity. Previous observers[16] have demonstrated that clinical symptoms do not correlate linearly with CT scoring. It is also well documented in previous literature that CT scoring indicated disease progression even in the absence of clinical symptomatic progression and with stable PFT results.[15]
Severity of the pulmonary disease on CT in patients with CF can be attributed to three different components:(1) findings related to chronic parenchymal damage (bronchiectasis, bullous changes, emphysema);(2) findings related to secondary inflammation; and (3) findings related to transient or persistent air trapping. There appears to be some overlap in all the three components of the disease when CT evaluation is attempted. Some of the observed variations in CT scoring across different studies appear to be complicated by a combination of various components of the parenchymal changes.
CT technique for the evaluation of CF is well documented.[3,4,17] State-of-art MDCT scanners allow for the diagnosis and monitoring of CF lung disease at substantially lower radiation doses than with earlier scanners. Evolution of CT scanning technology presently permits acquisition of volumetric datasets in 1-2 sec, allowing three-dimensional reconstruction of the lungs and airways. There are two types of CT scanning protocols currently used to assess CF lung disease. In one technique, high-resolution thin-section pulmonary imaging with 0.5-1.5mm slice is obtained from lung apex to base with 0.5, 1, or 2 cm in the inspiratory phase. Subsequently, spaced HRCT sections are obtained for expiratory scans. In the other technique, complete spiral volume CT imaging covers the entire lung for inspiratory and expiratory scanning. These scanning protocols allow scoring of CF lung disease and provide CT datasets to quantify airway and airtrapping measurements. Qualitative assessment by sectional method is still used by and large. Quantitative methods by volume scan have not been extensively studied.[18] Essential components included in CF CT scoring systems are bronchiectasis, bronchial wall thickening, mucus plugging, and atelectasis/consolidation, assessed from inspiratory scans. Air trapping is evaluated best on expiratory imaging. Recently, CT algorithms have been developed for both HRCT and complete spiral CT imaging to quantify several airway indices, determine the volume and density of the lung, and to assess regional and global air trapping. CT scans are currently acquired by either controlled-volume scanning techniques (controlled ventilation infant CT scanning or spirometer-controlled CT scanning in children and adults) or by voluntary breath-holding at full inflation and deflation.[17]
Elements of scoring system, such as bronchiectasis, peribronchial thickening, and sacculations, reflect structural, often irreversible, damage to the lungs. These findings gradually progress despite adequate therapy. Hence, the scoring systems for CF based on these parameters will show slow resolution or continue to demonstrate progress. Other components of the CT scoring systems reflect more dynamic changes like air trapping due to small airway narrowing or secondary inflammatory changes. Often these changes can vary depending on the patient's clinical status. Also, an improvement in CT scores over a short duration could reflect a decrease in the amount of airway narrowing or response of the inflammatory component to antibiotic therapy. In order to increase the accuracy of CT scoring methods, it is possible to split the three components as independent scoring parameters. Morphologic score would be more appropriate in patients with good clinical control and will also reflect long-term silent progression. Avoiding CT scoring during the acute inflammatory phase will address part of the inaccuracy of a scoring system. Also, a rapid improvement in CT score assessment could be attributed to alleviation of bronchospasm or inflammation.
In our observations of the four scoring systems of Bhalla, Santamaria, Helbich, and Broody, we noted no significant difference in the CT scores. The later CT evaluation systems by Broody and Santamaria have additional points of assessment relating to small airway narrowing and inflammation. Hence, an overall improvement is noted in the consistency of CT scoring in these systems. We have, like in the previous studies, noted that the scoring system of Broody has more inter-observer reliability and has internal consistency. However, the system is relatively complex and takes a longer time for a complete assessment. The systems of Bhalla and Santamaria appear to be fast, reasonably accurate, and simple. Bhalla system does have slight statistical advantage; however, Santamaria system includes more clinically important observations related to small airway. Since the value of clinical information has to be weighed against the marginal statistical advantage, we prefer a more versatile and equally simple system of assessment (Santamaria) for routine use in a busy department.
Best correlates for CT scores were observed with PFT (FEV25-75%). Although FEV1 is the gold standard for clinical evaluation of a patient with CF for assessment of pulmonary function, there appears to be better correlation with a range of values between FEF25-75%.
Radiation dose is a significant concern when multiple follow-up examinations are required. It has been observed that increasing the spacing of CT section is not the best method, especially if new forms of therapy are evaluated with CT scoring.[16] Lucaya et al. showed that the radiation dose of a conventional HRCT scan performed at 120 kVp and 180 mA was nearly 4 times higher than that of a similar examination using 50 mA.[19] In our examinations, the average CTDI was 1.57 (0.79-2.3) with 80-100 kV and average mA of 34 (17-59). Hence, dose reduction benefits are close to or better than the estimations of Lucaya et al. We did not use protocols of CT based on weight. Additional methods, which can significantly reduce radiation dose, are currently available with modern scanners. Body CTDI reductions of 32-65% were achieved when adaptive statistical iterative reconstruction was used, without a significant compromise in image quality.[20]
Pulmonary evaluation by HRCT in patients of CF goes much beyond demonstration of structural changes. Since HRCT changes are considered as a surrogate marker of disease progression and evaluation of therapy response, quantification of pulmonary changes by a scoring system becomes essential. In conclusion, we have assessed our group of CF patients with I1234V mutation of the CFTR gene for pulmonary changes using low-dose HRCT and we have correlated the HRCT findings with PFT. A large majority of our patients showed some imaging manifestations of the disease (96%). Predominant observations noted in descending order of frequency were bronchiectasis and peribronchial thickening, distributed over the right upper lobe (RUL), middle lobe (ML), and left lower lobe (LLL), respectively. Scoring systems evaluated by us (Bhalla, Broody, Helbich, and Santamaria) showed good inter-system and inter-observer correlations. Despite the high inter-observer correlation and internal consistency of Broody, we found the scoring system of Santamaria to be more practical to use in our clinical practice. Our preference for the system is based on its simplicity of use in a busy department and good correlation with PFT. Additionally, our low-dose HRCT protocols allowed us to keep the radiation dose in check.
Acknowledgements
Authors would like to sincerely acknowledge the immense contribution of Mrs. Liwayway M. Navarro, CT Supervisor at HMC for her dedicated work in imaging our patients. Our acknowledgement also goes to Dr. Varun Bhat, Research Fellow at Narayana Hospital, Bengaluru for his constructive suggestions, proof reading and editing this work.
Footnotes
Source of Support: Nil
Conflict of Interest: None declared.
References
- 1.Stern M, Geddes D. Cystic fibrosis: Basic chemical and cellular mechanisms. Br JHosp Med. 1996;55:237–40. [PubMed] [Google Scholar]
- 2.Robinson TE. High-resolution CT scanning: Potential outcome measure. CurrOpinPulm Med. 2004;10:537–41. doi: 10.1097/01.mcp.0000142924.38801.45. [DOI] [PubMed] [Google Scholar]
- 3.Abdul Wahab A, AlThani G, Dawod ST, Kambouris M, Al Hamed M. Heterogeneity of the cystic fibrosis phenotype in a large kindred family in Qatar withcystic fibrosis mutation (I1234V) J Trop Pediatr. 2001;47:110–2. doi: 10.1093/tropej/47.2.110. [DOI] [PubMed] [Google Scholar]
- 4.Brody AS, Molina PL, Klein JS, Rothman BS, Ramagopal M, Swartz DR. High-resolution computed tomographyof the chest in children with cystic fibrosis: Support for use as an outcome surrogate. PediatrRadiol. 1999;29:731–5. doi: 10.1007/s002470050684. [DOI] [PubMed] [Google Scholar]
- 5.Dakin CJ, Pereira JK, Henry RL, Wang H, Morton JR. Relationship between sputum inflammatory markers, lung function, and lung pathology on high-resolution computed tomography in children with cystic fibrosis. PediatrPulmonol. 2002;33:475–82. doi: 10.1002/ppul.10109. [DOI] [PubMed] [Google Scholar]
- 6.de Jong PA, Ottink MD, Robben SG, Lequin MH, Hop WC, Hendriks JJ, et al. Pulmonary disease assessment in cystic fibrosis: Comparison of CT scoring systems and value of bronchial and arterial dimension measurements. Radiology. 2004;231:434–9. doi: 10.1148/radiol.2312021393. [DOI] [PubMed] [Google Scholar]
- 7.Demirkazik FB, Ariyürek OM, Ozçelik U, Göçmen A, Hassanabad HK, Kiper N. High resolution CT in children with cystic fibrosis: Correlation with pulmonary functions and radiographic scores. Eur J Radiol. 2001;37:54–9. doi: 10.1016/s0720-048x(00)00236-9. [DOI] [PubMed] [Google Scholar]
- 8.Castile RG, Hays JR, Flucke RL, Long FR, McCoy KS. Correlation of structureal and functional abnormalities in the lungs of infants with cystic fibrosis. PediatrPulmonol. 2000;20:A427. [Google Scholar]
- 9.Koh DM, Hansell DM. Computed tomography of diffuse interstitial lung disease in children. ClinRadiol. 2000;55:659–67. doi: 10.1053/crad.2000.0490. [DOI] [PubMed] [Google Scholar]
- 10.American Thoracic Society. Guidelines for assessing and managing asthma risk at work, school, and recreation. AmJ RespirCrit Care Med. 2004;169:873–81. doi: 10.1164/rccm.169.7.873. [DOI] [PubMed] [Google Scholar]
- 11.Bhalla M, Turcios N, Aponte V, Jenkins M, Leitman BS, McCauley DI, et al. Cystic fibrosis: Scoring system with thin-section CT. Radiology. 1991;179:783–8. doi: 10.1148/radiology.179.3.2027992. [DOI] [PubMed] [Google Scholar]
- 12.Brody AS. Scoring systems for CT in cystic fibrosis: Who cares? Radiology. 2004;231:296–8. doi: 10.1148/radiol.2312032097. [DOI] [PubMed] [Google Scholar]
- 13.Helbich TH, Heinz-Peer G, Eichler I, Wunderbaldinger P, Götz M, Wojnarowski C, et al. Cystic fibrosis: CT assessment of lung involvement inchildren and adults. Radiology. 1999;213:537–44. doi: 10.1148/radiology.213.2.r99nv04537. [DOI] [PubMed] [Google Scholar]
- 14.Santamaria F, Grillo G, Guidi G, Rotondo A, Raia V, de Ritis G, et al. Cystic fibrosis: When should high-resolution computed tomography of the chest be obtained? Pediatrics. 1998;101:908–13. doi: 10.1542/peds.101.5.908. [DOI] [PubMed] [Google Scholar]
- 15.De Jong PA, Nakano Y, Lequin MH, Mayo JR, Woods R, Paré PD, et al. Progressive damage on high resolution computed tomography despite stable lung function in cystic fibrosis. EurRespir J. 2004;23:93–7. doi: 10.1183/09031936.03.00006603. [DOI] [PubMed] [Google Scholar]
- 16.Aziz ZA, Davies JC, Alton EW, Wells AU, Geddes DM, Hansell DM. Computed tomography and cystic fibrosis: Promises and problems. Thorax. 2007;62:181–6. doi: 10.1136/thx.2005.054379. [DOI] [PMC free article] [PubMed] [Google Scholar]
- 17.Robinson TE. Computed tomography scanning techniques for the evaluation of cystic fibrosis lung disease. Proc Am ThoracSoc. 2007;4:310–5. doi: 10.1513/pats.200612-184HT. [DOI] [PubMed] [Google Scholar]
- 18.Goris ML, Zhu HJ, Blankenberg F, Chan F, Robinson TE. An automated approach to quantitative air trapping measurements in mild cystic fibrosis. Chest. 2003;123:1655–63. doi: 10.1378/chest.123.5.1655. [DOI] [PubMed] [Google Scholar]
- 19.Lucaya J, Piqueras J, García-Peña P, Enríquez G, García-Macías M, Sotil J. Low-dose high-resolution CT of the chest in children and young adults: Dose, cooperation, artifact incidence, and image quality. AJR Am J Roentgenol. 2000;175:985–92. doi: 10.2214/ajr.175.4.1750985. [DOI] [PubMed] [Google Scholar]
- 20.Hara AK, Paden RG, Silva AC, Kujak JL, Lawder HJ, Pavlicek W. Iterative reconstruction technique for reducing body radiation dose at CT: Feasibility study. AJR Am J Roentgenol. 2009;193:764–71. doi: 10.2214/AJR.09.2397. [DOI] [PubMed] [Google Scholar]


