

Abstract
TRIM29 (ATDC) exhibits a contextual function in cancer, but appears to exert a tumor suppressor role in breast cancer. Here we show that TRIM29 is often silenced in primary breast tumors and cultured tumor cells as a result of aberrant gene hypermethylation. RNAi-mediated silencing of TRIM29 in breast tumor cells increased their motility, invasiveness, and proliferation in a manner associated with increased expression of mesenchymal markers (N-cadherin and vimentin), decreased expression of epithelial markers (E-cadherin and EpCAM), and increased expression and activity of the oncogenic transcription factor TWIST1, an important driver of the epithelial-mesenchymal transition (EMT). Functional investigations revealed an inverse relationship in the expression of TRIM29 and TWIST1, suggesting the existence of a negative regulatory feedback loop. In support of this relationship, we found that TWIST1 inhibited TRIM29 promoter activity through direct binding to a region containing a cluster of consensus E-box elements, arguing that TWIST1 transcriptionally represses TRIM29 expression. Analysis of a public breast cancer gene expression database indicated that reduced TRIM29 expression was associated with reduced relapse-free survival (RFS), increased tumor size, grade, and metastatic characteristics. Taken together, our results suggest that TRIM29 acts as a tumor suppressor in breast cancer through its ability to inhibit TWIST1 and suppress EMT.
INTRODUCTION
Currently, more than 70 members of the Tripartite Motif (TRIM) family (also referred to as RBCC) have been identified in humans and are typically classified due to the presence of a tripartite set of motifs including a RING domain, one or two B-box motifs and a coiled-coil region (1). In addition to these motifs, several family members contain additional protein-protein interaction domains such as BROMO, PHD, MATH and SPRY domains (2). The presence of multiple protein-protein interaction motifs is thought to provide TRIM family members with significant plasticity in interaction with various binding partners (3, 4). TRIM proteins have been implicated in a spectrum of biological roles such as control of innate immune response, cancer, and development (for review see 2, 5).
Examination of TRIM29 (aka ATDC) expression in various tumor types has found that increased expression of TRIM29 is associated with more aggressive forms of disease including bladder (6), colorectal (7), gastric (8), lung (9, 10), and pancreatic cancer (11). Further, several studies have shown an association between elevated TRIM29 expression and reduced patient survival (6, 8). In support of an oncogenic role for TRIM29, investigators found that overexpression of TRIM29 in pancreatic cancer lines promoted cell growth in vitro and metastatic activity in vivo stemming from stimulation of Wnt/β-Catenin/TCF signaling through TRIM29 binding to Dvl-2, a Wnt pathway activator downstream of the Frizzled receptor (12). Others documented that TRIM29 binds to p53 and inhibits its transcriptional activity (13).
Recently, Liu et al (14) observed that knockdown of TRIM29 in the non-tumorigenic MCF-10A line resulted in an increased growth rate and anchorage-independent growth, increased cell motility and invasiveness, and disrupted 3D acinar formation in vitro. In the MCF7 tumor line, which expresses low levels of TRIM29, expression of recombinant human TRIM29 had the opposite effect, namely, a slowing of growth and reduction in anchorage-independent growth. These findings led this group to conclude that TRIM29 functions in a growth suppressive role in MCF7 and MCF-10A cells, although the underlying mechanism(s) for this effect were not reported.
MATERIALS and METHODS
Cell Culture and Drug Treatment
All lines were obtained from American Type Culture Collection (ATCC, Manassas, VA), authenticated, and maintained in early passages for no more than 6 months after receipt from ATCC. Cells were treated with 5μM (final conc) 5-aza-2′-deoxycytidine (Sigma-Aldrich, St. Louis, MO) as previously published (15).
Immunoblot Analysis
Nitrocellulose membranes were probed with anti-TRIM29 (sc-33151, Santa Cruz Biotechnology), E-cadherin (sc-21791), EpCAM (sc-25308), N-cadherin (sc-59987), Vimentin (sc-32322), anti-Myc (#2276 Cell Signaling), anti-HA (#26183 Thermo Scientific), anti-TWIST (GTX12310), or monoclonal anti-tubulin (E7) (Developmental Studies Hybridoma Bank, Univ. of Iowa). Immunoblot signals were developed using chemiluminescence.
qRT-PCR Analysis
Total RNA was isolated from cultured cell lines or frozen breast tissues using TRI Reagent (Ambion). cDNA synthesis was conducted with the High Capacity RNA-to-cDNA Kit, qPCR conducted with Power SYBR Green master mix (Life Technologies) using an Applied Biosystems StepOnePlus theromocycler. Fold changes in relative transcript abundance were calculated with the 2(−ΔΔCt) method (16) using GAPDH as the internal standard. Primers used for qRT-PCR are listed in Supplementary Table SI. Results shown are the mean of at least three independent experimental replicates.
Breast Tumor and Normal Tissue Specimens
Fresh-frozen breast tumors and normal breast tissues were obtained from the University of Florida Molecular Tissue Bank and the Moffitt Cancer Center Total Cancer Care Biorepository. All specimens were obtained in accordance with policies of the institutional review board of the University of Florida Health Sciences Center or H. Lee Moffitt Cancer Center & Research Institute.
DNA Methylation Analysis
Genomic DNA was isolated from cell lines and frozen tissues with TRI Reagent. DNA was bisulfite modified using the EZ DNA methylation kit (ZYMO) as previously outlined (17).
Quantitative DNA methylation analysis was conducted by pyrosequencing as previously described (18). A 247 bp segment of the TRIM29 gene was amplified from bisulfite converted DNA using primers outlined in Supplementary Table SI and pyrosequencing conducted using the indicated sequencing primer. Bisulfite genomic sequencing was conducted using standard protocols (19). Pyrosequencing results shown are the mean of at least three independent experimental replicates.
RNA Interference
For RNAi-mediated knockdown of TRIM29, shRNA lentiviral vectors (TRCN0000016351 (#1) or TRCN0000016352 (#2)) were obtained from Open Biosystems. Lentivirus encoding shRNA or empty pLKO.1 vectors were packaged in HEK-293T cells (ATCC) as previously outlined (15). Selection with 2 μg/ml puromycin was conducted for approximately 1–3 weeks prior to analysis of the resultant polyclonal cell populations.
ON-TARGET plus human TWIST1 siRNA SMART pool and siRNA control were purchased from Thermo Scientific. Unless otherwise specified, cells were transfected with 200 nM siRNA using Lipofectamine 2000 (Life Technology) and 48 hr post transfection cells were harvested and analyzed as indicated.
Recombinant Protein Expression
For transient protein expression, cells were transfected with pcDNA3.1-HA-ATDC (13) (gift of Dr. E. Seto, Moffitt Cancer Center), pcDNA 3.1-HA-TWIST1, or Myc-Twist1-pCS2 or (gift of Dr. R. Maestro, CRO Aviano National Cancer Institute, Italy) using TurboFect Transfection Reagent (Thermo Scientific). Where indicated, the control vectors (pcDNA3.1 or Myc-GFP-pCS3) were transfected in parallel. 48 hr post-transfection, cells were harvested and indicated experimentation conducted.
For stable expression of recombinant FLAG-tagged TRIM29, retrovirus was packaged in HEK-293T by co-transfecting with either pMX-puro-FLAG-TRIM29/ATDC or control pMX-puro (20), along with psPAX2 and pCL-ECO (Addgene).
In Vitro Cell Invasion Assay
Cell invasion assay was measured via modified Boyden chamber assay as described previously (21). 24 hr after seeding into the top well, the bottom well was fixed and stained with Diff-Quik, invading cells photographed in 10 randomly selected fields and counted.
Cell Proliferation Assay
Cell proliferation was measured using CellTiter Blue Reagent (Promega, Madison, WI) as directed by the manufacturer. Briefly, cells were seeded in 12 wells plates, and 24 and 48 hr later were washed twice with PBS and re-fed with complete growth medium containing 10% (v/v) CellTiter Blue Reagent. Cells were incubated at 37°C for an additional for 90 min and subsequently 100 μl of medium was removed and fluorescence measured (560nm excitation / 590nm emission wavelength) using a BMG Labtech fluorometer. Cell proliferation at 48 hr was calculated relative to the fluorescence value recorded at 24 hr. Graphed is the result of at least three independent assays.
Transcriptional Reporter Assays
Human TWIST1 promoter reporter construct (pGL3-Twist-Luc) was a generous gift of Dr. Lu-Hai Wang (National Health Research Institutes, Taiwan). A 1,100 bp portion of the TRIM29 gene proximal promoter region was amplified from human genomic DNA using primers outlined in Supplementary Table SI. The resultant amplicon was digested with NheI and XhoI at primer encoded restriction sites, and subsequently subcloned into pGL3-Basic (Promega). A recombinant clone (pTRIM29-Luc) was confirmed by automated Sanger sequencing. Transcriptional activity was measured in transiently transfected cells using the Dual-Luciferase reporter assay system (Promega) as previously outlined (22). Results of transcriptional reporter assays shown represent the mean of at least three independent experiments.
Chromatin Immunoprecipitation (ChIP)
ChIP with anti-HA antibody was performed as previously outlined (15). Briefly, cells were harvested, proteins were briefly cross-linked with 1% formaldehyde (RT, 10 min), washed and resuspended in ice-cold TEG buffer (10 mM Tris, 1 mM EDTA, 0.5 mM EGTA, pH 8.0). Cells were sonicated on ice for 8 × 30s, debris removed by centrifugation, and soluble chromatin was immunoprecipitated with anti-HA (Thermo) or control mouse IgG (Sigma). DNA was isolated from pelleted immunocomplexes and qPCR carried out using primers outlined in Supplementary Table SI. Shown is the mean from at least three independent ChIP assays for each indicated cell line.
Gene Expression Database and Statistical Analysis
Gene expression data and clinical information collected from 1,809 breast cancer patients was downloaded from the Kaplan-Meier Plotter Breast Cancer website and indicated statistical tests conducted using IBM SPSS v20.
RESULTS
The TRIM29 gene is a target for epigenetic silencing in cultured breast cancer cell lines
We observed that TRIM29 was only detected in the tumor lines SK-BR-3, MDA-MB-468, and non-tumorigenic mammary epithelium-derived MCF-10A and immortalized human mammary epithelium cells (HMEC) by immunoblotting (Fig 1A), consistent with a previous study (23). Further, when relative TRIM29 mRNA was quantified by qRT-PCR, transcript was only detectable in these four cell lines (Fig 1B).
Figure 1. TRIM29 expression is epigenetically silenced in breast cancer cell lines.
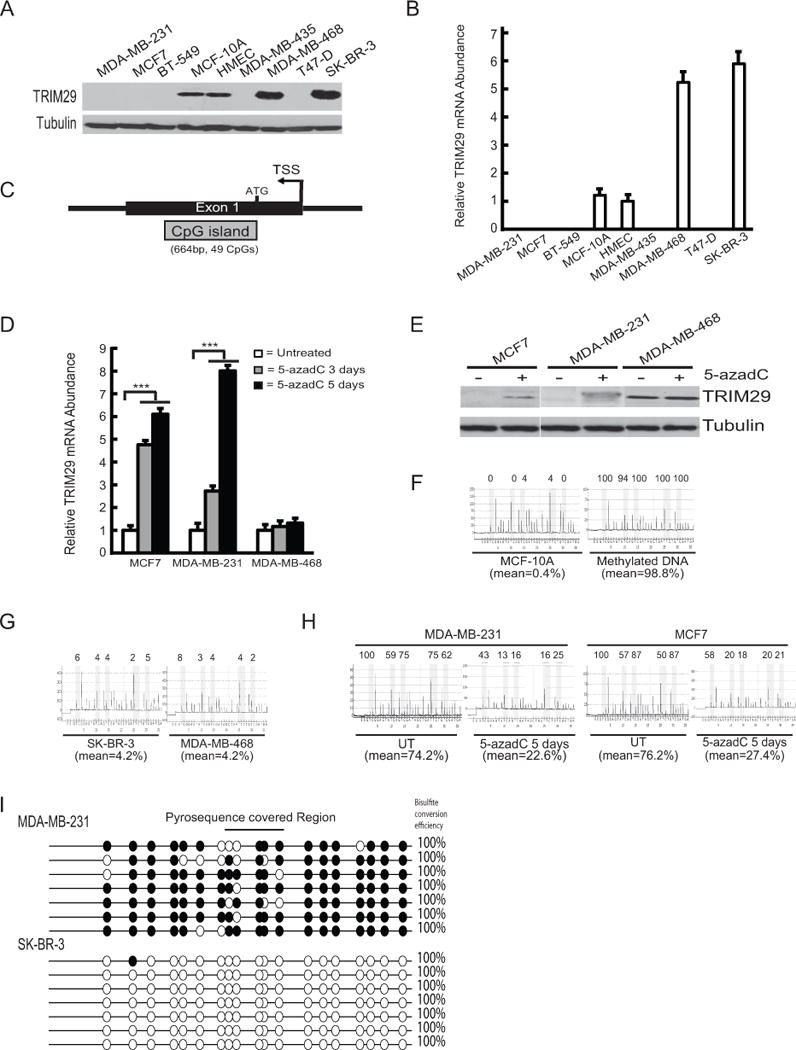
A. Immunoblot analysis of lysates prepared from indicated breast tumor and non-turmorigenic lines probed with anti-TRIM29 and Tubulin (loading control). B. Cell lines were assayed for relative TRIM29 transcript abundance by qRT-PCR. C. Structure of the 5′ flank and exon 1 of the human TRIM29 gene. Indicated is the transcriptional start site (TSS), the translational start site (ATG), and associated CpG island. D. MCF7, MDA-MB-231, or MDA-MB-468 cells were untreated (open bars), or treated with 5-azadC for three (shaded bars) or five (filled bars) days and TRIM29 mRNA measured by qRT-PCR. E. MCF7, MDA-MB-231, and MDA-MB-468 cells were cultured with or without 5-azadC for 5 days and extracts immunoblotted for TRIM29 or Tubulin. F. Genomic DNA harvested from MCF-10A cells or human genomic DNA methylated in vitro was bisulfite modified and analyzed for TRIM29 gene methylation by pyrosequencing. Shown are representative pyrograms, % methylation at each CpG analyzed, and the mean % methylation over the region analyzed. G. Genomic DNA was harvested from SK-BR-3 and MDA-MB-468 cells and analyzed by pyrosequencing. H. Genomic DNA was harvested from untreated (UT) MDA-MB-231 and MCF7 cells or after culture with 5-azadC for 5 days and analyzed by pyrosequencing. I. Representative bisulfite sequencing results from MDA-MB-231 and SK-BR-3 cells; filled=methylated CpG, open=unmethylated CpG. Indicated is the region covered by pyrosequencing (top), and bisulfite conversion efficiency (right). Error bars = 1.0 SE; (*** indicates P<0.001, Student’s t-test).
We inspected the architecture of the human TRIM29 gene locus (Fig 1C and Supplementary Fig S1). The TRIM29 gene is located at 11q23.3, is comprised of 9 exons, and spans ~44.5 kb (Supplementary Fig 1A). Superimposed upon exon 1 is a 664 bp GC-rich feature classified as a “CpG island” (Supplementary Fig 1B) (24). Aberrant dense cytosine methylation within CpG islands is associated with transcriptional repression and epigenetic gene silencing (25).
Given the low/absent expression of TRIM29 in many cultured breast cancer lines and TRIM29 gene architecture, we tested for epigenetic silencing by culturing MDA-MB-231 and MCF7 cells on the global DNA demethylating drug 5-aza-deoxyCytidine (5-azadC). qRT-PCR analysis of RNA harvested 3 and 5 days after drug addition indicated a multi-fold rise in TRIM29 transcript in both lines but not in 5-azadC treated MDA-MB-468 cells (Fig 1D). Coordinately, 5-azadC treatment resulted in a notable rise in TRIM29 protein expression in MDA-MB-231 and MCF7 (Fig 1E).
A pyrosequencing assay was developed to measure DNA methylation within a 35 bp region (containing 5 CpG dinucleotides) of the TRIM29 CpG island (see Supplementary Fig S1). MCF-10A cells contained extremely low levels of CpG methylation (mean=0.4%) while human genomic DNA methylated in vitro displayed near complete methylation (mean=98.8%) within the TRIM29 gene (Fig 1F). Very low levels of TRIM29 methylation were measured in SK-BR-3 and MDA-MB-468 cells (mean=4.2% for both lines) (Fig 1G). In contrast, untreated MDA-MB-231 and MCF7 cells displayed elevated CpG methylation (mean=74.2% and 76.2%, respectively) (Fig 1H). Consistent with gene re-expression, 5 days of 5-azadC produced a measureable decrease in TRIM29 methylation (mean=22.6% and 27.4%, respectively). Pyrosequencing analysis of the remaining breast tumor lines initially assayed for TRIM29 expression indicated similarly high levels of TRIM29 gene methylation (Supplementary Fig S2A).
Bisulfite genomic sequencing (BGS) was also conducted on several breast cancer cell lines to examine DNA methylation density within the TRIM29 gene. Representative data obtained from MDA-MB-231 cells, but not SK-BR-3, indicates this line contains a pattern of dense CpG methylation within single DNA templates of the TRIM29 gene (Fig 1I). This finding is consistent with obtained pyrosequencing results and further supports that aberrant CpG methylation occurs within the TRIM29 gene.
Reduced TRIM29 expression is associated with gene hypermethylation in primary breast tumors
We next examined TRIM29 gene methylation in normal mammary tissues and primary breast tumors. Normal breast tissue samples Br-N7 and Br-N10 indicated relatively low levels of CpG methylation (mean=12.6% and 20.6%, respectively) (Fig 2A). These levels of gene methylation are consistent with values obtained when 9 additional normal human breast samples were assayed for TRIM29 CpG methylation (mean = 18.0%, SE=8.0%) (Fig 2B, Supplementary Fig S2B). Primary breast tumor specimens Br-T16 and Br-T18 contained a high methylation (mean=61.6% and 81.0%, respectively), and lower levels of CpG methylation were measured in tumor sample Br-T8 (mean=27.2%) (Fig 2A), thus aberrant TRIM29 methylation occurs in primary breast tumors.
Figure 2. Aberrant hypermethylation of the TRIM29 gene is associated with reduced expression in primary breast tumors.

A. Genomic DNA was harvested from normal mammary tissues (Br-N7, Br-N10) and primary breast tumor specimens (Br-T8, Br-T16, Br-T18) and analyzed by pyrosequencing. B. TRIM29 gene methylation was measured in normal breast tissues and primary breast tumors by pyrosequencing. C. Normal breast tissue and primary breast tumors were assayed for relative TRIM29 mRNA abundance by qRT-PCR. D. Shown is a scatterplot graphing relative TRIM29 mRNA abundance and TRIM29 gene methylation measured within the group of 18 breast tumors with low relative TRIM29 mRNA levels. Regression line was drawn using exponential regression, indicated is the coefficient of determination (R2) and calculated P value (Spearman correlation).
To further examine the relationship between TRIM29 mRNA abundance and TRIM29 gene methylation we measured TRIM29 mRNA levels in 11 normal and 30 primary breast tumor specimens (Fig 2C and Supplementary Fig S2C). qRT-PCR analysis revealed that 12 of the tumor samples displayed TRIM29 mRNA abundance that was equal to or greater than the geometric mean (+/− 1.96 SE) measured in normal breast tissues. This analysis also indicated that some breast tumors, like other tumor types (6–11), display overexpression of the TRIM29 gene relative to normal mammary tissue. We currently do not understand the molecular basis of high TRIM29 expression in these tumors, however, the 11q23 locus is a common site of chromosomal instability in breast cancer (26). Mean TRIM29 methylation within this group of tumors was not significant from mean methylation measured in normal breast tissues (Supplementary Fig S2B).
qRT-PCR analysis also revealed that the majority (n=18) of breast tumors displayed a significant reduction in TRIM29 mRNA relative to normal breast tissue (Fig 2C and Supplementary Fig S2C). Similarly, pyrosequencing indicated a significant elevation in mean TRIM29 gene methylation compared to normal tissues (Fig 2B and Supplementary Fig S2B). When relative TRIM29 mRNA and TRIM29 gene methylation in the breast tumors with low TRIM29 mRNA levels were analyzed on a scatterplot, we observed a significant (P<0.001) inverse correlation between TRIM29 mRNA levels and gene methylation (Fig 2D). From these studies we conclude that the TRIM29 gene is commonly hypermethylated in cultured breast cancer cells and primary breast tumors, and is a novel target for epigenetic silencing.
Knockdown of TRIM29 results in increased breast cancer cell motility and invasiveness
The recent work of Liu et al (14) showed that reduced expression of TRIM29 in MCF-10A cells altered cellular behavior. To extend these findings we used RNAi-mediated gene knockdown to diminish expression of TRIM29 in two human breast tumor (SK-BR-3 and MDA-MB-468) and two non-tumorigenic lines (MCF-10A and HMEC). Immunoblotting indicated a multi-fold reduction in TRIM29 when stably transduced with lentivirus encoding TRIM29-specific shRNA compared to cells transduced with control shRNA vector (pLKO.1) (Fig 3A, Supplementary Fig S3A). We observed a notable change in cell morphology in cultures of SK-BR-3 and MDA-MB-468 cells within 2 weeks of TRIM29 knockdown using two independent shRNA vectors (Fig 3B). Specifically, both lines acquired a spindle-like morphology commonly associated with motile cells (27). In contrast, cultures of MCF-10A or HMEC displayed a less dramatic change in morphology following TRIM29 knockdown (data not shown).
Figure 3. TRIM29 knockdown in breast tumor and control lines increases cell motility, invasiveness, and growth.
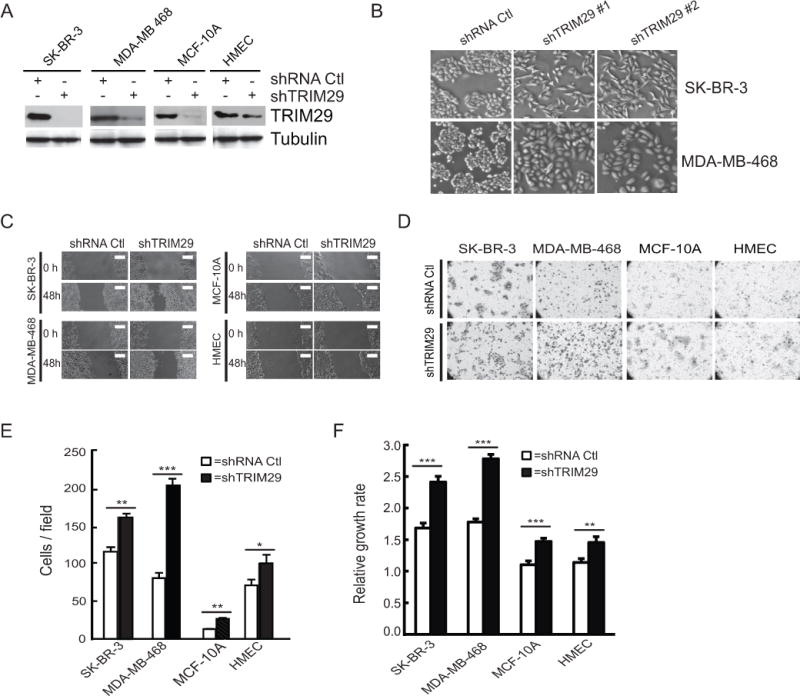
A. SK-BR-3, MDA-MB-468, MCF-10A, and HMEC cells were transduced with lentivirus prepared from empty pLKO.1 plasmid (shRNA Ctl) or plasmid encoding a TRIM29-specific shRNA sequence (shTRIM29) and following selection were immunoblotted with anti-TRIM29 or Tubulin. B. Representative phase-contrast images of SK-BR-3 and MDA-MB-468 cells transduced with shRNA Ctl or two independent shTRIM29 vectors (#1, #2). Note that these two different breast cancer cell lines show similar cell morphology changes (a mesenchymal-like phenotype) when TRIM29 is knocked down with two independent shRNAs. C. Cultures were wounded with a pipette tip and photographed directly (0 hr) and 48 hr after wounding. Scale bar=350 μm. D. Representative micrographs of control and TRIM29 knockdown cells that have invaded through a Matrigel membrane. E. Invaded cells were counted in control (open bars) and TRIM29 knockdown (filled bars) lines in ten randomly chosen fields, average cells/field is graphed. F. Relative growth rates of control (open bars) and TRIM29 knockdown (filled bars) lines were determined using CellTiter Blue Reagent. Error bars = 1.0 SE. (* indicates P<0.05; ** indicates P<0.01, *** indicates P<0.001, Student’s t-test).
48 hr after wounding monolayer cultures, we observed increased cell migration into the wound in each TRIM29 knockdown line compared to control lines (Fig 3C). Invasion assays on cells with and without TRIM29 knockdown were conducted using a modified Boyden chamber assay (Fig 3D) and we measured statistically significant increases in invasive activity in each line following TRIM29 knockdown (Fig 3E). Finally, a proliferation assay indicated that TRIM29 knockdown significantly increased cell growth rates relative to controls (Fig 3F). These experiments reveal that TRIM29 knockdown in cultured breast tumor and non-tumorigenic cell lines increases cell motility, proliferation, and invasiveness.
TWIST1 is upregulated and gene expression patterns altered following TRIM29 knockdown
Increased invasive behavior is often linked to alterations in gene expression patterns resulting in downregulation of epithelial and upregulation of mesenchymal genes (27). SK-BR-3 do not express E-cadherin (28), a prominent epithelial marker, but we observed a measureable decrease in both E-cadherin protein (Fig 4A) and transcript abundance (Fig 4B) in MDA-MB-468 cells following TRIM29 knockdown. In contrast, no detectable alteration in E-cadherin protein was observed in MCF-10A (Fig 4A), but a ~2-fold decrease in CDH1 mRNA was measured in response to TRIM29 knockdown (Fig 4B). EpCAM, an epithelial cell adhesion molecule, also showed decreased expression in TRIM29 knockdown SK-BR-3, MDA-MB-468 and MCF-10A cells by both immunoblotting and qRT-PCR (Fig 4A and B, respectively).
Figure 4. TRIM29 knockdown alters gene expression patterns and increased expression of TWIST1.
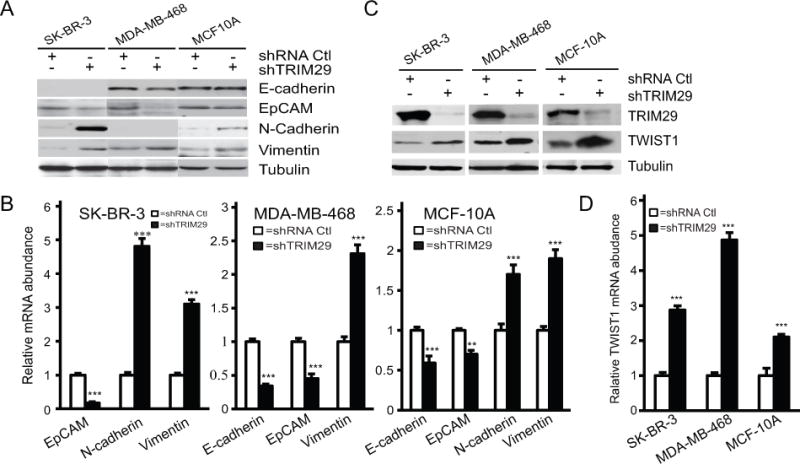
A. Indicated control and TRIM29 knockdown lines were immunoblotted for E-cadherin, EpCAM, N-cadherin, Vimentin, and Tubulin. B. qRT-PCR analysis of relative mRNA abundance of indicated marker genes in control (open bars) and TRIM29 knockdown (filled bars) lines. C. Immunoblot analysis of TWIST1, TRIM29, and Tubulin in indicated control and TRIM29 knockdown cell lines. D. Relative TWIST1 transcript abundance was measured in indicated control (open bars) and TRIM29 knockdown (filled bars) cell lines. Error bars = 1.0 SE. (** indicates P<0.01, *** indicates P<0.001, Student’s t-test).
We measured a sharp increase in protein (Fig 4A) and mRNA (Fig 4B) of the mesenchymal marker N-cadherin in SK-BR-3, and a more moderate increase in MCF-10A following TRIM29 knockdown. Analysis of MDA-MB-468 cells failed to detect even basal expression of N-cadherin in this cell line. Experiments indicated that TRIM29 knockdown resulted in an increase in both the Vimentin protein and transcript in each cell line. In sum, while results are somewhat variable between the cells included in this study, knockdown of TRIM29 resulted in a downregulation of epithelial and upregulation of mesenchymal genes.
Such alterations in gene expression are governed, in part, by a set of basic helix-loop-helix (bHLH) transcription factors that promote acquisition of motile and invasive behavior (29). The principal bHLH proteins responsible for such alterations are SNAIL (SNAI1), SLUG (SNAI2), TWIST1, ZEB1, and ZEB2. Analysis of SNAIL, SLUG, ZEB1, and ZEB2 expression by either qRT-PCR or immunoblotting proved inconclusive; however, when extracts of SK-BR-3, MDA-MB-468, and MCF-10A cells were immunoblotted with an anti-TWIST1 antibody we observed, in each line, increased levels of this protein associated with TRIM29 knockdown (Fig 4C) and parallel results were obtained when qRT-PCR was used to measure TWIST1 transcript (Fig 4D). Analysis of SK-BR-3 and MDA-MB-468 cells using two independent TRIM29 shRNA sequences also displayed increased TWIST1 protein and transcript abundance, decreased EpCAM and increased N-cadherin expression, (Supplementary Fig S3A, B), indicating that these effects are specific to TRIM29 knockdown.
TWIST1 and TRIM29 exhibit a reciprocal relationship
To better understand the relationship between TRIM29 and TWIST1 we transiently expressed recombinant HA-tagged TRIM29 in SK-BR-3 and MDA-MB-468 cells and observed endogenous TWIST1 levels decreased in both lines (Fig 5A). We also observed expression of recombinant Myc-tagged Twist1 decreased endogenous TRIM29 abundance (Fig 5B). qRT-PCR indicated that TRIM29 expression resulted in a significant drop in TWIST1 transcript and, conversely, that expression of recombinant Twist1 decreased TRIM29 mRNA (Fig 5C).
Figure 5. TWIST1 and TRIM29 exhibit a reciprocal relationship.
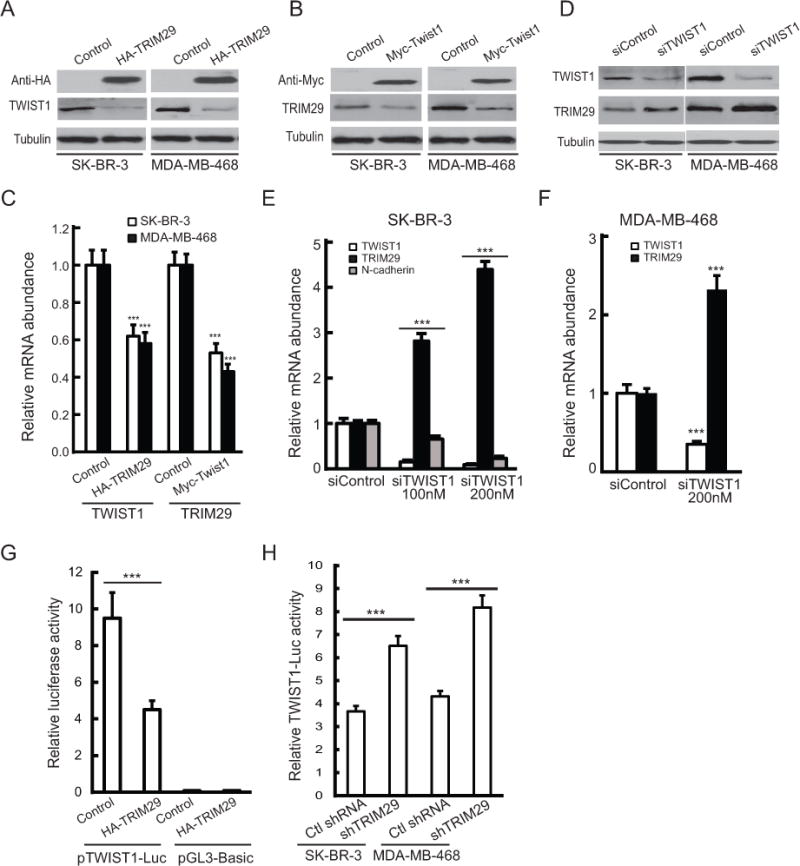
A. SK-BR-3 or MDA-MB-468 cells were transiently transfected with empty pcDNA 3.1 (control) or plasmid encoding HA-tagged TRIM29 and immunoblotted with anti-HA, TWIST1, or Tubulin. B. SK-BR-3 or MDA-MB-468 cells were transiently transfected with Myc-GFP-pCS3 (control) or plasmid encoding Myc-tagged Twist1. Lysates were immunoblotted with anti-Myc, TRIM29, or Tubulin. C. SK-BR-3 (open bars) and MDA-MB-468 (filled bars) cells were transfected with respective control plasmid, plasmid encoding HA-tagged TRIM29 or Myc-tagged Twist1. 48 hr post-transfection cells were harvested, RNA isolated, and analyzed by qRT-PCR for TWIST1 or TRIM29 mRNA abundance. D. SK-BR-3 or MDA-MB-468 cells were transfected with 200 nM control (siControl) or TWIST1-specific siRNA (siTWIST1) and 48 hr post-transfection cells were harvested, lysed and immunoblotted for TWIST1, TRIM29, or Tubulin. E. SK-BR-3 cells were transfected with control, 100 nM, or 200 nM TWIST1-specific siRNA, and 48 hr post-transfection cells harvested, total RNA isolated, and qRT-PCR conducted to analyze TWIST1 (open bars), TRIM29 (filled bars), or N-cadherin (shaded bars) mRNA abundance. F. MDA-MB-468 cells were transfected with control or TWIST1-specific siRNA and qRT-PCR conducted to analyze TWIST1 (open bars) or TRIM29 (filled bars) mRNA abundance. G. HEK-293T cells were transfected with either pGL3-TWIST-Luc or empty pGL3-Basic, and co-transfected with either pcDNA 3.1 (control) or plasmid encoding HA-tagged TRIM29. Lysates were measured for both firefly and Renilla luciferase and relative firefly luciferase signal calculated. H. Control and TRIM29 knockdown SK-BR-3 and MDA-MB-468 cells were transfected with pGL3-TWIST-Luc and 24 hrs post-transfection the relative luciferase signal was measured. Error bars = 1.0 SE. (*** indicates P<0.001, Student’s t-test).
We next transfected SK-BR-3 or MDA-MB-468 cells with TWIST1-specific or control siRNA and observed that TWIST1-specific siRNA resulted in knockdown of TWIST1 and increase in TRIM29 protein (Fig 5D). Similarly, we measured a dose-dependent increase in TRIM29 transcript in SK-BR-3 and MDA-MB-468 cells after TWIST1 knockdown with siRNA (Fig 5E,F, respectively). Since N-cadherin is a direct transcriptional target of TWIST1 (30), we also analyzed SK-BR-3 cells for expression of this gene following TWIST1 knockdown. The results indicate TWIST1 knockdown resulted in a significant dose-dependent decrease in N-cadherin mRNA abundance in SK-BR-3 (Fig 5E). Similar results were obtained when control and TRIM29 shRNA knockdown SK-BR-3 cells were transfected with TWIST1 siRNA (Supplementary Fig S4), supporting the conclusion that TWIST1 is driving N-cadherin expression following TRIM29 knockdown.
We obtained a luciferase reporter plasmid (pGL3-Twist-Luc) containing a segment of the human TWIST1 promoter (31). We observed when co-transfected with recombinant TRIM29 into HEK-293T cells that luciferase activity was decreased compared to cells co-transfected with reporter and control (pcDNA3.1) vector (Fig 5G), suggesting that TRIM29 antagonizes transcription of the TWIST1 gene. TWIST1 reporter assays conducted in SK-BR-3 and MDA-MB-468 cells indicated a significant increase in reporter activity following TRIM29 knockdown (Fig 5H). We conclude that TRIM29 and TWIST1 antagonize the activity and/or expression of each other, implying the presence of a novel negative feedback loop.
TWIST1 inhibits TRIM29 promoter activity
Inspection of the 5′ flank of the human TRIM29 gene revealed the presence of 10 canonical E-box sequences (5′-CANNTG-3′) within a cluster upstream of the transcriptional start site of the TRIM29 gene (nt# −349 to −747, Fig 6A). We amplified a 1,100 bp fragment of the TRIM29 proximal promoter and cloned it into a luciferase-linked reporter plasmid (pGL3-Basic). When this construct (pTRIM29-Luc) was transfected into HEK-293T cells we measured a multi-fold increase in luciferase activity compared to controls (Fig 6B), indicating this segment possesses promoter activity. When pTRIM29-Luc reporter was co-transfected into HEK-293T along with recombinant TWIST1, we observed repressed luciferase activity (Fig 6B). We also measured decreased TRIM29 reporter activity in both SK-BR-3 and MDA-MB-468 TRIM29 knockdown lines cells compared to controls (Fig 6C), indicating that reduced TRIM29 protein levels decrease transcriptional activity of the TRIM29 gene. Taken together, these results imply that TWIST1 represses TRIM29 promoter activity.
Figure 6. TWIST1 associates with the TRIM29 promoter and represses its activity.
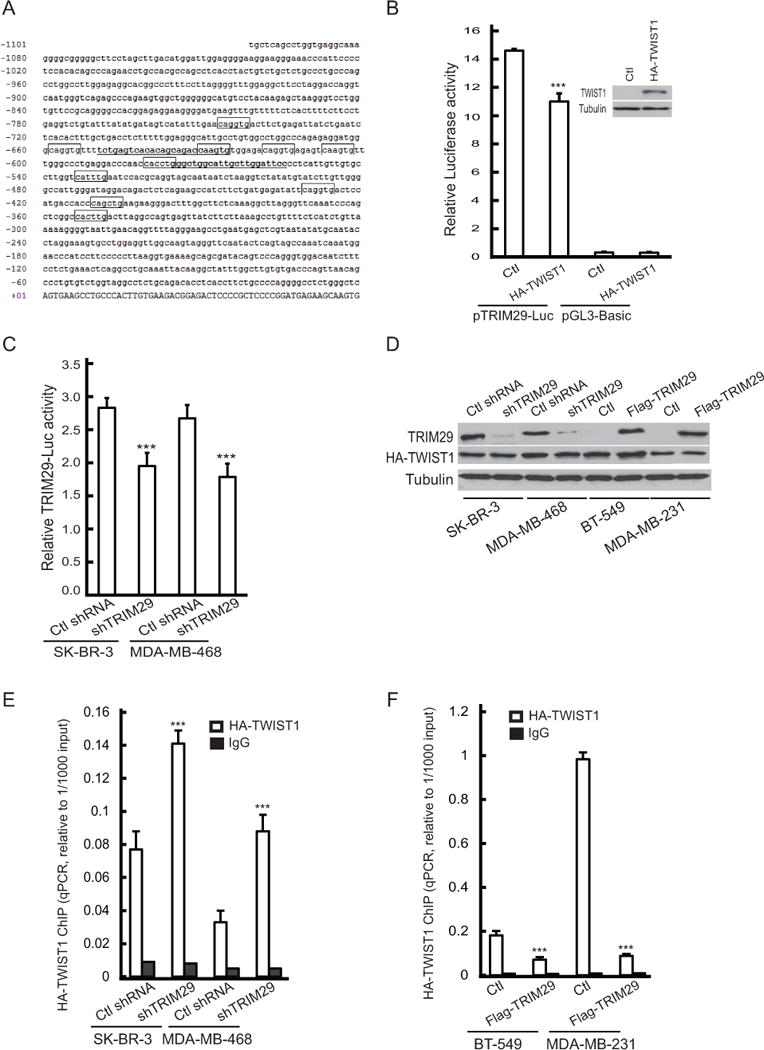
A. Sequence of the 5′ flank of the human TRIM29 gene. Illustrated is the transcriptional start site (nt # +01), canonical E-box elements are boxed, location of primers used in ChIP are underlined. B. pTRIM29-Luc or pGL3-Basic was co-transfected into HEK-293T along with plasmid encoding recombinant HA-TWIST1 or empty pcDNA 3.1 (Ctl). Inset: Immunoblot showing transient TWIST1 expression in cells transfected with indicated plasmid. C. SK-BR-3 and MDA-MB-468 cells with and without TRIM29 knockdown were transfected with pTRIM29-Luc and relative luciferase activity measured 24 hrs post-transfection. D. SK-BR-3 and MDA-MB-468 cells with and without TRIM29 knockdown, or BT-549 and MDA-MB-231 control cells or those stably expressing Flag-tagged TRIM29 were transiently transfected with a plasmid encoding HA-tagged TWIST1. Cell extracts were assayed by immunoblotting with anti-TRIM29, anti-HA, and anti-Tubulin. E. Chromatin was harvested from HA-TWIST1 expressing SK-BR-3 and MDA-MB-468 cells with and without TRIM29 knockdown and ChIP conducted with anti-HA (open bars) or non-specific mouse IgG (filled bars) and qPCR performed. F. Chromatin was harvested from HA-TWIST1 expressing BT-549 and MDA-MB-231 control and Flag-tagged TRIM29 expressing cells. Chromatin was immunoprecipitated with anti-HA (open bars) or non-specific mouse IgG (filled bars) and qPCR conducted. Error bars = 1.0 SE. (*** indicates P<0.001, Student’s t-test).
We next used chromatin immunoprecipitation (ChIP) to analyze the association of recombinant TWIST1 with a segment of the TRIM29 promoter containing multiple E-boxes (see Fig 6A). To conduct these experiments, we transiently expressed HA-tagged human TWIST1 in SK-BR-3 and MDA-MB-468 cells with and without TRIM29 knockdown (Fig 6D). qPCR measured significantly increased relative enrichment of the targeted locus in chromatin precipitated using anti-HA compared to chromatin precipitated with non-specific mouse IgG (Fig 6E), indicating interaction of recombinant TWIST1 with the targeted region of the TRIM29 gene. Further, increases in relative enrichment of HA-TWIST1 interaction with TRIM29 were measured in chromatin harvested from TRIM29 knockdown SK-BR-3 and MDA-MB-468 cells (Fig 6E), suggesting that reduced TRIM29 protein was allowing increased association of TWIST1 with the TRIM29 gene.
We also stably expressed recombinant FLAG-tagged human TRIM29 in two breast tumor lines (BT-549 and MDA-MB-231) that have silenced endogenous TRIM29 expression, and HA-TWIST1 was expressed for the purpose of conducting ChIP (Fig 6D). ChIP assays indicated that expression of recombinant TRIM29 protein resulted in a significant reduction in relative enrichment of the TRIM29 promoter segment compared to cells not expressing recombinant TRIM29 (Fig 6F), indicating reduced TWIST1 association with the TRIM29 gene in the presence of TRIM29 protein. In sum, these findings indicate that TWIST1 associates (either directly or indirectly) with the TRIM29 gene, this interaction is associated with transcriptional repression of the TRIM29 gene, and that TRIM29 blocks the interaction of TWIST1 with the TRIM29 gene.
Low TRIM29 expression is associated with reduced breast cancer patient survival and markers of aggressive breast cancer behavior
We used breast cancer data within the KM-Plotter database (32) to investigate the association of TRIM29 expression with breast cancer survival. This analysis indicated that low TRIM29 expression was significantly (P<0.0001) associated with reduced relapse-free survival (RFS) compared to patients with higher TRIM29 expression (Fig 7A). Of note, we found no significant association between TRIM29 expression and overall survival (OS) in this set of breast cancer patients.
Figure 7. Reduced TRIM29 expression is associated with poorer survival and more aggressive breast cancer behavior.
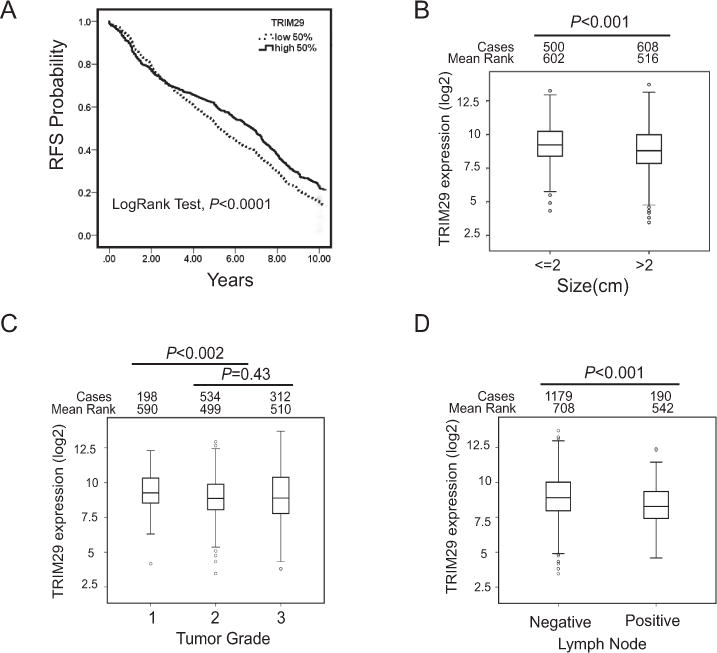
A. A public breast cancer database was queried to examine the association between breast cancer patient relapse-free survival (RFS) and TRIM29 gene expression. Indicated is LogRank P value, n=1,809. TRIM29 expression (log2 values) was compared in breast tumors grouped by indicated size (B), tumor grade (C), and lymph node metastasis (D). Number of cases in each group is given as well as the calculated Mean Rank and P value (Mann-Whitney test).
Comparison of breast tumors ≤2cm with tumors >2cm indicated TRIM29 expression is significantly lower in the larger tumors (Fig 7B). We also observed that higher grade (Grades 2 and 3) tumors displayed significantly lower TRIM29 expression compared to Grade 1 tumors (Fig 7C). Of note, we found no significant difference when TRIM29 expression was compared between Grade 2 and Grade 3 tumors (P=0.43, Mann-Whitney test). Lower TRIM29 expression was also associated with tumors positive for lymph node spread compared to node-negative tumors (Fig 7D). Independent of either patient age at diagnosis, lymph node status, tumor size or grade, or ER expression, low TRIM29 expression was found to be a significant predictive factor for reduced RFS in breast cancer patients when multivariate survival analysis using a Cox model was applied to this data set (Supplementary Fig S5A–E, Supplementary Table 2). In sum, low TRIM29 expression is associated with reduced relapse-free survival, more aggressive tumor characteristics (increased tumor size and grade), and metastatic breast cancer behavior.
DISCUSSION
Iacobuzio-Donahue and colleagues observed that TRIM29 expression was ~5-fold elevated in primary pancreatic tumors and cell lines compared to normal pancreas or duodenal mucosa (11). Later, it was determined that when included in a six gene panel, elevated TRIM29 expression could distinguish pancreatic ductal adenocarcinoma from chronic pancreatitis (33). Recent reports indicate that TRIM29 overexpression is commonly observed in squamous cell carcinoma and non-small cell lung cancers (9, 10) and in 69% (86/124) of gastric cancer cases as judged by qRT-PCR (8). Of note, these investigators also documented that elevated TRIM29 expression with aggressive gastric tumor characteristics and reduced patient survival.
In contrast, Nacht et al (34) observed that TRIM29 was underexpressed by at least 10-fold in approximately 50% of primary breast tumors compared normal mammary tissue. We have documented, in both cultured cells and primary breast tumors, the TRIM29 gene is a novel target for epigenetic silencing. Thus, it is likely that the reduced TRIM29 expression measured in this earlier study was attributable, at least in part, to aberrant DNA hypermethylation within the TRIM29 gene.
The notion that TRIM29 could function in a potentially tumor suppressive role in breast cancer was first suggested when Hosoi et al (23) documented that expression of recombinant TRIM29 in BT-549 cells suppressed both colony forming ability and proliferation. Expression of recombinant TRIM29 in MCF7 cells also slowed growth rates and reduced anchorage-independent growth (14) and we have observed similar effects in BT-549 and MDA-MB-231 cells (data not shown). Conversely, knockdown of TRIM29 in MCF-10A cells promoted anchorage-independent growth, increased cell motility and invasiveness, and disrupted 3D acinar formation in vitro (14). We have confirmed these findings using a broader panel of breast tumor and mammary epithelium-derived cell lines, and extended these studies by determining that knockdown of TRIM29 in breast cancer cells altered gene expression patterns in a manner consistent with increased cell motility and invasiveness. In sum, available evidence firmly supports the conclusion that TRIM29 functions in a growth/invasion suppressive capacity in mammary epithelial cells.
We observed that breast cancer patients with tumors exhibiting reduced TRIM29 expression have reduced relapse-free survival (RFS). Further, low TRIM29 expression is associated with more aggressive tumor features. Liu et al (14) observed reduced survival in young women with ER+ tumors, but reported no difference in older women with ER+ breast cancer. Analysis of the database used in our study revealed low TRIM29 expression was significantly associated with poorer RFS regardless of patient age at diagnosis (Supplementary Fig S5A). While clearly in need of further analysis and data refinement, these facts suggest that TRIM29 expression may be useful as a prognostic breast cancer biomarker.
Our study of breast cancer cells with TRIM29 knockdown indicated that concomitant with reduced TRIM29 expression was a coordinate increase in TWIST1, a bHLH transcription factor that, like other bHLH proteins (i.e., SNAIL, SLUG, ZEB1 and ZEB2), functions in an oncogenic role in breast cancer (35). Specifically, transcription factors of this subgroup promote the epithelial to mesenchymal transition (EMT) during cancer progression. EMT is an embryonic program that governs cell motility and, accordingly, TWIST1 is critical for closure of the neural tube during embryogenesis (36). In the context of cancer, activation of EMT promotes otherwise non-motile and polarized epithelial cells to lose polarity and cell-cell contact, and invade adjacent stroma (29). For this reason, increased TWIST1 activity is associated with metastatic activity (35). As our study demonstrates TRIM29 suppresses TWIST1 expression and activity, we conclude that this activity is at least one mechanism by which TRIM29 functions to suppress breast cancer development.
We observed that TRIM29 knockdown results in upregulation of TWIST1 and, conversely, that expression of TRIM29 drives down TWIST1 levels in cultured breast cancer cells. These findings suggest that TRIM29 has an inhibitory role on the transcription of the TWIST1 gene. Further, expression of recombinant TRIM29 resulted in reduced association of TWIST1 with the TRIM29 gene as judged by ChIP. These findings imply that TRIM29 interferes with the function of the TWIST1 protein. At present we are unsure of the mechanism(s) that underlie these observations. As TRIM29 antagonizes p53 function by sequestering this transcription factor in the cytoplasm (13), it is tempting to speculate that TRIM29 could be functioning in a parallel role to sequester factor(s) that promote TWIST1 transcription. Alternatively, while TRIM29 has been characterized as a cytoplasmic protein (3) and has not been reported to interact with chromatin, it contains two B-box Zn-finger motifs and other B-box proteins are transcriptional modulators, generally as components of protein complexes (37).
Knockdown of TWIST1 resulted in increased TRIM29 mRNA and protein levels and expression of recombinant TWIST1 had the opposite effect. Inspection of genomic sequence revealed a cluster of ten canonical E-box elements upstream of the TRIM29 transcriptional start site and expression of recombinant TWIST1 resulted in measurable suppression of transcription of a reporter driven by a portion of the TRIM29 proximal promoter containing this E-box cluster. ChIP analysis confirmed that TWIST1 associates with a segment of the TRIM29 promoter containing several of these E-box elements. Others have recently reported that TWIST1 binds to E-boxes within the ESR1 (ERα) gene leading to the transcriptional repression of ERα (38) and our work supports the conclusion that TWIST1 similarly functions to suppress expression of the TRIM29 gene in breast cancer cells.
In summary, we document that the TRIM29 gene is a novel target for epigenetic silencing in breast cancer and that knockdown of the TRIM29 protein results in alterations in gene expression patterns that drive increased cell growth, motility, and invasiveness. We also document that TRIM29 suppresses the activity of the oncogenic transcription factor TWIST1, providing a molecular basis for the emerging view that TRIM29 is a potential tumor suppressor in breast cancer.
Supplementary Material
Acknowledgments
We thank Drs. Seto, Maestro, and Wang for their generous gifts of plasmid constructs used in this study. M.A. was supported by funding from the Turkish Government. This work was supported by funding from the Florida Dept of Health and NIH (1RO3CA143980) to EMS and KDB.
Footnotes
The authors disclose no potential conflicts of interest
References
- 1.Short KM, Cox TC. Subclassification of the RBCC/TRIM superfamily reveals a novel motif necessary for microtubule binding. J Biol Chem. 2006;281:8970–80. doi: 10.1074/jbc.M512755200. [DOI] [PubMed] [Google Scholar]
- 2.Hatakeyama S. TRIM proteins and cancer. Nat Rev Cancer. 2011;11:792–804. doi: 10.1038/nrc3139. [DOI] [PubMed] [Google Scholar]
- 3.Reymond A, Meroni G, Fantozzi A, Merla G, Cairo S, Luzi L, et al. The tripartite motif family identifies cell compartments. EMBO J. 2001;20:2140–51. doi: 10.1093/emboj/20.9.2140. [DOI] [PMC free article] [PubMed] [Google Scholar]
- 4.Napolitano LM, Meroni G. TRIM family: Pleiotropy and diversification through homomultimer and heteromultimer formation. IUBMB Life. 2012;64:64–71. doi: 10.1002/iub.580. [DOI] [PubMed] [Google Scholar]
- 5.Ozato K, Shin DM, Chang TH, Morse HC., 3rd TRIM family proteins and their emerging roles in innate immunity. Nat Rev Immunol. 2008;8:849–60. doi: 10.1038/nri2413. [DOI] [PMC free article] [PubMed] [Google Scholar]
- 6.Fristrup N, Birkenkamp-Demtroder K, Reinert T, Sanchez-Carbayo M, Segersten U, Malmstrom PU, et al. Multicenter validation of cyclin D1, MCM7, TRIM29, and UBE2C as prognostic protein markers in non-muscle-invasive bladder cancer. Am J Pathol. 2013;182:339–49. doi: 10.1016/j.ajpath.2012.10.017. [DOI] [PubMed] [Google Scholar]
- 7.Glebov OK, Rodriguez LM, Soballe P, DeNobile J, Cliatt J, Nakahara K, et al. Gene expression patterns distinguish colonoscopically isolated human aberrant crypt foci from normal colonic mucosa. Cancer Epidemiol Biomarkers Prev. 2006;15:2253–62. doi: 10.1158/1055-9965.EPI-05-0694. [DOI] [PubMed] [Google Scholar]
- 8.Kosaka Y, Inoue H, Ohmachi T, Yokoe T, Matsumoto T, Mimori K, et al. Tripartite motif-containing 29 (TRIM29) is a novel marker for lymph node metastasis in gastric cancer. Ann Surg Oncol. 2007;14:2543–9. doi: 10.1245/s10434-007-9461-1. [DOI] [PubMed] [Google Scholar]
- 9.Tang ZP, Dong QZ, Cui QZ, Papavassiliou P, Wang ED, Wang EH. Ataxia-telangiectasia group D complementing gene (ATDC) promotes lung cancer cell proliferation by activating NF-kappaB pathway. PLoS One. 2013;8:e63676. doi: 10.1371/journal.pone.0063676. [DOI] [PMC free article] [PubMed] [Google Scholar]
- 10.Xiao Z, Jiang Q, Willette-Brown J, Xi S, Zhu F, Burkett S, et al. The pivotal role of IKKalpha in the development of spontaneous lung squamous cell carcinomas. Cancer Cell. 2013;23:527–40. doi: 10.1016/j.ccr.2013.03.009. [DOI] [PMC free article] [PubMed] [Google Scholar]
- 11.Iacobuzio-Donahue CA, Ashfaq R, Maitra A, Adsay NV, Shen-Ong GL, Berg K, et al. Highly expressed genes in pancreatic ductal adenocarcinomas: a comprehensive characterization and comparison of the transcription profiles obtained from three major technologies. Cancer Res. 2003;63:8614–22. [PubMed] [Google Scholar]
- 12.Wang L, Heidt DG, Lee CJ, Yang H, Logsdon CD, Zhang L, et al. Oncogenic function of ATDC in pancreatic cancer through Wnt pathway activation and beta-catenin stabilization. Cancer Cell. 2009;15:207–19. doi: 10.1016/j.ccr.2009.01.018. [DOI] [PMC free article] [PubMed] [Google Scholar]
- 13.Yuan Z, Villagra A, Peng L, Coppola D, Glozak M, Sotomayor EM, et al. The ATDC (TRIM29) protein binds p53 and antagonizes p53-mediated functions. Mol Cell Biol. 2010;30:3004–15. doi: 10.1128/MCB.01023-09. [DOI] [PMC free article] [PubMed] [Google Scholar]
- 14.Liu J, Welm B, Boucher KM, Ebbert MT, Bernard PS. TRIM29 functions as a tumor suppressor in nontumorigenic breast cells and invasive ER+ breast cancer. Am J Pathol. 2012;180:839–47. doi: 10.1016/j.ajpath.2011.10.020. [DOI] [PMC free article] [PubMed] [Google Scholar]
- 15.Ai L, Kim WJ, Demircan B, Dyer LM, Bray KJ, Skehan RR, et al. The transglutaminase 2 gene (TGM2), a potential molecular marker for chemotherapeutic drug sensitivity, is epigenetically silenced in breast cancer. Carcinogenesis. 2008;29:510–8. doi: 10.1093/carcin/bgm280. [DOI] [PubMed] [Google Scholar]
- 16.Livak KJ, Schmittgen TD. Analysis of relative gene expression data using real-time quantitative PCR and the 2(-Delta Delta C(T)) Method. Methods. 2001;25:402–8. doi: 10.1006/meth.2001.1262. [DOI] [PubMed] [Google Scholar]
- 17.Ai L, Kim WJ, Kim TY, Fields CR, Massoll NA, Robertson KD, et al. Epigenetic Silencing of the Tumor Suppressor Cystatin M Occurs during Breast Cancer Progression. Cancer Res. 2006;66:7899–909. doi: 10.1158/0008-5472.CAN-06-0576. [DOI] [PubMed] [Google Scholar]
- 18.Demircan B, Dyer LM, Gerace M, Lobenhofer EK, Robertson KD, Brown KD. Comparative epigenomics of human and mouse mammary tumors. Genes Chromosomes Cancer. 2009;48:83–97. doi: 10.1002/gcc.20620. [DOI] [PMC free article] [PubMed] [Google Scholar]
- 19.Darst RP, Pardo CE, Ai L, Brown KD, Kladde MP. Bisulfite sequencing of DNA. Curr Protoc Mol Biol. 2010:1–17. doi: 10.1002/0471142727.mb0709s91. Chapter 7: Unit 7 9. [DOI] [PMC free article] [PubMed] [Google Scholar]
- 20.Sho T, Tsukiyama T, Sato T, Kondo T, Cheng J, Saku T, et al. TRIM29 negatively regulates p53 via inhibition of Tip60. Biochim Biophys Acta. 2011;1813:1245–53. doi: 10.1016/j.bbamcr.2011.03.018. [DOI] [PubMed] [Google Scholar]
- 21.Kim WJ, Gersey Z, Daaka Y. Rap1GAP regulates renal cell carcinoma invasion. Cancer Lett. 2012;320:65–71. doi: 10.1016/j.canlet.2012.01.022. [DOI] [PMC free article] [PubMed] [Google Scholar]
- 22.Ai L, Skehan RR, Saydi J, Lin T, Brown KD. Ataxia-Telangiectasia, Mutated (ATM)/Nuclear Factor kappa light chain enhancer of activated B cells (NFkappaB) signaling controls basal and DNA damage-induced transglutaminase 2 expression. J Biol Chem. 2012;287:18330–41. doi: 10.1074/jbc.M112.339317. [DOI] [PMC free article] [PubMed] [Google Scholar]
- 23.Hosoi Y, Kapp LN, Murnane JP, Matsumoto Y, Enomoto A, Ono T, et al. Suppression of anchorage-independent growth by expression of the ataxia-telangiectasia group D complementing gene, ATDC. Biochem Biophys Res Commun. 2006;348:728–34. doi: 10.1016/j.bbrc.2006.07.115. [DOI] [PubMed] [Google Scholar]
- 24.Gardiner-Garden M, Frommer M. CpG islands in vertebrate genomes. J Mol Biol. 1987;196:261–82. doi: 10.1016/0022-2836(87)90689-9. [DOI] [PubMed] [Google Scholar]
- 25.Robertson KD. DNA methylation and human disease. Nat Rev Genet. 2005;6:597–610. doi: 10.1038/nrg1655. [DOI] [PubMed] [Google Scholar]
- 26.Hampton GM, Mannermaa A, Winqvist R, Alavaikko M, Blanco G, Taskinen PJ, et al. Loss of heterozygosity in sporadic human breast carcinoma: a common region between 11q22 and 11q23.3. Cancer Res. 1994;54:4586–9. [PubMed] [Google Scholar]
- 27.Thiery JP. Epithelial-mesenchymal transitions in tumour progression. Nat Rev Cancer. 2002;2:442–54. doi: 10.1038/nrc822. [DOI] [PubMed] [Google Scholar]
- 28.Hiraguri S, Godfrey T, Nakamura H, Graff J, Collins C, Shayesteh L, et al. Mechanisms of inactivation of E-cadherin in breast cancer cell lines. Cancer Res. 1998;58:1972–7. [PubMed] [Google Scholar]
- 29.De Craene B, Berx G. Regulatory networks defining EMT during cancer initiation and progression. Nat Rev Cancer. 2013;13:97–110. doi: 10.1038/nrc3447. [DOI] [PubMed] [Google Scholar]
- 30.Alexander NR, Tran NL, Rekapally H, Summers CE, Glackin C, Heimark RL. N-cadherin gene expression in prostate carcinoma is modulated by integrin-dependent nuclear translocation of Twist1. Cancer Res. 2006;66:3365–9. doi: 10.1158/0008-5472.CAN-05-3401. [DOI] [PubMed] [Google Scholar]
- 31.Cheng GZ, Zhang WZ, Sun M, Wang Q, Coppola D, Mansour M, et al. Twist is transcriptionally induced by activation of STAT3 and mediates STAT3 oncogenic function. J Biol Chem. 2008;283:14665–73. doi: 10.1074/jbc.M707429200. [DOI] [PMC free article] [PubMed] [Google Scholar]
- 32.Gyorffy B, Lanczky A, Eklund AC, Denkert C, Budczies J, Li Q, et al. An online survival analysis tool to rapidly assess the effect of 22,277 genes on breast cancer prognosis using microarray data of 1,809 patients. Breast Cancer Res Treat. 2010;123:725–31. doi: 10.1007/s10549-009-0674-9. [DOI] [PubMed] [Google Scholar]
- 33.Chen Y, Zheng B, Robbins DH, Lewin DN, Mikhitarian K, Graham A, et al. Accurate discrimination of pancreatic ductal adenocarcinoma and chronic pancreatitis using multimarker expression data and samples obtained by minimally invasive fine needle aspiration. Int J Cancer. 2007;120:1511–7. doi: 10.1002/ijc.22487. [DOI] [PubMed] [Google Scholar]
- 34.Nacht M, Ferguson AT, Zhang W, Petroziello JM, Cook BP, Gao YH, et al. Combining serial analysis of gene expression and array technologies to identify genes differentially expressed in breast cancer. Cancer Res. 1999;59:5464–70. [PubMed] [Google Scholar]
- 35.Yang J, Mani SA, Donaher JL, Ramaswamy S, Itzykson RA, Come C, et al. Twist, a master regulator of morphogenesis, plays an essential role in tumor metastasis. Cell. 2004;117:927–39. doi: 10.1016/j.cell.2004.06.006. [DOI] [PubMed] [Google Scholar]
- 36.Chen ZF, Behringer RR. twist is required in head mesenchyme for cranial neural tube morphogenesis. Genes Dev. 1995;9:686–99. doi: 10.1101/gad.9.6.686. [DOI] [PubMed] [Google Scholar]
- 37.Torok M, Etkin LD. Two B or not two B? Overview of the rapidly expanding B-box family of proteins. Differentiation. 2001;67:63–71. doi: 10.1046/j.1432-0436.2001.067003063.x. [DOI] [PubMed] [Google Scholar]
- 38.Vesuna F, Lisok A, Kimble B, Domek J, Kato Y, van der Groep P, et al. Twist contributes to hormone resistance in breast cancer by downregulating estrogen receptor-alpha. Oncogene. 2012;31:3223–34. doi: 10.1038/onc.2011.483. [DOI] [PMC free article] [PubMed] [Google Scholar]
Associated Data
This section collects any data citations, data availability statements, or supplementary materials included in this article.