

Abstract
Cerenkov luminescence (CL) has been used recently in a plethora of medical applications like imaging and therapy with clinically relevant medical isotopes. The range of medical isotopes used is fairly large and expanding. The generation of in vivo light is useful since it circumvents depth limitations for excitation light. Cerenkov luminescence imaging (CLI) is much cheaper in terms of infrastructure than positron emission tomography (PET) and is particularly useful for imaging of superficial structures. Imaging can basically be done using a sensitive camera optimized for low-light conditions, and it has a better resolution than any other nuclear imaging modality. CLI has been shown to effectively diagnose disease with regularly used PET isotope (18F-FDG) in clinical setting. Cerenkov luminescence tomography, Cerenkov luminescence endoscopy, and intraoperative Cerenkov imaging have also been explored with positive conclusions expanding the current range of applications. Cerenkov has also been used to improve PET imaging resolution since the source of both is the radioisotope being used. Smart imaging agents have been designed based on modulation of the Cerenkov signal using small molecules and nanoparticles giving better insight of the tumor biology.
1. INTRODUCTION
Cerenkov luminescence (CL) is a phenomenon, which was first described by Russian scientist Pavel Alekseyevich Cherenkov in 1934 working under Sergei Ivanovich Vavilov. His initial observations consisted of seeing himself blue light from a bottle of water when subjected to radioactive decay. Detailed subsequent research revealed that charged particles emitted from radionuclides at a velocity higher than the speed of light in that particular medium were the cause of this luminescence (Cherenkov, 1934). The phenomenon was hence named as Cerenkov luminescence, and P.A. Cherenkov along with Il´ja Mikhailovich Frank and Igor Yevgenyevich Tamm was awarded the Nobel Prize in Physics in 1958 for the discovery and explanation of the Cerenkov effect.
2. CERENKOV RADIATION PHYSICS (SIMPLIFIED)
Here, we attempt to explain the rather complex physics of CL without reverting too often to physical equations. Therefore, these explanations are simplified.
There are several mechanisms by which unstable isotopes decay, some involving the emission of charged particles, either negatively charged electrons or positively charged positrons (or helium nuclei as α-particles, which due to their high mass usually do not fulfill the criteria to produce CL, see below). Initially, a charged particle generated by a radionuclide may exist in a super-relativistic state: it may travel faster than the speed of light in that medium (although being less than the speed of light in vacuum, which cannot be surpassed). Simply explained, charged particles traveling faster than the speed of light in a medium transfer their kinetic energy through interactions with the surrounding dipoles, in biological tissues mostly with water. The randomly oriented water molecules will align with the passing super-relativistic charged particle and relax by releasing the transferred energy in the form of light (Ross, 1969). The number of photons emitted as CL per unit path length of a charged particle was calculated by Frank and Tamm (Parker & Elrick, 1966), for example, it has been calculated that a particle with the highest threshold energy traveling a path length of 1 cm in water emits 320 photons in the visible spectrum (Krizan, 2001).
2.1. Dependence of CL on the refractive index of the medium
The threshold energy for the generation of CL in a dielectric medium is mostly dependent on the refractive index of the medium as is graphically expressed in Fig. 6.1A, showing the relationship between refractive index and threshold energy. The increase of the light output from a radionuclide in media with increasing refractive index as shown in Fig. 6.1B is reminiscent to the fact that a higher percentage of emitted positrons now reach the threshold energy to generate CL. Also, the dependence of the light generation on the refractive index of the solvent ruled out the possibility that the observed light is generated by other physical effects (Robertson et al., 2009).
Figure 6.1.

(A) Threshold energy of β-particle for Cerenkov as a function of medium refractive index. (B) The light output from 209 μCi 18F-FDG in solutions of varying refractive indices as shown by Robertson. (C) Equal activity concentration of 18F-FDG (3.952 MBq in 20 μL) was diluted in 2 mL of different liquids: water (H2O, refractive index: n = 1.3359), ethanol (C2H5OH, n = 1.366), saltwater (H2O and saturating NaCl, n = 1.377) along with a control sample of water without 18F-FDG. Higher CL intensity is seen in medium with higher refractive index. (B) With permission from Robertson et al. (2009). (C) With permission from Thorek, Robertson, et al. (2012).
For water with a refractive index of 1.332 and tissue with an estimated refractive index of around 1.4, the corresponding calculated threshold ener gies are 263 and 219 keV, respectively. Thus, only β-particles, with a kinetic energy of 263 keV or higher can produce Cerenkov luminescence (CL) in water. This dependence of the threshold energy requirements for Cerenkov generation upon the refractive index of the medium is reflected in the amount of CL photons from different emitters. For emitters of particles with low kinetic energy, the threshold energy in a low-density medium is often too high for the majority of the emitted particles to generate CL. However, in a medium with higher density, the threshold energy is lower, and therefore, more particles have the probability of exceeding the threshold energy resulting in much higher number of generated Cerenkov photons. This change in the number of Cerenkov photons generated by particles depending on the refractive index of the medium could help enhance the overall weak CL signal (Fig. 6.1C). Based on this principle, Cerenkov sensors for detecting low energy β-particles have been build by using transparent liquids with high refractive indices rather than using a scintillator (Yoo et al., 2013).
2.2. CL from α-particles
CL from α-particles demands much higher kinetic energy than that required for β-particles. An α-particle is 104 times heavier than a β-particle, and hence, the kinetic energy to generate CL in water is 1926 MeV, which is much higher than the typical energy of an α-particle from radioactive decay. While Cerenkov light has been observed from α-emitting radiotracers, this Cerenkov light production is from secondary β-particles generated by daughter radionuclides in the decay chain. Phantom studies with the α-emitter 225Ac showed a significantly higher average radiance per activity concentration (ca. sevenfold) than 18F (Ruggiero, Holland, Lewis, & Grimm, 2010). The source of Cl from 225Ac is not the α-particles from the Actinium but β-emitting daughter radionuclides with shorter half lives than the parent decay (McDevitt & Scheinberg, 2002). Monte Carlo simulations by Ackerman et al. showed a significant delay between the initial α-emitting par ent decay and the production of Cerenkov due to the generation of daughter nuclides (Ackerman & Graves, 2012). Notably, this greatly reduces the resolution of Cerenkov luminescence imaging (CLI) with α-particles since the site of the parent decay is different from the site of Cerenkov generation by daughter radionuclides which is translocated by diffusion, crippling CLI resolution. 241Am, which has both α- and low energy γ-emission, has been used by Boschi et al. to qualitatively assess the light generated solely by α-particles (Boschi et al., 2011). Monte Carlo simulations of the CL qualitatively matched the in vitro studies. In a pseudo in vivo model where the activity was placed under the arm of the mouse, Cerenkov was observed using standard optical imaging techniques. However, it has been challenging to obtain Cerenkov light in vivo with α-emitters, e.g., in our hands for 225Ac, the renal toxicity was reached before any Cerenkov could be detected (in this case, the 225Ac was coupled to a carbon nanotube).
2.3. Conical wave front of Cerenkov light
The Huygens construction describes the propagation of light waves and can be used to describe the generation of CL as shown in Fig. 6.2. CR is generated at an angle to the direction of the traveling charged particle defined as θ, which can be calculated. Importantly, the angle of Cerenkov light is related to the energy of the released particle. When the β-particle is at the threshold energy, the Cerenkov photons travel exactly along the direction of the charged particle. β-particles with an energy greater than the threshold energy will have a larger angle θ. As the energy of the β-particles reaches its maximum, the maximum angle of Cerenkov light emission for any charged particle in water comes to 41.3°. Notably, the CL is also polarized; however, the polarization angle is different for each photon, therefore as of yet no useful utilization of the polarization has been developed.
Figure 6.2.
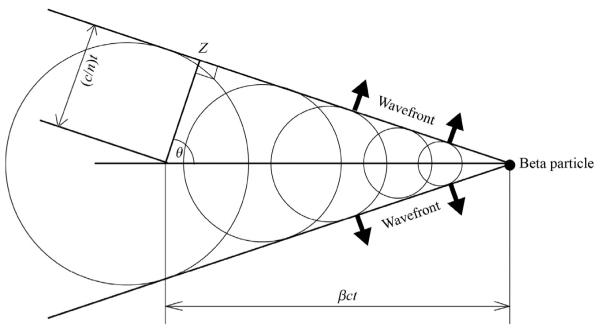
Huygen's construction of a conical Cerenkov wave front generated by a charged particle traveling from X to Y in time t. The angle of emission is θ, distance of travel of the particle from X to Y is βct, and the distance of travel of the Cerenkov photon from X to Z is (c/n)t.
2.4. Spectral characteristics of Cerenkov
The number of photons emitted per path length of the charged particle in a spectral interval between λ1 and λ2 is calculated with the equation shown above, where λ1 and λ2 are upper and lower limits of selected wavelength region, and z is the charge of the particle (Sowerby, 1971). In 1969, Ross used the Frank–Tamm equation for water as a medium (refractive index n = 1.332) to calculate the total number of photons generated by the particles for a range of wavelengths between 250 and 600 nm. It is to be noted that light absorption, scattering, or chromatic dispersion are not considered in these calculations. A summary of these calculations is given in Table 6.1. A continuous spectrum is generated from a positron emitter, which gradually increases at lower wavelengths (Fig. 6.3). The peak of CL is in the UV/blue range of the spectrum but it has a tail into the visible part of the spectrum. This is important for in vivo applications (see below). Varying the radionuclides does not change the spectrum of CL, but depending on the energy of the particles, the number of photons and, therefore, the intensity of CL will change. The blue nature of CL can be seen in nuclear reactors and their cooling basins in form of a blue glow where the highly energetic particles originating from the fuel rods generating CL. In this case, the particles are so energetic that CL becomes visible with the naked eye.
Table 6.1.
Calculated total number of photons generated by particles of varying energies which have a wavelength ranging from 250 to 600 nm
| Electron energy (keV) |
Total no. of photons |
Electron energy (keV) |
Total no. of photons |
|---|---|---|---|
| 275 | 0.0112 | 1200 | 99.44 |
|
| |||
| 300 | 0.0142 | 1400 | 137.92 |
|
| |||
| 350 | 0.953 | 1600 | 180 |
|
| |||
| 400 | 2.52 | 1800 | 225.9 |
|
| |||
| 450 | 4.782 | 2000 | 274.8 |
|
| |||
| 500 | 7.744 | 2200 | 326.2 |
|
| |||
| 550 | 11.348 | 2400 | 380.6 |
|
| |||
| 600 | 15.52 | 2600 | 436.9 |
|
| |||
| 650 | 20.23 | 2800 | 495.8 |
|
| |||
| 700 | 26.45 | 3000 | 557.8 |
|
| |||
| 750 | 31.16 | 3200 | 619.8 |
|
| |||
| 800 | 37.26 | 3400 | 685.2 |
|
| |||
| 850 | 43.82 | 3600 | 750.8 |
|
| |||
| 900 | 50.75 | 3800 | 819.2 |
|
| |||
| 950 | 57.97 | 4000 | 849.3 |
|
| |||
| 1000 | 65.74 | ||
Adapted from Ross (1969).
Figure 6.3.
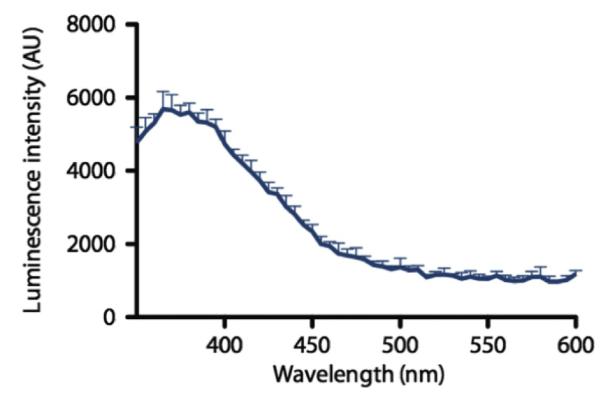
Cerenkov spectrum. Relaxation of the molecules in the medium, polarized by the passage of the charged particle, produces visible light weighted toward the higher energy of the spectrum (UV/blue) and dropping toward the red part of the spectrum. The profile of the CR is centered at the blue, as shown with 68 Ga (18.5 MBq) in 0.1 M HCl diluted in water, using a Molecular Diagnostics M5 spectrophotometer. The decrease at the lowest wave length is an artifact due to the decreased sensitivity of the detector in this range. With permission from Thorek, Robertson, et al. (2012).
2.5. Light intensity and spatial distribution
The probability distribution for the β-particle energy for any radionuclide depends on the end point energy, the maximum kinetic energy. For 18F and 90Y, the end point energies are 0.633 and 2.28 MeV, respectively. Given that the energy threshold for CL generation in a given medium remains constant (depending on the refractive index), Fig. 6.4 demonstrates that 90Y produces a greater number of particles capable of inducing CL than 18F. For 18F, a majority of the integral area of the probability function falls below the threshold energy of water while for 90Y the majority is above it.
Figure 6.4.
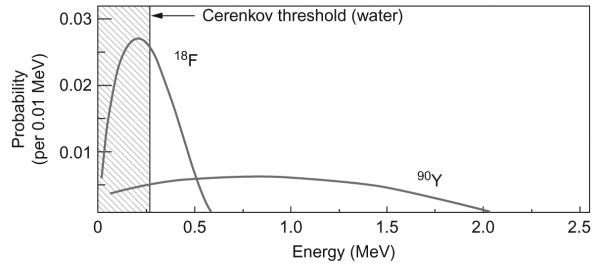
β-particle energy probability distribution for 18F and 90Y representing a greater number of β-particles capable of producing Cerenkov for the radionuclide with higher end point energy. With permission from Mitchell, Gill, Boucher, Li, and Cherry (2011).
Monte Carlo simulations have been used to model the tracks for β-particles traveling through water (Mitchell et al., 2011). The model also shows the point at which the energy of the particle falls below the threshold energy to generate Cerenkov emission. The tracks were superimposed and shown for individual radionuclides as shown in Fig. 6.5A. The high-energy β−-particles (electrons) generated from 90Y have a higher root mean square (rms) spread compared to the low energy β+ -particles (positrons) generated from 18F. Also, the drop of the particle’s kinetic energy under the threshold for CL generation in the tracks of the particle happens much earlier for 18F than 90Y, which signifies that the particles travel a much shorter distance before they cease generating CL. 18F emits some particles, which are below the threshold energy and actually never produce Cerenkov. This correlation between the energy of the particle generated by various radionuclides and the rms of distance traveled by the particle is represented in Fig. 6.5B (Mitchell et al., 2011).
Figure 6.5.

(A) Superimposed Monte Carlo simulation of particle tracks generated from 18F (top) and 90Y (bottom) in water. Color change of the particle track indicates the point at which its energy is lower than the threshold Cerenkov energy. (B) Simulated light intensity distribution of radionuclides with varying β-particle end point energies. With permission from Mitchell et al. (2011).
2.6. CL in tissue
Photons generated by CL in vivo travel through tissue before being detected and may be absorbed or scattered on their way. Absorption of photons in tissue is dependent on the wavelength. Hemoglobin absorbs photons strongly in the blue–green region while photons in the near infrared are least absorbed (Weissleder & Ntziachristos, 2003). Scattering occurs when photons travel through areas with different refractive indices. For in vivo imaging using an optical source at a given depth under the tissue surface, a diffusion model of photons is required to quantify the number of photons with high spatial resolution for the point source. As shown by Rice et al. for photons traveling through a medium the photon fluence decreases exponentially with an increase in distance from the point source. Longer wavelengths were less attenuated than shorter ones. The attenuation per unit source depth was highest for shorter wavelengths (Rice, Cable, & Nelson, 2001), which unfortunately includes most of the CL photons. Image resolution was found to dissipate faster for longer wavelengths than shorter ones with increasing source depth. Hence, there is a tradeoff between sensitivity and resolution when varying the wavelength or the source depth (Rice et al., 2001). While the CL is mostly in the blue part of the spectrum, light exiting the tissue is mostly in the penetrating and less absorbed but also less intense part of the Cerenkov spectrum (Spinelli & Boschi, 2012; Spinelli et al., 2010). Using various filter sets or ratiometric imaging is currently explored to utilize the spectral characteristics of CL.
3. APPLICATION OF CERENKOV IN BIOLOGICAL SCIENCES: CLI
Cerenkov light has been utilized in physics for various applications, for example, for the detection of cosmic rays or to estimate the fuel status of nuclear reactors. A brief report in Nature in 1971 described the measurement of 32P for radiotherapy in the eye of a rabbit, generating CL in the vitreous body (Burch, 1971). However, only in 2009, Robertson et al. described the dedicated optical imaging of 18F-FDG in a tumor-bearing mouse (Robertson et al., 2009) as CLI. There were initial doubts after the first reports of CLI in vivo if the light noted was due to high-energy gamma rays hitting the charge coupled device (CCD) chip in the camera. However, placing a sheet of opaque paper over a 18F-FDG sample abrogated the signal, which suggested that the signal detected was visible light rather than high-energy photons. Direct gamma scintillation on the CCD by using a predominantly gamma-emitting radioisotope 99mTc did not generate any signal showing that a charged particle emitter is required for CL (Boschi et al., 2010; Robertson et al., 2009; Spinelli et al., 2010).
3.1. CL from medical radiotracers
CLI has quickly emerged as an increasingly valuable modality in preclinical molecular imaging. Many applications of CLI in preclinical research surfaced, utilizing CLI from a variety of clinical radiotracers (Boschi et al., 2010; Liu, Ren, et al., 2010; Ruggiero et al., 2010). A wide variety of medically relevant radioisotopes, including 15O, 13N, 68Ga, 89Zr, 64Cu, 225Ac, 90Y, 124I, and 74As, have subsequently been studied for CLI, showing that radioactivity correlated well with the light output (radiance) both in vitro and in vivo. It has been used to monitor cancer chemotherapy (Robertson, Germanos, Manfredi, Smith, & Silva, 2011; Xu et al., 2012) and radiotherapy using labeled peptides (Zhang et al., 2013), as well as to image the expression of genes (Jeong et al., 2011; Wolfs et al., 2014; Yang et al., 2012). In radiotherapy, CLI is particularly useful as it is able to image radio-tracers with electron or even α-particle emission, which cannot be imaged reasonably otherwise (Liu, Ren, et al., 2010; Ruggiero et al., 2010). In addition, these therapeutic isotopes are particularly suited for CLI due to the high kinetic energy of the particles (Mitchell et al., 2011). Cerenkov has also found applications in the quality control of radiochemistry, using CL to quantify the amount of 18F radioactivity in a microfluidic chip in situ (Cho et al., 2009). It was envisioned that this technique would allow a simple yet quantitative detection of radioactivity using microfluidics for radio-chemical synthesis. The minimum detectable activity was reported to be 0.19 μCi/mm2. These studies demonstrated the unique opportunity to merge optical and nuclear imaging by utilizing clinically available positron emission tomography (PET) or radiotherapy agents for optical imaging via their inherent CL. For example, CLI has started to be utilized as a “cheap man’s PET”: the optical instruments are considerably cheaper, capable of higher throughout than standard PET imaging and also faster (even for the low-light CL). Therefore, rapid information can be collected on the targeting and distribution of a new agent in a few animals before transitioning to the more involved PET imaging studies. Since many radiotracers are clinically used a rapid translation of this technology is foreseeable in the near future, only depending on technical improvements to capture all available low intensity CL photons but not on the regulatory approval process for new diagnostic (or therapeutic agents).
3.2. Instrumentation for CLI
Mitchell et al. calculated the number of photons per individual decay (Mitchell et al., 2011). The standard tracer 18F generated on average only 1.4 photons per individual decay. This means that the amount of CL is very low, requiring highly sensitive instrumentation and longer imaging times (several minutes). Luckily, sufficient camera systems are already available for chemiluminescence, bioluminescence imaging, and also astronomy. These devices have a highly sensitive camera for single photon counting with low internal noise, mounted for preclinical imaging on a black box to shield all ambient light (Thorek, Robertson, et al., 2012). The spectrum of CL is mostly within the UV and the visible part of the spectrum as shown in Fig. 6.3. Photons from ambient light also fall in the same window with a much greater flux than CL. Hence, for sufficient signal to background ratio, the acquisitions have to be in complete dark with sensitive detecting devices (Chin et al., 2013). The pioneering work for developing these highly sen sitive imaging devices using CCDs was done by Contag et al. which allowed for detection of photons with wavelengths between 400 and 1000 nm for bioluminescence imaging (Contag et al., 1995). These devices are well suited for CLI and have nowadays also preset parameters for CLI built into the system. The Cerenkov light is detected at the surface by a CCD cooled to −90 °C. The bioluminescence imaging systems are also equipped with a light tight box containing a heated sample stage along with a multiport gas anesthesia system for imaging multiple samples simultaneously.
It has been shown that the resolution of CLI is actually better than for any nuclear imaging modality (Liu, Ren, et al., 2010; Thorek, Ogirala, Beattie, & Grimm, 2013), where CLI is able to resolve much smaller structures than, e.g., an animal PET scanner, which provides the highest resolutions currently. Of course, the PET remains tomographic while the CLI is mostly planar and surface-weighted imaging; however, Cerenkov luminescence tomography (CLT) is being actively being pursued (as discussed later).
3.3. Cerenkov luminescence tomography
In vivo CLI is surface-weighted planar imaging without depth information. Li et al. introduced CLT where the Cerenkov photons observed on the surface of the subject were reconstructed using diffusion models to localize the source of the radioisotope (Li, Mitchell, & Cherry, 2010). A simplified model of fluorescence tomography was used for CLT since CL does not require an excitation source like fluorescence. The imaging instruments and reconstruction procedures were similar to that those used for bioluminescence optical tomography, which only differs in the source of photons. As with CLI, CLT also requires a sensitive camera for detecting the CL photons. Photon detection is required in multiple orientations for locating the source of signal generation. The phantom/small animal is placed under the CCD and direct CL is measured. For the second set of images a 2-cm lead brick was placed between the subject and the CCD, thereby not detecting any positrons or CL directly but two mirrors were placed on each side, which could detect the CL (but would let particles and high-energy gamma rays pass) and reflect it into the CCD. Images were acquired using a single bandpass filter in the NIR region. Reconstruction of the images was done assuming homogeneous optical properties inside the mouse, and colocalization of signal was verified using micro-PET (Li et al., 2010). Hu et al. used a heterogeneous model for image reconstruction and verified the signal colocalization using SPECT imaging showing higher correlation than the homogeneous model (Hu et al., 2010). Spinelli et al. have introduced multispectral diffuse CLT (msCLT), where image reconstruction was done using 2D images acquired with varying narrow bandpass filters. This technique does not require imaging the mouse at different angles since the depth information is extracted from the varying diffusion characteristics of the individual wavelength. It improves the illposed inverse problem faced by the earlier models but also suffers from even lower signal intensity due to the narrow bandpass filters used for data acquisition. Since a pure β−-emitting isotope was used, anatomical localization was verified using MRI which could also be used to extract tissue absorption and scattering properties to further optimize the diffusion model (Spinelli et al., 2011). Hu et al. improved on the low intensity of CR in an msCLT technique by using hybrid spectral reconstruction method. Location deviation and activity errors showed improvement over msCLT approach (Hu et al., 2012).
Since CL is a low-light modality, exclusion of ambient light is very important. The intensity of CL is about a billion times lower than, e.g., a typical illumination in an operating room. Therefore, endoscopic applications would be favorable since the ambient light is already reduced significantly. To this end, Liu et al. coupled a small-diameter flexible endoscope to an intensified CCD camera as a prototype system for Cerenkov luminescence endoscopy (CLE) (Kothapalli, Liu, Liao, Cheng, & Gambhir, 2012; Liu et al., 2012). A microimaging lens (F/1.4, 12 mm focal length) was connected to a 10-cm optical imaging fiber bundle, which was coupled to the CCD. The fiber optics bundle was made using 10 μm fibers, whose fiberglass absorbed 40% light at 500 nm, and hence was not optimized for detection of CR. Also, background noise was an issue due to scintillation of impurities in the glass by γ-radiation. The CLE was used to mimic a surgical resection and ambient, and CL functional images were taken with sam pling times of 1 s and 5 min, respectively, in a mice xenograft model. A low tumor to background ratio of 4 was obtained which was thought to be due to the reflection of the CL from the tumor increasing the background. The advantages of these systems are that they have higher spatial resolution than the PET or SPECT imaging systems. A disadvantage of this system is the lack of sensitivity, which has to be compensated with injecting large amounts of activity to the subject. The field of view of a CLE system is much smaller than a CLI system, which causes much lower signal intensity (since less photons are collected by the narrow aperture), a tradeoff for having higher resolution. Nevertheless, this preliminary proof of concept study opens up the possibilities for further development of these systems using more specialized optics and more sensitive detectors.
3.4. Clinical Cerenkov imaging
Driven by the challenges of CLI (low-light intensity and unfavorable spectral characteristics), which have often given reason to doubt the applicability of clinical CLI, we have started a clinical trial for CLI of patients undergoing a routine PET/CT scan (ClinicalTrials.gov identifier NCT01664936) and used the same camera also employed in our prototype Cerenkov imaging system (XR/Mega-10Z; Stanford Photonics, Palo Alto, CA) with a short-pass filter with a cutoff at 605 nm. The camera was run at 120 frames per second with maximum gain. For patients, the camera was mounted on a tripod stand and placed in a light insulated dark room for CLI with additional covering of the imaging side and camera. White-light images of the patient were obtained by using diffused light and superimposed on the CL images (Thorek, Riedl, & Grimm, 2014). This trial demonstrated increased CL-signal from the diseased side, with a much higher signal intensity compared to the control side (Fig. 6.6).
Figure 6.6.
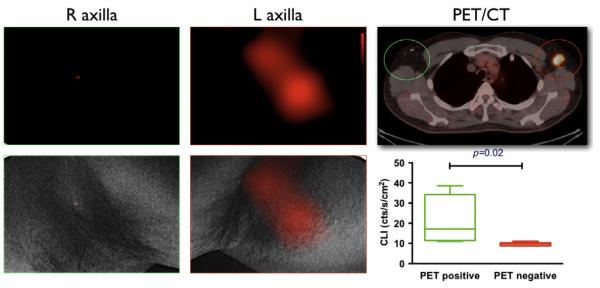
Clinical CLI. Representative CL and PET/CT images of 18F-FDG-positive left axillary lymph node in a lymphoma patient. Negative CLI of right axilla without 18F-FDG-positive lymph node. No significant CL emission from 18F-FDG decay is seen on the right. Both CLI overlaid with white-light photograph in the lower row. The CL signal colocalized with positive PET/CT findings. With permission from Thorek, Riedl, et al. (2014).
Spinelli et al. have used an electron-multiplied charge coupled device cooled to −80 °C analogous to the ones used in the IVISTM systems to obtain clinical CL images from one patient undergoing 131I radiotherapy for Graves disease (Spinelli et al., 2013). The patient was placed at a distance of 50 cm from the camera in a dark-basement hospital room and surrounded with black curtain to eliminate stray photons in the room during acquisition. Gamma rays hitting the detector have been reported to cause a bright spot in the image, which were removed using a box-median filter. Both these pilot trials demonstrate the feasibility of clinical CLI and pave the way for further clinical explorations. These are currently focused on intraoperative imaging.
3.5. Intraoperative Cerenkov imaging
Imaging approaches to better delineate tumors during surgery are expected to lead to a more efficient tumor surgery with improved outcome and post-surgical management. Majority of image-guided cancer surgeries use optical imaging techniques. Camera systems are continuously advancing; however, very few clinically approved fluorescent agents are available, predominantly fluorescein or indocyanine green (De Grand & Frangioni, 2003; Themelis, Yoo, Soh, Schulz, & Ntziachristos, 2009). The financial burden and regulatory requirements to approve fluorescent agents are often prohibitory for the advancement of agents into the clinic, resulting in a lack of clinically approved optical agents. The first preliminary clinical study with a targeted fluorescent agent has only recently been published (van Dam et al., 2011). Intraoperative use of radiotracers is done frequently in oncological surgery today and is the gold standard for sentinel node detection, using 99mTc-preparations and handheld detectors (Mariani et al., 2004; Tokin et al., 2012). However, handheld probes for radiotracer detection are bulky, heavy, expensive, have low resolution or only produce an audible signal. Portable gamma cameras require an iodine seed pointer for exact localization (Dengel et al., 2011; Vermeeren, Valdes Olmos, Meinhardt, & Horenblas, 2011) and are not well suitable for imaging the 511 keV photons emitted by PET tracers (Heller & Zanzonico, 2011). CLI provides an opportunity to utilize existing clinical radiotracers with optical imaging methods for intraoperative optical imaging, merging nuclear, and optical imaging. Importantly, this allows rapid translation of new radiotracers into the realm of intraoperative imaging and also for a combined multimodality approach. Patients can be scanned before surgery with a PET/CT scan and then undergo intraoperative imaging, using one and the same radiotracer for both applications.
We demonstrated the use of CLI for intraoperative imaging in an animal study (Holland, Normand, Ruggiero, Lewis, & Grimm, 2011). The tumor could be delineated clearly and differentiated from the negative control tumor using CLI (Fig. 6.7). After removal of the tumor, no CL signal was detected from the tumor bed in the mouse. After closing, the postoperative CLI showed again no significant signal from the tumor bed. The entire procedure, including surgical resection and acquisition of all images, was completed in less than an hour. CLI has also been used to aid in resection of sentinel lymph nodes (Thorek, Abou, et al., 2012). Furthermore, the above-mentioned developments in endoscopic CLI will play an important role in moving this field forward into the clinical reality. First companies developing technologies for CLI have already emerged (Lightpoint Medical Ltd. in the United Kingdom and the United States).
Figure 6.7.

Intraoperative CLI. Resection of a HER2/neu-positive tumor after administration of 89Zr-DFO-trastuzumab. (A) Background CLI of the scanner bed recorded immediately prior to commencing surgery. (B) Preoperative CLI of mouse 4 prior to surgical incision. (C) Intraoperative CLI of the exposed tumor immediately prior to resection. Note the increased intensity of the CLI signal owing to reduced attenuation and scattering from removal of the skin. (D) Resected tumor (put in the upper left corner) and exposed surgical site showing the complete removal of CL. (E) CLI of the excised BT-474 tumor alone. (F) Postoperative CLI after closing the incision site with sutures. All CLIs are shown at the same radiance scale for direct quantitative comparison. With permission from Holland et al. (2011).
3.6. Cerenkov to improve positron emission tomography
PET is based on the detection of a pair of collinear 511 keV gamma rays photons that are generated upon annihilation of the positron. These gamma rays are released in the opposite direction to each other and are detected by an array of detectors around the subject, which detect the annihilation photons and record the coincidence of these two gamma rays. The detector array is made up of scintillation crystals and photomultiplier tubes, used in sequence for the detection of the annihilation gamma rays. The image is reconstructed to localize the position of the radioisotope. The reconstruction of the images also increases the noise in the data. Time-of-flight (TOF) PET adds the time of the coincidence detection to obtain an improved localization of the decay event on the line between the two detectors who recorded the coinciding gamma rays (Budinger, 1983) A short rise time of the scintillator (the time taken by a signal to change from a low value to a high value) is a key parameter for the development of a TOF-PET with good time resolution. Scintillators generally have slow rise time, whereas CL is generated promptly and has a small time spread, resulting in an excellent time resolution. Although the number of CL photons is less than that generated by the scintillator, which decreases efficiency. Cerenkov in the scintillation crystal can be improved with increased quantum efficiency of detectors and enhanced transparency and shape of the scintillator (Korpar, Dolenec, Krizˇan, Pestotnik, & Stanovnik, 2011). The total number of photons generated is a summation of the scintillation photons and the CL photons, the ratio of which could be optimized by adjusting the amount of scintillation crystal dopant (Cerium) used in the scintillation crystal (e.g., LSO:Ce). Hence, reducing the dopant concentration reduces the absorption of the Cerenkov photons in the scintillation crystal and will increase the total contribution of the CL photons, although the total number of photons would be decreased due to the decrease in contribution from the scintillation source. This reduces the efficiency of the detector but improves time resolution (Brunner, Gruber, Marton, Suzuki, & Hirtl, 2013).
3.7. Cerenkov 2.0
CL can also be applied for the construction of smart imaging agents, detecting, e.g., enzymatic activity by internal enzymatic conversions (Thorek, Abou, et al., 2012). Cerenkov light can be utilized as excitation source for fluorochromes, effectively eliminating the need for an external excitation source and merging fluorescence and CLI. This has been achieved with quantum dots (Dothager, Goiffon, Jackson, Harpstrite, & Piwnica-Worms, 2010; Liu, Zhang, et al., 2010) and fluorochromes (Thorek et al., 2013). Based on this principle, we created activatable Cerenkov agents for an approach termed secondary Cerenkov-induced fluorescence imaging (SCIFI) (Thorek et al., 2013), which allowed for both targeted as well as activatable smart imaging agents. As the first radioactive-decay-based activatable imaging agent ametallopeptidase-2 (MMP-2)-sensing agent was developed, where fluorescein fluorescence was quenched by a gold nanoparticle in the native state of the agent. In the presence of MMP-2, the FAM was released and its fluorescence, excited by CL emission was recovered, thus indicating MMP-2 activity (Fig. 6.8). Recently, we also described the absorption of CL by iron oxide nanoparticles or vital blue dyes as additional mechanism for modulating a Cerenkov signal (Thorek, Das, & Grimm, 2014). These strategies will lead to further interesting applications of CL-utilizing agents geared toward the unique characteristics of the “glow from radiotracers.”
Figure 6.8.

Advanced Cerenkov imaging sensing MMP-2 activity. (A) Scheme of the system: FAM is coupled to a gold nanoparticle via a MMP-2 cleavable linker, close to the nanoparticle the FAM does not fluoresce. (B) SCIFI image showing MMP signal from the MMP expressing tumor on the right shoulder but not from the MMP-negative tumor in the left shoulder. (C) SCIFI quantification of activated probe. (D) Zymography from the tumors corresponds very well. With permission from Thorek et al. (2013).
4. CONCLUSION
CL has entered a wide variety of applications, from technical advancements of PET scanners to control of radiosynthesis in microfluidics to bio-medical applications, including clinical imaging with the bright prospect of CLI in intraoperative imaging, taking advantage of the many clinically used radiotracers. New aspects of CL will certainly emerge, for example, its utilization in activatable radiotracer-based smart agents and other specialized molecules.
ACKNOWLEDGMENTS
This work was supported in part by a NCI Cancer Center Support grant (P30 CA008748-48) and NIBIB (R01 EB014944-01).
REFERENCES
- Ackerman NL, Graves EE. The potential for Cerenkov luminescence imaging of alpha-emitting radionuclides. Physics in Medicine and Biology. 2012;57(3):771–783. doi: 10.1088/0031-9155/57/3/771. [DOI] [PMC free article] [PubMed] [Google Scholar]
- Boschi F, Calderan L, D’Ambrosio D, Marengo M, Fenzi A, Calandrino R, et al. In vivo 18F-FDG tumour uptake measurements in small animals using Cerenkov radiation. European Journal of Nuclear Medicine and Molecular Imaging. 2010;38:120–127. doi: 10.1007/s00259-010-1630-y. [DOI] [PubMed] [Google Scholar]
- Boschi F, Meo SL, Rossi PL, Calandrino R, Sbarbati A, Spinelli AE. Optical imaging of alpha emitters: Simulations, phantom, and in vivo results. Journal of Biomedical Optics. 2011;16(12):126011. doi: 10.1117/1.3663441. [DOI] [PubMed] [Google Scholar]
- Brunner SE, Gruber L, Marton J, Suzuki K, Hirtl A. New approaches for improvement of TOF-PET. Nuclear Instruments and Methods in Physics Research Section A: Accelerators, Spectrometers, Detectors and Associated Equipment. 2013;732:560–563. [Google Scholar]
- Budinger TF. Time-of-flight positron emission tomography: Status relative to conventional PET. Journal of Nuclear Medicine. 1983;24(1):73–78. [PubMed] [Google Scholar]
- Burch WM. Cerenkov light from 32 P as an aid to diagnosis of eye tumours. Nature. 1971;234(5328):358. doi: 10.1038/234358a0. [DOI] [PubMed] [Google Scholar]
- Cherenkov PA. Visible emission of clean liquids by action of γ radiation. Doklady Akademii Nauk SSSR. 1934;2:451. [Google Scholar]
- Chin PT, Welling MM, Meskers SC, Valdes Olmos RA, Tanke H, van Leeuwen FW. Optical imaging as an expansion of nuclear medicine: Cerenkov-based luminescence vs fluorescence-based luminescence. European Journal of Nuclear Medicine and Molecular Imaging. 2013;40(8):1283–1291. doi: 10.1007/s00259-013-2408-9. [DOI] [PubMed] [Google Scholar]
- Cho JS, Taschereau R, Olma S, Liu K, Chen YC, Shen CK, et al. Cerenkov radiation imaging as a method for quantitative measurements of beta particles in a microfluidic chip. Physics in Medicine and Biology. 2009;54(22):6757–6771. doi: 10.1088/0031-9155/54/22/001. [DOI] [PMC free article] [PubMed] [Google Scholar]
- Contag CH, Contag PR, Mullins JI, Spilman SD, Stevenson DK, Benaron DA. Photonic detection of bacterial pathogens in living hosts. Molecular Microbiology. 1995;18(4):593–603. doi: 10.1111/j.1365-2958.1995.mmi_18040593.x. [DOI] [PubMed] [Google Scholar]
- De Grand AM, Frangioni JV. An operational near-infrared fluorescence imaging system prototype for large animal surgery. Technology in Cancer Research & Treatment. 2003;2(6):553–562. doi: 10.1177/153303460300200607. [DOI] [PubMed] [Google Scholar]
- Dengel LT, More MJ, Judy PG, Petroni GR, Smolkin ME, Rehm PK, et al. Intraoperative imaging guidance for sentinel node biopsy in melanoma using a mobile gamma camera. Annals of Surgery. 2011;253(4):774–778. doi: 10.1097/SLA.0b013e3181f9b709. [DOI] [PMC free article] [PubMed] [Google Scholar]
- Dothager RS, Goiffon RJ, Jackson E, Harpstrite S, Piwnica-Worms D. Cerenkov radiation energy transfer (CRET) imaging: A novel method for optical imaging of PET isotopes in biological systems. PLoS One. 2010;5(10):e13300. doi: 10.1371/journal.pone.0013300. [DOI] [PMC free article] [PubMed] [Google Scholar]
- Heller S, Zanzonico P. Nuclear probes and intraoperative gamma cameras. Seminars in Nuclear Medicine. 2011;41(3):166–181. doi: 10.1053/j.semnuclmed.2010.12.004. Review. [DOI] [PubMed] [Google Scholar]
- Holland JP, Normand G, Ruggiero A, Lewis JS, Grimm J. Intraoperative imaging of positron emission tomographic radiotracers using Cerenkov luminescence emissions. Molecular Imaging. 2011;10(3):177–186. [PMC free article] [PubMed] [Google Scholar]
- Hu Z, Liang J, Yang W, Fan W, Li C, Ma X, et al. Experimental Cerenkov luminescence tomography of the mouse model with SPECT imaging validation. Optics Express. 2010;18(24):24441–24450. doi: 10.1364/OE.18.024441. [DOI] [PubMed] [Google Scholar]
- Hu Z, Ma X, Qu X, Yang W, Liang J, Wang J, et al. Three-dimensional noninvasive monitoring iodine 131 uptake in the thyroid using a modified Cerenkov luminescence tomography approach. PLoS One. 2012;7(5):e37623. doi: 10.1371/journal.pone.0037623. [DOI] [PMC free article] [PubMed] [Google Scholar]
- Jeong SY, Hwang MH, Kim JE, Kang S, Park JC, Yoo J, et al. Combined Cerenkov luminescence and nuclear imaging of radioiodine in the thyroid gland and thyroid cancer cells expressing sodium iodide symporter: Initial feasibility study. Endocrine Journal. 2011;58(7):575–583. doi: 10.1507/endocrj.k11e-051. [DOI] [PubMed] [Google Scholar]
- Korpar S, Dolenec R, Krizˇan P, Pestotnik R, Stanovnik A. Study of TOF PET using Cherenkov light. Nuclear Instruments and Methods in Physics Research Section A: Accelerators, Spectrometers, Detectors and Associated Equipment. 2011;654(1):532–538. [Google Scholar]
- Kothapalli S-R, Liu H, Liao JC, Cheng Z, Gambhir SS. Endoscopic imaging of Cerenkov luminescence. Biomedical Optics Express. 2012;3(6):1215. doi: 10.1364/BOE.3.001215. [DOI] [PMC free article] [PubMed] [Google Scholar]
- Krizan P. Recent progress in Cerenkov counters. IEEE Transactions on Nuclear Science. 2001;48(4):941–949. [Google Scholar]
- Li C, Mitchell GS, Cherry SR. Cerenkov luminescence tomography for small animal imaging. Optics Letters. 2010;35(7):1109–1111. doi: 10.1364/OL.35.001109. [DOI] [PMC free article] [PubMed] [Google Scholar]
- Liu H, Carpenter CM, Jiang H, Pratx G, Sun C, Buchin MP, et al. Intraoperative imaging of tumors using Cerenkov luminescence endoscopy: A feasibility experimental study. Journal of Nuclear Medicine. 2012;53(10):1579–1584. doi: 10.2967/jnumed.111.098541. [DOI] [PMC free article] [PubMed] [Google Scholar]
- Liu H, Ren G, Miao Z, Zhang X, Tang X, Han P, et al. Molecular optical imaging with radioactive probes. PLoS One. 2010;5(3):e9470. doi: 10.1371/journal.pone.0009470. [DOI] [PMC free article] [PubMed] [Google Scholar]
- Liu H, Zhang X, Xing B, Han P, Gambhir SS, Cheng Z. Radiation luminescence excited quantum dots for in vivo multiplexed optical imaging. Small. 2010;6(10):1087–1091. doi: 10.1002/smll.200902408. [DOI] [PubMed] [Google Scholar]
- Mariani G, Erba P, Villa G, Gipponi M, Manca G, Boni G, et al. Lymphoscintigraphic and intraoperative detection of the sentinel lymph node in breast cancer patients: The nuclear medicine perspective. Journal of Surgical Oncology. 2004;85(3):112–122. doi: 10.1002/jso.20023. [DOI] [PubMed] [Google Scholar]
- McDevitt MR, Scheinberg DA. Ac 225 and her daughters: The many faces of Shiva. Cell Death and Differentiation. 2002;9(6):593–594. doi: 10.1038/sj.cdd.4401047. [DOI] [PubMed] [Google Scholar]
- Mitchell GS, Gill RK, Boucher DL, Li C, Cherry SR. In vivo Cerenkov luminescence imaging: A new tool for molecular imaging. Philosophical Transactions. Series A, Mathematical, Physical, and Engineering Sciences. 2011;369(1955):4605–4619. doi: 10.1098/rsta.2011.0271. [DOI] [PMC free article] [PubMed] [Google Scholar]
- Parker RP, Elrick RH. The assay of beta-emitting radioisotopes using Cerenkov counting. The International Journal of Applied Radiation and Isotopes. 1966;17(6):361–362. doi: 10.1016/0020-708x(66)90133-5. [DOI] [PubMed] [Google Scholar]
- Rice BW, Cable MD, Nelson MB. In vivo imaging of light-emitting probes. Journal of Biomedical Optics. 2001;6(4):432–440. doi: 10.1117/1.1413210. [DOI] [PubMed] [Google Scholar]
- Robertson R, Germanos MS, Li C, Mitchell GS, Cherry SR, Silva MD. Optical imaging of Cerenkov light generation from positron-emitting radio-tracers. Physics in Medicine and Biology. 2009;54(16):N355–N365. doi: 10.1088/0031-9155/54/16/N01. [DOI] [PMC free article] [PubMed] [Google Scholar]
- Robertson R, Germanos MS, Manfredi MG, Smith PG, Silva MD. Multimodal imaging with (18)F-FDG PET and Cerenkov luminescence imaging after MLN4924 treatment in a human lymphoma xenograft model. Journal of Nuclear Medicine. 2011;52(11):1764–1769. doi: 10.2967/jnumed.111.091710. [DOI] [PubMed] [Google Scholar]
- Ross HH. Measurement of .beta. emitting nuclides using Cerenkov radiation. Analytical Chemistry. 1969;41(10):1260–1265. [Google Scholar]
- Ruggiero A, Holland JP, Lewis JS, Grimm J. Cerenkov luminescence imaging of medical isotopes. Journal of Nuclear Medicine. 2010;51(7):1123–1130. doi: 10.2967/jnumed.110.076521. [DOI] [PMC free article] [PubMed] [Google Scholar]
- Sowerby BD. Cerenkov detectors for low-energy gamma rays. Nuclear Instruments & Methods. 1971;97(1):145–149. [Google Scholar]
- Spinelli AE, Boschi F. Optimizing in vivo small animal Cerenkov luminescence imaging. Journal of Biomedical Optics. 2012;17(4):040506. doi: 10.1117/1.JBO.17.4.040506. [DOI] [PubMed] [Google Scholar]
- Spinelli AE, D’Ambrosio D, Calderan L, Marengo M, Sbarbati A, Boschi F. Cerenkov radiation allows in vivo optical imaging of positron emitting radio-tracers. Physics in Medicine and Biology. 2010;55(2):483–495. doi: 10.1088/0031-9155/55/2/010. [DOI] [PubMed] [Google Scholar]
- Spinelli AE, Ferdeghini M, Cavedon C, Zivelonghi E, Calandrino R, Fenzi A, et al. First human Cerenkography. Journal of Biomedical Optics. 2013;18(2):20502. doi: 10.1117/1.JBO.18.2.020502. [DOI] [PubMed] [Google Scholar]
- Spinelli AE, Kuo C, Rice BW, Calandrino R, Marzola P, Sbarbati A, et al. Multispectral Cerenkov luminescence tomography for small animal optical imaging. Optics Express. 2011;19(13):12605–12618. doi: 10.1364/OE.19.012605. [DOI] [PubMed] [Google Scholar]
- Themelis G, Yoo JS, Soh KS, Schulz R, Ntziachristos V. Real-time intraoperative fluorescence imaging system using light-absorption correction. Journal of Biomedical Optics. 2009;14(6):064012. doi: 10.1117/1.3259362. [DOI] [PubMed] [Google Scholar]
- Thorek DL, Abou DS, Beattie BJ, Bartlett RM, Huang R, Zanzonico PB, et al. Positron lymphography: Multimodal, high resolution, dynamic mapping and resection of lymph nodes after intradermal injection of 18F FDG. Journal of Nuclear Medicine. 2012;53(9):1438–1445. doi: 10.2967/jnumed.112.104349. [DOI] [PMC free article] [PubMed] [Google Scholar]
- Thorek DLJ, Das S, Grimm J. Molecular imaging using nanoparticle quenchers of Cerenkov luminescence. Small. 2014 doi: 10.1002/smll.201400733. [DOI] [PMC free article] [PubMed] [Google Scholar]
- Thorek DL, Ogirala A, Beattie BJ, Grimm J. Quantitative imaging of disease signatures through radioactive decay signal conversion. Nature Medicine. 2013;19(10):1345–1350. doi: 10.1038/nm.3323. [DOI] [PMC free article] [PubMed] [Google Scholar]
- Thorek DL, Riedl CC, Grimm J. Clinical Cerenkov luminescence imaging of 18F-FDG. Journal of Nuclear Medicine. 2014;55(1):95–98. doi: 10.2967/jnumed.113.127266. [DOI] [PMC free article] [PubMed] [Google Scholar]
- Thorek D, Robertson R, Bacchus WA, Hahn J, Rothberg J, Beattie BJ, et al. Cerenkov imaging—A new modality for molecular imaging. American Journal of Nuclear Medicine and Molecular Imaging. 2012;2(2):163–173. [PMC free article] [PubMed] [Google Scholar]
- Tokin CA, Cope FO, Metz WL, Blue MS, Potter BM, Abbruzzese BC, et al. The efficacy of Tilmanocept in sentinel lymph mode mapping and identification in breast cancer patients: A comparative review and meta analysis of the (9)(9)mTc-labeled nanocolloid human serum albumin standard of care. Clinical & Experimental Metastasis. 2012;29(7):681–686. doi: 10.1007/s10585-012-9497-x. [DOI] [PubMed] [Google Scholar]
- van Dam GM, Themelis G, Crane LM, Harlaar NJ, Pleijhuis RG, Kelder W, et al. Intraoperative tumor-specific fluorescence imaging in ovarian cancer by folate receptor-alpha targeting: First in human results. Nature Medicine. 2011;17:1315–1319. doi: 10.1038/nm.2472. [DOI] [PubMed] [Google Scholar]
- Vermeeren L, Valdes Olmos RA, Meinhardt W, Horenblas S. Intraoperative imaging for sentinel node identification in prostate carcinoma: Its use in combination with other techniques. Journal of Nuclear Medicine. 2011;52(5):741–744. doi: 10.2967/jnumed.110.085068. [DOI] [PubMed] [Google Scholar]
- Weissleder R, Ntziachristos V. Shedding light onto live molecular targets. Nature Medicine. 2003;9(1):123–128. doi: 10.1038/nm0103-123. [DOI] [PubMed] [Google Scholar]
- Wolfs E, Holvoet B, Gijsbers R, Casteels C, Roberts SJ, Struys T, et al. Optimization of multimodal imaging of mesenchymal stem cells using the human sodium iodide symporter for PET and Cerenkov luminescence imaging. PLoS One. 2014;9(4):e94833. doi: 10.1371/journal.pone.0094833. [DOI] [PMC free article] [PubMed] [Google Scholar]
- Xu Y, Chang E, Liu H, Jiang H, Gambhir SS, Cheng Z. Proof-of-concept study of monitoring cancer drug therapy with Cerenkov luminescence imaging. Journal of Nuclear Medicine. 2012;53(2):312–317. doi: 10.2967/jnumed.111.094623. [DOI] [PMC free article] [PubMed] [Google Scholar]
- Yang W, Qin W, Hu Z, Suo Y, Zhao R, Ma X, et al. Comparison of Cerenkov luminescence imaging (CLI) and gamma camera imaging for visualization of let-7 expression in lung adenocarcinoma A549 Cells. Nuclear Medicine and Biology. 2012;39(7):948–953. doi: 10.1016/j.nucmedbio.2012.05.004. [DOI] [PubMed] [Google Scholar]
- Yoo WJ, Han KT, Shin SH, Seo JK, Jeon D, Lee B. Development of a Cerenkov radiation sensor to detect low-energy beta particles. Applied Radiation and Isotopes. 2013;81:196–200. doi: 10.1016/j.apradiso.2013.03.075. [DOI] [PubMed] [Google Scholar]
- Zhang J, Hu H, Liang S, Yin J, Hui X, Hu S, et al. Targeted radiotherapy with tumor vascular homing trimeric GEBP11 peptide evaluated by multimodality imaging for gastric cancer. Journal of Controlled Release. 2013;172(1):322–329. doi: 10.1016/j.jconrel.2013.08.033. [DOI] [PubMed] [Google Scholar]