

Abstract
Background
Evidence consistently shows that almond consumption beneficially affects lipids and lipoproteins. Almonds, however, have not been evaluated in a controlled‐feeding setting using a diet design with only a single, calorie‐matched food substitution to assess their specific effects on cardiometabolic risk factors.
Methods and Results
In a randomized, 2‐period (6 week/period), crossover, controlled‐feeding study of 48 individuals with elevated LDL‐C (149±3 mg/dL), a cholesterol‐lowering diet with almonds (1.5 oz. of almonds/day) was compared to an identical diet with an isocaloric muffin substitution (no almonds/day). Differences in the nutrient profiles of the control (58% CHO, 15% PRO, 26% total fat) and almond (51% CHO, 16% PRO, 32% total fat) diets were due to nutrients inherent to each snack; diets did not differ in saturated fat or cholesterol. The almond diet, compared with the control diet, decreased non‐HDL‐C (−6.9±2.4 mg/dL; P=0.01) and LDL‐C (−5.3±1.9 mg/dL; P=0.01); furthermore, the control diet decreased HDL‐C (−1.7±0.6 mg/dL; P<0.01). Almond consumption also reduced abdominal fat (−0.07±0.03 kg; P=0.02) and leg fat (−0.12±0.05 kg; P=0.02), despite no differences in total body weight.
Conclusions
Almonds reduced non‐HDL‐C, LDL‐C, and central adiposity, important risk factors for cardiometabolic dysfunction, while maintaining HDL‐C concentrations. Therefore, daily consumption of almonds (1.5 oz.), substituted for a high‐carbohydrate snack, may be a simple dietary strategy to prevent the onset of cardiometabolic diseases in healthy individuals.
Clinical Trial Registration
URL: www.clinicaltrials.gov; Unique Identifier: NCT01101230.
Keywords: abdominal fat, cardiometabolic disease, diet, lipids and lipoproteins, cardiovascular disease risk factors
Introduction
Cardiovascular disease (CVD) is the leading cause of morbidity and mortality in the United States and worldwide and continues to be a major public health problem.1–2 A cardioprotective diet is the gold standard intervention strategy for the prevention and treatment of CVD in all individuals, including those already on drug therapy.3–4
The 2010 Global Burden of Disease Study reported low nut and seed consumption as the leading dietary risk factor attributable to ischemic heart disease.5 Furthermore, the FDA issued a Qualified Health Claim for nuts and heart disease in 2003,6 and both the 2010 Dietary Guidelines and the AHA 2020 Dietary Goals include nuts in their recommendations for a healthy diet.7–8 Prospective cohort studies consistently show that nuts reduce the risk of CVD and all‐cause mortality,9–13 and nut intervention studies demonstrate a cholesterol‐lowering effect.14 The PREDIMED trial found a ≈30% reduction in major cardiovascular events in individuals who consumed a Mediterranean diet (MeDiet) supplemented with either 30 g/day of nuts (almonds, walnuts, and hazelnuts) or 50 g/day (1 L/week per family) of extra‐virgin olive oil compared with individuals who were advised to decrease their dietary fat intake.15 The authors also reported increased mean LDL particle size and decreased waist circumference (WC) in the group consuming nuts, suggesting novel cardiometabolic mechanisms by which nuts may decrease CVD risk.16
The hypocholesterolemic effects of almond consumption are well established; evidence shows that almonds dose‐dependently decrease LDL‐C,17–19 which is attributable to their unsaturated fatty acid profile, phytosterol and fiber content, and other bioactives.20 Almonds also reduce additional cardiometabolic risk factors, including fasting21 and postprandial22 glucose, insulin resistance21,23 and insulin secretion,24 and several inflammatory markers.25–26 Furthermore, within the context of a weight‐loss intervention, a diet containing 84 g/day of almonds decreased WC by 14% compared with a 9% decrease with an isocaloric, complex carbohydrate control diet.27 A greater understanding of how almonds, consumed as a snack (substituted for a high‐carbohydrate food), affect intermediary markers of CVD, such as lipoprotein metabolism and body composition, is necessary to advance evidence‐based dietary guidance to improve heart health. The objective of the present study was to compare a cholesterol‐lowering diet with almonds (1.5 oz./day) to the same diet with a single, calorie‐matched food (ie, a muffin) in a controlled‐feeding setting. Our hypothesis was that almonds would improve lipids, lipoproteins, and apolipoproteins (apo) and decrease abdominal adiposity in adults with elevated LDL‐C.
Methods
Study Population
Men and women (30 to 65 years) with a BMI of 20 to 35 kg/m2 and LDL‐C ≥121 to 190 for females and 128 to 194 mg/dL for males (50 to 95th percentile based on NHANES data) who were free of any chronic illness and did not use tobacco were eligible for the study. Exclusion criteria included: alcohol consumption ≥14 servings/week; refusal to stop vitamin/mineral, lipid‐lowering, or other supplements; use of prescription cholesterol‐lowering medications; vegetarian diet; weight gain/loss of ≥10% within the previous 6 months; and pregnant, lactating, or wanting to become pregnant before or during the study. A complete blood count and standard chemistry profile were obtained at screening to rule out the presence of serious illness (eg, autoimmune disease, cancer, and immunodeficiency). Seated blood pressure (BP) was measured by nurses in a controlled environment using a calibrated mercury sphygmomanometer and appropriately sized cuffs after a 5‐minute quiet rest according to JNC 7 guidelines.28 Three readings were taken, and the average of the last 2 readings was used to determine eligibility for study participation. The BP criterion (systolic BP (SBP) ≤140 mm Hg and diastolic BP (DBP) ≤90 mm Hg) was established to avoid the inclusion of persons with unmedicated stage 1 hypertension.
Recruitment and Ethical Aspects
Participants were recruited through university emails, local newspaper and television ads, and flyers posted around campus and town. Six hundred fifty‐three potential participants called to express interest in the study. They were given information about the study and, if interested, were asked a series of medical and lifestyle questions. Of the 653 respondents, 143 met the study criteria and were scheduled for a clinic‐screening visit at the Penn State General Clinical Research Center (GCRC). After written informed consent was obtained, a screening blood sample was drawn, BP measured, and body weight and height obtained to calculate BMI. Of the 143 persons who were screened, 61 met study criteria and were randomized to a treatment sequence. Twelve participants withdrew before completing the study (diet issues [n=4], non‐compliant [n=4], time restraints [n=2], unrelated illness [n=1], moved out of area [n=1]). One participant was removed from the statistical analysis due to a pre‐existing metabolic condition (eg, lost >10% of baseline body weight [9.5 kg] during the study) that should have caused initial exclusion from the study but was not brought to the research staff's attention until the participant had completed the study. Thus, 48 participants completed the entire study and were included in the final analysis (Figure 1). A computer‐generated randomization scheme was developed in advance (by C. E. B.) to randomize the 2 treatment sequences (almond/control or control/almond). Each participant signed a written informed consent and the study protocol was approved by the Institutional Review Board of the Pennsylvania State University.
Figure 1.
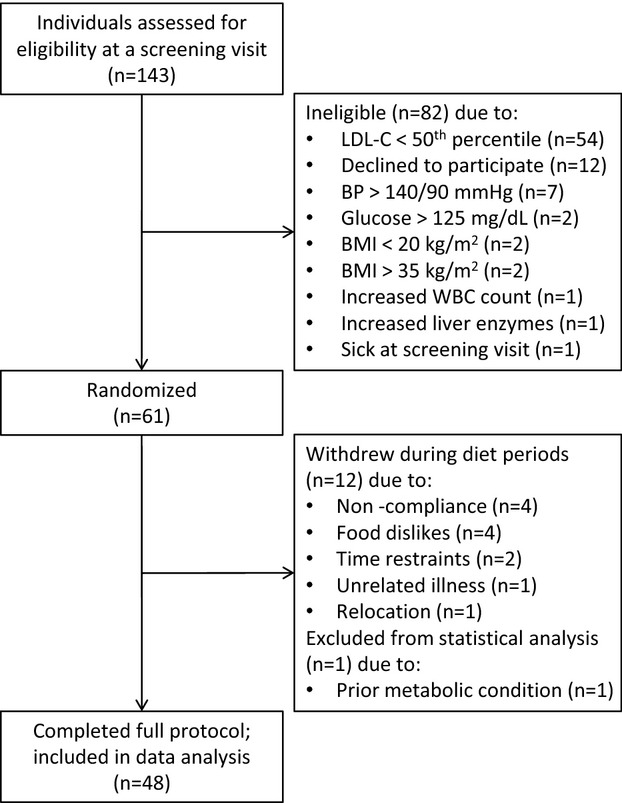
Schematic of participant flow through the study. BMI indicates body mass index; BP, blood pressure; LDL‐C, low‐density lipoprotein cholesterol.
Study Design and Intervention
Rolling recruitment took place between October 2009 and February 2012. Individual participants were enrolled and randomized (by C. E. B.) to a 2‐period, crossover, controlled‐feeding trial designed to evaluate the effects of a cholesterol‐lowering almond diet versus the same diet with a single‐food substitution (control). All meals and snacks were prepared in one of the Penn State Metabolic Kitchens and weighed to the nearest gram. Participants picked up their food Monday through Friday and were provided food “pack‐outs” for Saturday and Sunday. Diets were identical with the exception of the snack that was provided, either 42.5 g (1.5 oz.) unsalted, whole, natural almonds with skins (253 kcal/day) or 106 g banana muffin+2.7 g butter (273 kcal/day). Thus, differences in the nutrient profiles of the control diet and almond diet were due to the nutrient profile provided by each snack (Table 1). Test diets were created using Food Processor SQL software, version 10.8 (ESHA Research, Salem, OR) (Table 2). A 6‐day menu cycle was developed in 300 kcal increments for a range of calorie needs (1800 to 3900 kcal). Calorie needs were determined using the Harris‐Benedict equation and adjustments were made as needed to maintain participants’ weight throughout the study. Mean caloric intake for the almond (2565±70 kcal/day) and control (2512±70 kcal/day) diets did not differ (P=0.07). A sample 1‐day menu is provided in Table 3. Compliance was assessed by daily weigh‐ins (Monday through Friday) and daily food logs (Monday through Sunday) to assure that participants were eating all and only study foods. Participants were instructed to maintain consistent physical activity and lifestyle habits.
Table 1.
Nutrient Profile of Each Snack Food
| Almonds (42.5 g) | Muffin (106 g)*+Butter (2.7 g) | |
|---|---|---|
| Calories, kcal | 253 | 273 |
| Protein, g | 9.0 | 3.3 |
| Carbohydrate, g | 9.0 | 47.9 |
| Fat, g | 22.1 | 8.5 |
| SFA, g | 1.7 | 2.0 |
| MUFA, g | 13.8 | 5.7 |
| PUFA, g | 5.5 | 0.4 |
| Cholesterol, mg | 0.0 | 5.8 |
| Fiber, g | 4.6 | 1.7 |
| Sodium, mg | 1 | 150 |
| Potassium, mg | 303 | 221 |
| Calcium, mg | 114 | 19 |
| Iron, mg | 2 | 1 |
All values were determined using The Food Processor SQL (version 10.8.0; ESHA Research, Salem, OR). MUFA indicates monounsaturated fatty acids; PUFA, polyunsaturated fatty acids; SFA, saturated fatty acids.
Muffin recipe (106 g): banana, fresh (50.9 g); sugar, white, granulated (21.8 g); baking soda (0.3 g); baking powder, double acting (0.3 g); flour, all purpose, white, bleached, enriched, sifted (19.6 g); vanilla extract (0.5 g); egg white (6.6 g), sunflower oil, greater than 70% oleic (6.1 g).
Table 2.
Nutrient Composition of the Almond Diet and the Control Diet
| Almond Diet | Control Diet | |
|---|---|---|
| Protein, % of kcal (g) | 16.4 (87) | 15.2 (81) |
| Carbohydrate, % of kcal (g) | 51.3 (270) | 58.4 (310) |
| Fat, % of kcal (g) | 32.3 (76) | 26.4 (62) |
| SFA, % of kcal (g) | 7.7 (18) | 7.8 (18) |
| MUFA, % of kcal (g) | 13.9 (33) | 10.4 (24) |
| PUFA, % of kcal (g) | 8.4 (20) | 6.2 (15) |
| Cholesterol, mg | 116 | 122 |
| Fiber, g | 26.1 | 23.1 |
| Sodium, mg | 3070 | 3220 |
| Potassium, mg | 2880 | 2800 |
| Calcium, mg | 1320 | 1220 |
| Iron, mg | 17 | 16 |
On the basis of 2100 kcal/day and averaged across a 6‐day menu cycle. All values were determined using The Food Processor SQL (version 10.8.0; ESHA Research, Salem, OR). MUFA indicates monounsaturated fatty acids; PUFA, polyunsaturated fatty acids; SFA, saturated fatty acids.
Table 3.
One‐Day Sample Menu for the Almond Diet and the Control Diet
| Meal | Study Diet |
|---|---|
| Breakfast | Banana (118 g) |
| Mini bagel, cinnamon raisin (52 g) | |
| Cheerios (28 g) | |
| Margarine (10 g) | |
| Apple juice, unsweetened (124 g) | |
| Milk, 2% (244 g) | |
| Lunch | Grapes (69 g) |
| Multigrain chips, original (28 g) | |
| Celery sticks (60 g) | |
| Broccoli (36 g) | |
| Salad dressing, fat‐free Thousand Island (43 g) | |
| Cereal bar, apple cinnamon (30 g) | |
| Prepared meal, chicken club panini (170 g) | |
| Dinner | Lettuce, romaine (47 g) |
| Carrots (40 g) | |
| Tomatoes, cherry (37 g) | |
| Salad dressing, fat‐free Italian (43 g) | |
| Dinner roll (50 g) | |
| Margarine (10 g) | |
| Prepared meal, meatloaf w/ gravy & whipped potatoes (266 g) | |
| Snack | Almonds, unsalted (43 g) |
| OR | |
| Banana muffin (106 g) | |
| Butter (3 g) |
Based on a 2100 kcal/day menu.
Clinical Visits and Blood Sample Collection
Participants completed a series of clinical and physical assessments on 2 consecutive days at baseline (week 0) and at the end of diet period (DP) 1 (week 6) and DP2 (week 14). A 2‐week compliance break separated diet periods. At each visit, participants arrived in the fasted state (12 hours water only, 48 hours no alcohol, and 12 hours without vigorous exercise) at the GCRC where body weight and blood samples (≈30 mL on each day) were obtained. Whole blood was drawn into either serum separator tubes or EDTA‐containing tubes, centrifuged at 4°C for 15 minutes, and stored at −80°C until further analyses. Height was measured at baseline. Seated BP and body composition measures were obtained on the first day of both the baseline visit and each endpoint visit. Nurses trained on the study protocol, who drew blood and measured blood pressure and body composition, were unaware of treatment group assignment.
Assays
Serum lipids, lipoproteins, and apolipoproteins
Total cholesterol (TC) and triglycerides (TG) were determined by standard enzymatic and spectrophotometry procedures (Quest Diagnostics, Pittsburgh, PA; CV <2%). HDL‐C was measured according to the modified heparin‐manganese procedure (CV <2%). LDL‐C was calculated using the Friedewald equation [LDL‐C=TC−(HDL‐C+TG/5)]. In addition, a comprehensive lipid profile was assayed by the vertical auto profile (VAP) method (Atherotech, Birmingham, AL; CV <3%), which uses a density gradient ultracentrifugation technique.29 This assay quantifies cholesterol concentrations of total lipoprotein, HDL, LDL, very‐low‐density lipoprotein (VLDL), lipoprotein(a) [Lp(a)], intermediate‐density lipoprotein (IDL), and HDL, LDL, VLDL, and IDL subclasses. Remnant lipoproteins are defined as IDL+VLDL3. TG were independently measured (Atherotech, Birmingham, AL; CV <1%). ApoB and apoA1 were calculated using results from the VAP test and patented equations (Atherotech, Birmingham, AL).30–31
Serum glucose and high‐sensitivity C‐reactive protein (CRP)
Glucose was quantified by spectrophotometry (Quest Diagnostics, Pittsburgh, PA). Serum CRP was measured by latex‐enhanced immunonephelometry (Quest Diagnostics; assay CV <8%).
Body Composition Measurements
Waist circumference
WC was measured just above the ileac crest according to standardized techniques.32 Two consecutive measurements were recorded to the nearest tenth of a centimeter; the average of the 2 measures was used to determine WC.
Dual‐energy X‐ray absorptiometry (DXA)
Whole body DXA scans were obtained according to manufacturer recommended procedures (QDR‐4500W; Hologic Corp, Waltham, MA). Participants wore a cotton t‐shirt and shorts and removed all jewelry and personal items that could interfere with the scan. The scans were reviewed and analyzed by a certified technician at the GCRC using industry standards. Scans were analyzed with APEX System software version 2.3.1 in its default configuration. DXA scans provided whole and sub‐regional body composition, including the leg region, comprised of both legs, and the abdominal region, measured within a 50‐cm2 area around the center point of the midline between the lateral iliac crests and the lowest rib margins.
Statistical Analysis
Statistical analyses were performed using SAS (version 9.2; SAS Institute, Cary, NC). Two‐sample t tests (PROC TTEST) were used to determine significant differences between sexes at baseline for each outcome variable. Normality for each variable was assessed using the univariate procedure (PROC UNIVARIATE) to quantitatively evaluate skewness and visually inspect box and probability plots. Change scores were calculated by subtracting baseline values from each endpoint. Treatment effects were tested per protocol (participants completing the entire study were included in the analysis) using the mixed models procedure (PROC MIXED). For the outcome analyses, treatment, visit, and treatment by visit interactions were considered fixed effects and subject was treated as a random effect. Two outliers were observed for the WC variable and, when deleted, revealed a significant result; these data were justifiably removed due to measurement error (ie, 24.6 cm increase and 16.1 cm decrease in WC). When visit or treatment by visit P values were <0.02, they were retained in the final model. For all significant outcomes, no treatment by visit (carry‐over) effects were observed. The nonparametric procedure (PROC NPAR1WAY) Kruskal‐Wallis test was performed to evaluate median treatment effects for CRP change, which did not meet assumptions of normality and contained numerous outliers for which data transformations could not correct. To correct for multiple endpoint testing, the adaptive linear step‐up procedure (BKY) developed by Benjamini and colleagues33 was utilized, indicating statistical significance at α ≤0.023. The study sample size was estimated with power set to 0.90 and α set to 0.05, which predicted a sample size of 26 participants to detect a 10% change in LDL‐C,34 our primary outcome variable, and a sample size of 44 to detect a 5% change in abdominal adiposity, a secondary outcome.35
Results
Participants were generally healthy, middle‐aged, overweight, and had elevated TC and LDL‐C levels. Baseline characteristics of participants (n=48) are presented in Table 4; females (n=26) were older, had higher TC and HDL‐C, and lower DBP and TG than males (n=22) (P<0.05). Despite these differences at baseline, no significant interactions of sex by outcome measure were shown, except for glucose (discussed below); thus, we combined males and females for all analyses. Participant adherence to the study diets was 85% based on daily self‐reporting forms, which indicated very minor deviations on occasion. Mean participant weight was maintained within 1.6 kg during the study.
Table 4.
Baseline Characteristics of Study Participants
| Sex | Combined | ||
|---|---|---|---|
| Females | Males | ||
| N (%) | 26 (54) | 22 (46) | 48 (100) |
| Age, y | 54.0±6.1 | 45.0±10.2* | 49.9±9.4 |
| Race, n (%) | |||
| White | 25 (96) | 20 (91) | 45 (94) |
| Black | 0 (0) | 1 (5) | 1 (2) |
| Asian | 1 (4) | 1 (5) | 2 (4) |
| Hispanic | 0 (0) | 0 (0) | 0 (0) |
| Body mass index, kg/m² | 25.8±3.1 | 26.7±2.5 | 26.2±2.8 |
| Blood pressure, mm Hg | |||
| Systolic | 114±13 | 118±7 | 116±11 |
| Diastolic | 77±8 | 81±6* | 78±7 |
| Lipids/lipoproteins, mg/dL | |||
| Total cholesterol | 236±22 | 218±24* | 228±25 |
| LDL‐C | 152±21 | 144±18 | 149±20 |
| HDL‐C | 63±17 | 46±8* | 55±16 |
| Triglycerides* | 94 (74 to 125) | 128 (120 to 162)* | 117 (90 to 143) |
| Glucose, mg/dL | 89±9 | 90±9 | 89±9 |
| C‐reactive protein, mg/L* | 0.75 (0.50 to 1.40) | 0.90 (0.50 to 1.30) | 0.90 (0.50 to 1.40) |
Values are mean±standard deviation and were obtained using the UNIVARIATE procedure in SAS. HDL‐C indicates high‐density lipoprotein cholesterol; LDL‐C, low‐density lipoprotein cholesterol.
Significant (P≤0.05) differences between sexes at baseline for each outcome were determined using the 2‐sample t test in SAS.
Median; interquartile range in parentheses.
Lipids, Lipoproteins, and Apolipoproteins
The almond diet decreased non‐HDL‐C (−18±3 versus −11±3 mg/dL; P=0.01) and LDL‐C (−19±2 versus −14±2 mg/dL; P=0.01) compared with the control diet. In addition, the almond diet reduced HDL‐C significantly less than the control diet (−4.1±1.0 versus −5.9±1.0 mg/dL; P<0.01) (Table 5).
Table 5.
Effects of Treatment on Metabolic Parameters
| Variable | Baseline | Almond | Control | Mean Difference Almond‐Control | Treat P Value* | Visit P Value* |
|---|---|---|---|---|---|---|
| Lipids/lipoproteins, mg/dL | ||||||
| Total cholesterol | 228±4 | 206±4 | 211±4 | −5.1±2.4 | 0.04 | 0.03 |
| Non‐HDL‐C | 173±3 | 155±4 | 162±4 | −6.9±2.4 | 0.01 | 0.06 |
| LDL‐C | 149±3 | 129±3 | 135±3 | −5.3±1.9 | 0.01 | 0.01 |
| LDL1 | 21.4±0.9 | 17.7±0.8 | 19.1±0.8 | −1.3±0.8 | 0.12 | 0.04 |
| LDL2 | 27.1±2.2 | 19.7±1.8 | 17.5±1.7 | 2.4±1.2 | 0.06 | 0.05 |
| LDL3 | 59.1±2.2 | 49.5±2.2 | 51.8±1.7 | −2.1±1.4 | 0.13 | 0.17 |
| LDL4 | 17.9±1.9 | 20.2±2.2 | 21.4±1.9 | −1.2±1.7 | 0.47 | n/a |
| IDL‐C | 16.9±0.9 | 16.2±0.8 | 18.0±0.9 | −1.65±0.82 | 0.05 | 0.09 |
| IDL1 | 5.1±0.4 | 5.0±0.3 | 5.9±0.4 | −0.81±0.30 | 0.01 | 0.08 |
| IDL2 | 11.8±0.5 | 11.2±0.5 | 12.1±0.6 | −0.86±0.57 | 0.14 | 0.11 |
| Lipoprotein(a) | 7.4±0.7 | 7.7±0.8 | 6.7±0.8 | 0.98±0.49 | 0.05 | 0.13 |
| VLDL‐C | 24.9±1.0 | 25.1±1.1 | 27.4±1.3 | −2.31±0.94 | 0.02 | n/a |
| VLDL1+2 | 10.7±0.5 | 10.9±0.6 | 11.9±0.7 | −0.99±0.54 | 0.07 | n/a |
| VLDL3 | 14.3±0.6 | 14.3±0.5 | 15.5±0.6 | −1.17±0.48 | 0.02 | 0.17 |
| Remnant lipoproteins | 31.2±1.4 | 30.4±1.2 | 33.4±1.5 | −2.83±1.25 | 0.03 | 0.10 |
| HDL‐C | 54.8±2.3 | 50.6±2.0 | 48.9±1.8 | 1.7±0.6 | 0.004 | 0.17 |
| HDL2 | 12.5±0.9 | 11.3±0.7 | 10.6±0.6 | 0.7±0.3 | 0.02 | 0.03 |
| HDL3 | 41.0±1.4 | 38.8±1.3 | 37.4±1.1 | 1.3±0.5 | 0.01 | n/a |
| Triglycerides | 122±7 | 131±8 | 137±8 | −7.2±6.0 | 0.24 | 0.32 |
| Apolipoproteins, mg/dL | ||||||
| ApoB | 113±2 | 103±2 | 108±2 | −4.2±1.6 | 0.01 | 0.07 |
| ApoA1 | 156±4 | 150±3 | 148±3 | 2.5±1.3 | 0.06 | 0.10 |
| Lipid and apolipoprotein ratios | ||||||
| Total cholesterol: HDL‐C | 4.43±0.16 | 4.26±0.13 | 4.50±0.13 | −0.23±0.06 | <0.001 | n/a |
| LDL‐C: HDL‐C | 2.92±0.12 | 2.69±0.09 | 2.88±0.09 | −0.20±0.05 | <0.001 | n/a |
| ApoB: apoA1 | 0.75±0.02 | 0.70±0.02 | 0.74±0.02 | −0.04±0.01 | 0.003 | n/a |
| Additional metabolic parameters | ||||||
| Glucose, mg/dL | 89.4±1.3 | 87.2±1.4 | 87.7±1.3 | −0.7±1.5 | 0.61 | 0.05 |
| C‐reactive protein, mg/L* | 1.37±0.24 | 1.00±0.16 | 1.64±0.37 | −0.34±0.18 | 0.03 | n/a |
Data are mean±standard error, n=48. Apo indicates apolipoprotein; HDL‐C, high‐density lipoprotein cholesterol; IDL‐C, intermediate‐density lipoprotein cholesterol; LDL‐C, low‐density lipoprotein cholesterol; VLDL‐C, very low‐density lipoprotein cholesterol.
Statistical significance assessed by PROC MIXED in SAS, P≤0.023. The treatment effect tested differences in metabolic parameters between the Almond and Control diets. The visit effect tested differences in metabolic parameters between diet period 1 and 2.
Statistical significance assessed by NPAR1WAY (Kruskal–Wallis test) in SAS, P≤0.023.
There were no treatment effects for LDL1, LDL2, LDL3, or LDL4; however, the almond diet significantly improved IDL1 (−0.06±0.33 versus 0.76±0.33 mg/dL; P=0.01), total VLDL (0.15±0.91 versus 2.46±0.91 mg/dL; P=0.02), VLDL3 (0.01±0.49 versus 1.18±0.49 mg/dL; P=0.02), and apoB (−9.7±1.8 versus −5.5±1.8 mg/dL; P=0.01) compared with the control diet. Furthermore, the almond diet reduced HDL2 (−1.2±0.4 versus −1.9±0.4 mg/dL; P=0.02) and HDL3 (−2.3±0.7 versus −3.6±0.7 mg/dL; P=0.01) significantly less than the control diet. Almond consumption also decreased the TC/ HDL‐C (−0.17±0.08 versus 0.06±0.08; P<0.01), LDL‐C/ HDL‐C (−0.23±0.07 versus −0.03±0.07; P<0.01), and apoB/ apoA1 (−0.04±0.01 versus −0.00±0.01; P<0.01) ratios (Table 5).
Body Composition
Total mass (ie, body weight), total fat mass, and total lean mass did not differ between treatments. The almond diet reduced abdominal mass (−0.28±0.09 versus −0.09±0.09 kg; P=0.02) and abdominal fat mass (−0.13±0.03 versus −0.06±0.03 kg; P=0.02) compared with the control diet. These findings were validated by WC, which also decreased with the almond diet (−1.7±0.4 versus −0.9±0.4 cm; P=0.02). In addition, almond consumption reduced leg fat mass (−0.26±0.06 versus −0.14±0.06 kg; P=0.02) (Table 6, Figure 2).
Table 6.
Effects of Treatment on Body Composition Measures
| Variable | Baseline | Almond | Control | Mean Difference Almond‐Control | Treat P Value* | Visit P Value* |
|---|---|---|---|---|---|---|
| Total body composition | ||||||
| Waist circumference, cm | 93.2±1.2 | 91.6±1.2 | 92.3±1.2 | −0.8±0.3 | 0.02 | 0.05 |
| Mass, kg | 74.7±1.5 | 73.1±1.5 | 73.4±1.5 | −0.3±0.2 | 0.05 | 0.11 |
| Fat mass, kg | 22.1±0.9 | 21.3±0.9 | 21.5±0.9 | −0.2±0.1 | 0.15 | n/a |
| Lean mass, kg | 50.1±1.5 | 49.2±1.5 | 49.3±1.4 | −0.1±0.2 | 0.44 | 0.47 |
| Abdominal composition, kg | ||||||
| Mass | 6.70±0.19 | 6.42±0.18 | 6.61±0.20 | −0.19±0.08 | 0.02 | n/a |
| Fat mass | 2.11±0.13 | 1.98±0.12 | 2.05±0.13 | −0.07±0.03 | 0.02 | n/a |
| Lean mass | 4.53±0.08 | 4.38±0.08 | 4.50±0.10 | −0.12±0.06 | 0.04 | n/a |
| Leg composition, kg | ||||||
| Mass | 25.0±0.5 | 24.5±0.5 | 24.6±0.5 | −0.15±0.08 | 0.07 | 0.10 |
| Fat mass | 7.8±0.4 | 7.6±0.4 | 7.7±0.4 | −0.12±0.05 | 0.02 | n/a |
| Lean mass | 16.2±0.5 | 15.9±0.5 | 16.0±0.5 | −0.02±0.06 | 0.71 | 0.08 |
Data are mean±standard error, n=48.
Statistical significance assessed by PROC MIXED in SAS, P≤0.023. The treatment effect tested differences in body composition between the Almond and Control diets. The visit effect tested differences in body composition between diet period 1 and 2.
Figure 2.
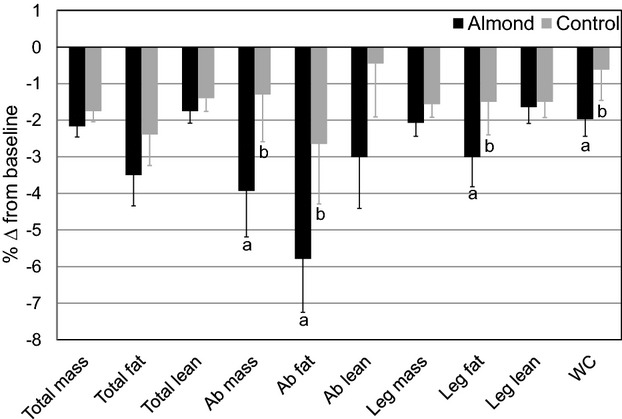
Percentage change in body composition outcomes from baseline for the almond and control treatments. Mean percentage change (±standard error) from baseline (n=48) is presented for descriptive purposes. Statistics (P values) were derived from the mixed model procedure in SAS for least squares mean change scores. Different lowercase letters within variables indicate treatment differences, P≤0.023. Ab indicates abdominal; WC, waist circumference.
Additional Metabolic Parameters
There were no treatment effects on median CRP or mean glucose changes; however, there was a sex by treatment interaction (P=0.03) for glucose, but post‐hoc comparisons were not significant (ALD, F: −0.5±1.9; ALD, M: −4.5±2.1; CON, F: −2.6±1.9; CON, M: −0.4±2.1 mg/dL; P>0.05).
Discussion
The present study is the first and largest controlled‐feeding trial using a single‐food, calorie‐matched snack substitution to investigate the cardioprotective properties of almonds, beyond the contributions of a heart healthy diet. We showed that daily almond consumption (1.5 oz.) for 6 weeks decreases non‐HDL‐C, LDL‐C, apoB, TC/HDL ratio, LDL/HDL ratio, and apoB/apoA1 ratio, confirming known benefits. We also found that almonds reduce abdominal and leg adiposity, despite no differences in body weight, demonstrating novel effects of isocalorically substituting 1 serving of almonds per day for a high carbohydrate snack (ie, muffin).
The LDL‐C‐lowering effect of almonds has been reported in previous trials in hypercholesterolemic and normocholesterolemic individuals.17–19,21,26,36–39 In the current study, 29% (14/48) of participants had baseline LDL‐C ≥160 mg/dL, whereas after the almond and control diets only 4% (2/48) and 10% (5/48) of participants, respectively, fell into this category. Our findings demonstrate that almond consumption is effective for lowering LDL‐C. Furthermore, almonds attenuated the IDL1 increase measured after consumption of the cholesterol‐lowering control diet. IDL, the atherogenic precursor to LDL, have greater binding affinity for LDL receptors, causing preferential uptake of IDL‐C and extended residence time of LDL‐C in the circulation.40 In a sub‐cohort of the PREDIMED trial, a MeDiet supplemented with nuts showed increases in large LDL compared with a MeDiet supplemented with extra‐virgin olive oil (P=0.017), no differences in medium‐small LDL (P=0.085), decreases in very small LDL compared with a lower fat control diet (P=0.017), and decreases in IDL compared with both diets (P=0.004).16 We found similar results for the IDL1 response; however, our LDL subspecies findings were not in agreement. Measurement techniques or differences in diet design may account for the discrepancies between studies. Moreover, a recent study reported that cholesterol in small, dense LDL and remnant lipoproteins is associated with macrophage content in carotid plaques (r=0.30, P<0.01 and r=0.46, P<0.01, respectively), a marker of plaque instability, in patients with carotid artery stenosis.41 In the current study, almond consumption maintained a reduced level of circulating IDL1 and VLDL3 compared to the control diet, demonstrating improved clearance of TG‐rich remnants and, consequently, potential protection from endothelial damage. In addition, the control diet decreased HDL‐C, HDL2, and HDL3 significantly more than the almond diet. Incorporating almonds in a cholesterol‐lowering diet preserves anti‐atherogenic HDL‐C and HDL subspecies while decreasing LDL‐C and remnant lipoprotein subfractions.
The cardioprotective properties of almonds are likely due, in part, to their unique fatty acid profile, which is high in unsaturated fat, predominantly oleic acid, and low in saturated fat. Importantly, Griel et al42 reported that lipid‐lowering effects extend beyond the fatty acid profiles of tree nuts. In the current study, the observed changes in TC, LDL‐C, HDL‐C, TG, apoB, and apoA1 were compared with those calculated by the Katan equation43 (Table 7) and suggest other nutrients and bioactive compounds in almonds, such as dietary fiber and phytosterols, may contribute to their LDL‐C‐lowering and HDL‐C‐conserving effects.
Table 7.
Predicted Versus Observed Treatment Effects
| Predicted Δ* | Observed Δ* | |
|---|---|---|
| Lipids, lipoproteins, and apolipoproteins, mg/dL | ||
| Total cholesterol | −4.3 | −5.1±2.4 |
| LDL‐C | −3.8 | −5.3±1.9 |
| HDL‐C | 1.5 | 1.7±0.6 |
| Triglycerides | −13.3 | −7.2±6.0 |
| Apolipoprotein B | −3.5 | −4.2±1.6 |
| Apolipoprotein A1 | 2.2 | 2.5±1.3 |
HDL‐C indicates high‐density lipoprotein cholesterol; LDL‐C, low‐density lipoprotein cholesterol.
Predicted effects of diets (almond vs control) were determined using the Katan Calculator.43
Observed effects of diets (almond vs control) are presented as differences of least squares mean±standard error.
Remarkably, despite no treatment differences in caloric intake or total body mass, participants had a significant reduction in DXA‐measured abdominal and leg adiposity on the almond diet. This was confirmed by our measurement of WC, which also showed a greater decrease with almond consumption. Similarly, in the PREDIMED trial, a MeDiet supplemented with nuts decreased WC (−5.1 cm, CI: −6.8 to −3.4) versus a lower fat control diet (0.8 cm, CI: −1.0 to 2.5) and a MeDiet supplemented with extra‐virgin olive oil (−1.4 cm, CI: −3.0 to 0.3).16 Likewise, in a cross‐sectional sample of the same study population, there was an inverse relationship between nut intake and central adiposity (OR 0.68, CI: 0.60 to 0.79; P‐trend <0.001).44 Paniagua et al35 demonstrated that a low‐fat, high‐carbohydrate diet (65% CHO, 20% total fat, 6% SFA, 8% MUFA, and 6% PUFA) decreased adipose tissue in the legs but increased central fat in the trunk versus a high‐fat, MUFA‐rich diet (47% CHO, 38% total fat, 9% SFA, 23% MUFA, and 6% PUFA) or a high‐fat, SFA‐rich diet (47% CHO, 38% total fat, 23% SFA, 9% MUFA, and 6% PUFA) in insulin‐resistant individuals. Similarly, Walker et al45 reported an increase in the upper body fat‐to‐lower body fat ratio on a high‐carbohydrate diet (49% CHO, 23% total fat, 9% SFA, 9% MUFA, 4% PUFA) versus a higher fat, MUFA‐rich diet (40% CHO, 35% total fat, 10% SFA, 20% MUFA, 5% PUFA) in individuals with non‐insulin‐dependent diabetes. They also reported a negative correlation between the upper body fat‐to‐lower body fat ratio and percent plasma oleic acid (r=−0.36; P<0.01), suggesting a role for MUFA in regional fat distribution.45
Collectively, epidemiological studies demonstrate that frequent nut eaters do not weigh more, indicating that nutrient‐dense almonds can be incorporated in weight‐maintenance and weight‐loss diets.46 A recent meta‐analysis showed that nuts, including almonds, do not increase body weight, BMI, or WC (−0.47 kg, CI: −1.17 to 0.22; −0.40 kg/m2, CI: −0.97 to 0.17; −1.25 cm, CI: −2.82 to 0.31, respectively).47 Moreover, Novotny et al48 demonstrated that the measured energy content of almonds is less than that estimated by the Atwater factors (129 versus 169 kcal/oz.), which may be attributable to their inherent nutrient bioaccessibility (eg, fiber content, cell wall structure) and/or interindividual digestibility (eg, mastication, gut residence time).49–51
Strengths and Limitations
Among the strengths of our study are the large sample size, well‐controlled and unique diet design, and comprehensive lipid/lipoprotein and body composition outcomes. Previous controlled‐feeding almond studies18–19,21 employed a diet design that incrementally decreased some or all foods to accommodate the addition of almonds. In the current study, we used a single, whole food substitution, which is more applicable to free‐living situations. Furthermore, our study diet incorporated a standard serving (1.5 oz.) of almonds using dietary replacement, which is consistent with the 2010 Dietary Guidelines for Americans recommendation for consuming nuts and seeds.7
Limitations include our primarily Caucasian study population, which precluded ethnic/racial‐specific analyses, and lack of pre‐study dietary intake and physical activity data, which may have facilitated a better understanding of metabolic changes from baseline. In addition, we were surprised to find a significant visit effect for several outcome measures; participants experienced an attenuated response during diet period 2 compared with diet period 1 for certain outcomes, emphasizing the importance of treatment randomization and an appropriate control group. Notably, we observed no carry‐over effects (treatment by visit interactions). Finally, the test diets were not matched for macronutrients, limiting conclusions about the independent effect of almonds on the endpoints we measured. Nonetheless, almond‐delivered nutrients/bioactives improved a traditional cholesterol‐lowering diet when substituted for a high‐carbohydrate snack. Additional controlled‐feeding studies are needed to investigate almonds within diets matched for macronutrient and fatty acid composition.
Conclusions
A daily almond snack, isocalorically substituted for a high‐carbohydrate snack, benefited traditional and emerging CVD risk factors, including central adiposity. These improvements would be expected to decrease the risk of developing metabolic syndrome and/or CVD. Thus, daily consumption of almonds (1.5 oz.) may be a simple dietary strategy to help prevent the onset of cardiometabolic diseases in healthy individuals.
Sources of Funding
This study was supported by the Almond Board of California and the General Clinical Research Center, Penn State (NIH grant M01 RR 10732).
Disclosures
Berryman, Kris‐Etherton, West, Fleming, and Bordi received funding from the Almond Board of California for the research reported in this article. Berryman received travel funds and honoraria from the Almond Board of California for giving presentations on this research. The Almond Board of California had no role in the design and conduct of the study; in the collection, analysis, and interpretation of the data; or in the preparation, review, or approval of the manuscript.
Acknowledgments
We thank our research participants for their dedication to the project. Many members of the Cardiometabolic Nutrition Research Laboratory assisted with this study, including Devon Bordi, Alicia Kroat, Pam Davis, and Marcella Smith, and we thank them for their technical assistance. We are grateful to the nursing and clinician staff of the GCRC, Penn State. The authors’ responsibilities were as follows—Kris‐Etherton, Berryman, West, Bordi, and Fleming designed the research; Berryman conducted the research; Berryman performed the statistical analyses; and Berryman, Kris‐Etherton, West, Bordi, and Fleming wrote the manuscript; Kris‐Etherton and Berryman had primary responsibility for final content. All authors read and approved the final manuscript.
References
- 1.Go AS, Mozaffarian D, Roger VL, Benjamin EJ, Berry JD, Borden WB, Bravata DM, Dai S, Ford ES, Fox CS, Franco S, Fullerton HJ, Gillespie C, Hailpern SM, Heit JA, Howard VJ, Huffman MD, Kissela BM, Kittner SJ, Lackland DT, Lichtman JH, Lisabeth LD, Magid D, Marcus GM, Marelli A, Matchar DB, McGuire DK, Mohler ER, Moy CS, Mussolino ME, Nichol G, Paynter NP, Schreiner PJ, Sorlie PD, Stein J, Turan TN, Virani SS, Wong ND, Woo D, Turner MB. Heart disease and stroke statistics—2013 update: a report from the American Heart Association. Circulation. 2013; 127:e6-e245. [DOI] [PMC free article] [PubMed] [Google Scholar]
- 2.World Health Organization. Top 10 causes of death fact sheet (2000 and 2011) Available at: http://www.who.int/mediacentre/factsheets/fs310/en/index.html. Accessed August 15, 2013.
- 3.Stone NJ, Robinson J, Lichtenstein AH, Bairey Merz CN, Blum CB, Eckel RH, Goldberg AC, Gordon D, Levy D, Lloyd‐Jones DM, McBride P, Schwartz JS, Shero ST, Smith SC, Jr, Watson K, Wilson PWF. 2013 ACC/AHA Guideline on the treatment of blood cholesterol to reduce atherosclerotic cardiovascular risk in adults: a report of the American College of Cardiology/American Heart Association Task Force on Practice Guidelines. Circulation. 2013; 129:S1-S45. [DOI] [PubMed] [Google Scholar]
- 4.Mozaffarian D, Appel LJ, Van Horn L. Components of a cardioprotective diet: new insights. Circulation. 2011; 123:2870-2891. [DOI] [PMC free article] [PubMed] [Google Scholar]
- 5.Lim SS, Vos T, Flaxman AD, Danaei G, Shibuya K, Adair‐Rohani H, AlMazroa MA, Amann M, Anderson HR, Andrews KG, Aryee M, Atkinson C, Bacchus LJ, Bahalim AN, Balakrishnan K, Balmes J, Barker‐Collo S, Baxter A, Bell ML, Blore JD, Blyth F, Bonner C, Borges G, Bourne R, Boussinesq M, Brauer M, Brooks P, Bruce NG, Brunekreef B, Bryan‐Hancock C, Bucello C, Buchbinder R, Bull F, Burnett RT, Byers TE, Calabria B, Carapetis J, Carnahan E, Chafe Z, Charlson F, Chen H, Chen JS, Cheng AT‐A, Child JC, Cohen A, Colson KE, Cowie BC, Darby S, Darling S, Davis A, Degenhardt L, Dentener F, Des Jarlais DC, Devries K, Dherani M, Ding EL, Dorsey ER, Driscoll T, Edmond K, Ali SE, Engell RE, Erwin PJ, Fahimi S, Falder G, Farzadfar F, Ferrari A, Finucane MM, Flaxman S, Fowkes FGR, Freedman G, Freeman MK, Gakidou E, Ghosh S, Giovannucci E, Gmel G, Graham K, Grainger R, Grant B, Gunnell D, Gutierrez HR, Hall W, Hoek HW, Hogan A, Hosgood Iii HD, Hoy D, Hu H, Hubbell BJ, Hutchings SJ, Ibeanusi SE, Jacklyn GL, Jasrasaria R, Jonas JB, Kan H, Kanis JA, Kassebaum N, Kawakami N, Khang Y‐H, Khatibzadeh S, Khoo J‐P, Kok C, Laden F, Lalloo R, Lan Q, Lathlean T, Leasher JL, Leigh J, Li Y, Lin JK, Lipshultz SE, London S, Lozano R, Lu Y, Mak J, Malekzadeh R, Mallinger L, Marcenes W, March L, Marks R, Martin R, McGale P, McGrath J, Mehta S, Memish ZA, Mensah GA, Merriman TR, Micha R, Michaud C, Mishra V, Hanafiah KM, Mokdad AA, Morawska L, Mozaffarian D, Murphy T, Naghavi M, Neal B, Nelson PK, Nolla JM, Norman R, Olives C, Omer SB, Orchard J, Osborne R, Ostro B, Page A, Pandey KD, Parry CDH, Passmore E, Patra J, Pearce N, Pelizzari PM, Petzold M, Phillips MR, Pope D, Pope Iii CA, Powles J, Rao M, Razavi H, Rehfuess EA, Rehm JT, Ritz B, Rivara FP, Roberts T, Robinson C, Rodriguez‐Portales JA, Romieu I, Room R, Rosenfeld LC, Roy A, Rushton L, Salomon JA, Sampson U, Sanchez‐Riera L, Sanman E, Sapkota A, Seedat S, Shi P, Shield K, Shivakoti R, Singh GM, Sleet DA, Smith E, Smith KR, Stapelberg NJC, Steenland K, Stöckl H, Stovner LJ, Straif K, Straney L, Thurston GD, Tran JH, Van Dingenen R, van Donkelaar A, Veerman JL, Vijayakumar L, Weintraub R, Weissman MM, White RA, Whiteford H, Wiersma ST, Wilkinson JD, Williams HC, Williams W, Wilson N, Woolf AD, Yip P, Zielinski JM, Lopez AD, Murray CJL, Ezzati M. A comparative risk assessment of burden of disease and injury attributable to 67 risk factors and risk factor clusters in 21 regions, 1990–2010: a systematic analysis for the Global Burden of Disease Study 2010. Lancet. 2012; 380:2224-2260. [DOI] [PMC free article] [PubMed] [Google Scholar]
- 6.Center for Food Safety and Applied Nutrition. U.S. FDA. Letter of Enforcement Discretion—Nuts and Coronary Heart Disease; 2003, Docket No. 02Px20100505. Available at: http://www.fda.gov/food/ingredientspackaginglabeling/labelingnutrition/ucm073992.htm. Accessed August 15, 2013.
- 7.U.S. Department of Agriculture and U.S. Department of Health and Human Services. Dietary Guidelines for Americans, 2010. 2010Washington, DC: U.S. Government Printing Office; [DOI] [PMC free article] [PubMed] [Google Scholar]
- 8.Lloyd‐Jones DM, Hong Y, Labarthe D, Mozaffarian D, Appel LJ, Van Horn L, Greenlund K, Daniels S, Nichol G, Tomaselli GF, Arnett DK, Fonarow GC, Ho PM, Lauer MS, Masoudi FA, Robertson RM, Roger V, Schwamm LH, Sorlie P, Yancy CW, Rosamond WDon behalf of the American Heart Association Strategic Planning Task Force and Statistics Committee. Defining and setting national goals for cardiovascular health promotion and disease reduction: the American Heart Association's strategic Impact Goal through 2020 and beyond. Circulation. 2010; 121:586-613. [DOI] [PubMed] [Google Scholar]
- 9.Bao Y, Han J, Hu FB, Giovannucci EL, Stampfer MJ, Willett WC, Fuchs CS. Association of nut consumption with total and cause‐specific mortality. N Engl J Med. 2013; 369:2001-2011. [DOI] [PMC free article] [PubMed] [Google Scholar]
- 10.Hu FB, Stampfer MJ. Nut consumption and risk of coronary heart disease: a review of epidemiologic evidence. Curr Atheroscler Rep. 1999; 1:204-209. [DOI] [PubMed] [Google Scholar]
- 11.Albert CM, Gaziano J, Willett WC, Manson JE. Nut consumption and decreased risk of sudden cardiac death in the Physicians’ Health Study. Arch Intern Med. 2002; 162:1382-1387. [DOI] [PubMed] [Google Scholar]
- 12.Ellsworth JL, Kushi LH, Folsom AR. Frequent nut intake and risk of death from coronary heart disease and all causes in postmenopausal women: the Iowa Women's Health Study. Nutr Metab Cardiovasc Dis. 2001; 11:372-377. [PubMed] [Google Scholar]
- 13.Fraser GE, Shavlik DJ. Risk factors for all‐cause and coronary heart disease mortality in the oldest‐old: the Adventist Health Study. Arch Intern Med. 1997; 157:2249-2258. [PubMed] [Google Scholar]
- 14.Sabaté J, Oda K, Ros E. Nut consumption and blood lipid levels: a pooled analysis of 25 intervention trials. Arch Intern Med. 2010; 170:821-827. [DOI] [PubMed] [Google Scholar]
- 15.Estruch R, Ros E, Salas‐Salvadó J, Covas MI, Corella D, Arós F, Gómez‐Gracia E, Ruiz‐Gutiérrez V, Fiol M, Lapetra J, Lamuela‐Raventos RM, Serra‐Majem L, Pintó X, Basora J, Muñoz MA, Sorlí JV, Martínez JA, Martínez‐González MAPREDIMED Study Investigators. Primary prevention of cardiovascular disease with a Mediterranean diet. N Engl J Med. 2013; 368:1279-1290. [DOI] [PubMed] [Google Scholar]
- 16.Damasceno NRT, Sala‐Vila A, Cofán M, Pérez‐Heras AM, Fitó M, Ruiz‐Gutiérrez V, Martínez‐González M‐Á, Corella D, Arós F, Estruch R, Ros E. Mediterranean diet supplemented with nuts reduces waist circumference and shifts lipoprotein subfractions to a less atherogenic pattern in subjects at high cardiovascular risk. Atherosclerosis. 2013; 230:347-353. [DOI] [PubMed] [Google Scholar]
- 17.Spiller GA, Jenkins DA, Bosello O, Gates JE, Cragen LN, Bruce B. Nuts and plasma lipids: an almond‐based diet lowers LDL‐C while preserving HDL‐C. J Am Coll Nutr. 1998; 17:285-290. [DOI] [PubMed] [Google Scholar]
- 18.Lovejoy JC, Most MM, Lefevre M, Greenway FL, Rood JC. Effect of diets enriched in almonds on insulin action and serum lipids in adults with normal glucose tolerance or type 2 diabetes. Am J Clin Nutr. 2002; 76:1000-1006. [DOI] [PubMed] [Google Scholar]
- 19.Sabaté J, Haddad E, Tanzman JS, Jambazian P, Rajaram S. Serum lipid response to the graduated enrichment of a Step I diet with almonds: a randomized feeding trial. Am J Clin Nutr. 2003; 77:1379-1384. [DOI] [PubMed] [Google Scholar]
- 20.Berryman CE, Preston AG, Karmally W, Deckelbaum RJ, Kris‐Etherton PM. Effects of almond consumption on the reduction of LDL‐cholesterol: a discussion of potential mechanisms and future research directions. Nutr Rev. 2011; 69:171-185. [DOI] [PubMed] [Google Scholar]
- 21.Li S‐C, Liu Y‐H, Liu J‐F, Chang W‐H, Chen C‐M, Chen CYO. Almond consumption improved glycemic control and lipid profiles in patients with type 2 diabetes mellitus. Metabolism. 2011; 60:474-479. [DOI] [PubMed] [Google Scholar]
- 22.Tan SY, Mattes RD. Appetitive, dietary and health effects of almonds consumed with meals or as snacks: a randomized, controlled trial. Eur J Clin Nutr. 2013; 67:1205-1214. [DOI] [PMC free article] [PubMed] [Google Scholar]
- 23.Wien M, Bleich D, Raghuwanshi M, Gould‐Forgerite S, Gomes J, Monahan‐Couch L, Oda K. Almond consumption and cardiovascular risk factors in adults with prediabetes. J Am Coll Nutr. 2010; 29:189-197. [DOI] [PubMed] [Google Scholar]
- 24.Jenkins DJA, Kendall CWC, Marchie A, Josse AR, Nguyen TH, Faulkner DA, Lapsley KG, Singer W. Effect of almonds on insulin secretion and insulin resistance in nondiabetic hyperlipidemic subjects: a randomized controlled crossover trial. Metabolism. 2008; 57:882-887. [DOI] [PubMed] [Google Scholar]
- 25.Rajaram S, Connell KM, Sabaté J. Effect of almond‐enriched high‐monounsaturated fat diet on selected markers of inflammation: a randomised, controlled, crossover study. Br J Nutr. 2010; 103:907-912. [DOI] [PubMed] [Google Scholar]
- 26.Jenkins DJA, Kendall CWC, Marchie A, Parker TL, Connelly PW, Qian W, Haight JS, Faulkner D, Vidgen E, Lapsley KG, Spiller GA. Dose response of almonds on coronary heart disease risk factors: blood lipids, oxidized low‐density lipoproteins, lipoprotein(a), homocysteine, and pulmonary nitric oxide: a randomized, controlled, crossover trial. Circulation. 2002; 106:1327-1332. [DOI] [PubMed] [Google Scholar]
- 27.Wien MA, Sabaté JM, Iklé DN, Cole SE, Kandeel FR. Almonds vs complex carbohydrates in a weight reduction program. Int J Obes Relat Metab Disord. 2003; 27:1365-1372. [DOI] [PubMed] [Google Scholar]
- 28.Chobanian AV, Bakris GL, Black HR, Cushman WC, Green LA, Izzo JL, Jr, Jones DW, Materson BJ, Oparil S, Wright JT, Jr, Roccella EJNational Heart, Lung, and Blood Institute Joint National Committee on Prevention, Detection, Evaluation, and Treatment of High Blood Pressure; National High Blood Pressure Education Program Coordinating Committee. The seventh report of the Joint National Committee on Prevention, Detection, Evaluation, and Treatment of High Blood Pressure: the JNC 7 report. JAMA. 2003; 289:2560-2571. [DOI] [PubMed] [Google Scholar]
- 29.Kulkarni KR. Cholesterol profile measurement by vertical auto profile method. Clin Lab Med. 2006; 26:787-802. [DOI] [PubMed] [Google Scholar]
- 30.Kulkarni K. Apo B measurement system and method; 2008. Agents: DLA PIPER US LLP; IPC8 Class: AG01N3392FI; USPC Class: 436 52. Available at: http://www.faqs.org/patents/app/20080261313. Accessed August 15, 2013.
- 31.Kulkarni KR, Tiwari H, Moore L, Jones S. A novel approach to measure apolipoprotein B/apolipoprotein AI ratio using the vertical auto profile method (poster). Diab Vasc Dis Res. 2007; 4:266 [Google Scholar]
- 32.National Center for Health Statistics. National Health and Nutrition Examination Survey: Anthropometry Procedures Manual Available at: http://www.cdc.gov/nchs/data/nhanes/nhanes_07_08/manual_an.pdf. Accessed August 15, 2013.
- 33.Benjamini Y, Krieger AM, Yekutieli D. Adaptive linear step‐up procedures that control the false discovery rate. Biometrika. 2006; 93:491-507. [Google Scholar]
- 34.Gebauer SK, West SG, Kay CD, Alaupovic P, Bagshaw D, Kris‐Etherton PM. Effects of pistachios on cardiovascular disease risk factors and potential mechanisms of action: a dose‐response study. Am J Clin Nutr. 2008; 88:651-659. [DOI] [PubMed] [Google Scholar]
- 35.Paniagua JA, de la Sacristana AG, Romero I, Vidal‐Puig A, Latre JM, Sanchez E, Perez‐Martinez P, Lopez‐Miranda J, Perez‐Jimenez F. Monounsaturated fat–rich diet prevents central body fat distribution and decreases postprandial adiponectin expression induced by a carbohydrate‐rich diet in insulin‐resistant subjects. Diabetes Care. 2007; 30:1717-1723. [DOI] [PubMed] [Google Scholar]
- 36.Spiller GA, Miller A, Olivera K, Reynolds J, Miller B, Morse SJ, Dewell A, Farquhar JW. Effects of plant‐based diets high in raw or roasted almonds, or roasted almond butter on serum lipoproteins in humans. J Am Coll Nutr. 2003; 22:195-200. [DOI] [PubMed] [Google Scholar]
- 37.Abbey M, Noakes M, Belling GB, Nestel PJ. Partial replacement of saturated fatty acids with almonds or walnuts lowers total plasma cholesterol and low‐density‐lipoprotein cholesterol. Am J Clin Nutr. 1994; 59:995-999. [DOI] [PubMed] [Google Scholar]
- 38.Hyson DA, Schneeman BO, Davis PA. Almonds and almond oil have similar effects on plasma lipids and LDL oxidation in healthy men and women. J Nutr. 2002; 132:703-707. [DOI] [PubMed] [Google Scholar]
- 39.Tamizifar B, Rismankarzadeh M, Vosoughi A‐A, Rafieeyan M, Tamizifar B, Aminzade A. A low‐dose almond‐based diet decreases LDL‐C while preserving HDL‐C. Arch Iran Med. 2005; 8:45-51. [Google Scholar]
- 40.Ramasamy I. Recent advances in physiological lipoprotein metabolism. Clin Chem Lab Med. 2013:1-33. [DOI] [PubMed] [Google Scholar]
- 41.Zambon A, Puato M, Faggin E, Grego F, Rattazzi M, Pauletto P. Lipoprotein remnants and dense LDL are associated with features of unstable carotid plaque: a flag for non‐HDL‐C. Atherosclerosis. 2013; 230:106-109. [DOI] [PubMed] [Google Scholar]
- 42.Griel AE, Kris‐Etherton PM. Tree nuts and the lipid profile: a review of clinical studies. Br J Nutr. 2006; 96suppl 2:S68-S78. [DOI] [PubMed] [Google Scholar]
- 43.Katan MB, Tilburg TV, Luger M. Katan Calculator: Predicted Effect of Diet on Blood Lipids and Lipoproteins Available at: http://www.katancalculator.nl/. Accessed August 15, 2013.
- 44.Ibarrola‐Jurado N, Bulló M, Guasch‐Ferré M, Ros E, Martínez‐González MA, Corella D, Fiol M, Wärnberg J, Estruch R, Román P, Arós F, Vinyoles E, Serra‐Majem L, Pintó X, Covas MI, Basora J, Salas‐Salvadó JPREDIMED Study Investigators. Cross‐sectional assessment of nut consumption and obesity, metabolic syndrome and other cardiometabolic risk factors: the PREDIMED study. PLoS One. 2013; 8:e57367. [DOI] [PMC free article] [PubMed] [Google Scholar]
- 45.Walker KZ, O'Dea K, Johnson L, Sinclair AJ, Piers LS, Nicholson GC, Muir JG. Body fat distribution and non‐insulin‐dependent diabetes: comparison of a fiber‐rich, high‐carbohydrate, low‐fat (23%) diet and a 35% fat diet high in monounsaturated fat. Am J Clin Nutr. 1996; 63:254-260. [DOI] [PubMed] [Google Scholar]
- 46.Vadivel V, Kunyanga CN, Biesalski HK. Health benefits of nut consumption with special reference to body weight control. Nutrition. 2012; 28:1089-1097. [DOI] [PubMed] [Google Scholar]
- 47.Flores‐Mateo G, Rojas‐Rueda D, Basora J, Ros E, Salas‐Salvadó J. Nut intake and adiposity: meta‐analysis of clinical trials. Am J Clin Nutr. 2013; 97:1346-1355. [DOI] [PubMed] [Google Scholar]
- 48.Novotny JA, Gebauer SK, Baer DJ. Discrepancy between the Atwater factor predicted and empirically measured energy values of almonds in human diets. Am J Clin Nutr. 2012; 96:296-301. [DOI] [PMC free article] [PubMed] [Google Scholar]
- 49.Ellis PR, Kendall CW, Ren Y, Parker C, Pacy JF, Waldron KW, Jenkins DJ. Role of cell walls in the bioaccessibility of lipids in almond seeds. Am J Clin Nutr. 2004; 80:604-613. [DOI] [PubMed] [Google Scholar]
- 50.Mandalari G, Faulks RM, Rich GT, Lo Turco V, Picout DR, Lo Curto RB, Bisignano G, Dugo P, Dugo G, Waldron KW, Ellis PR, Wickham MSJ. Release of protein, lipid, and vitamin E from almond seeds during digestion. J Agric Food Chem. 2008; 56:3409-3416. [DOI] [PubMed] [Google Scholar]
- 51.Cassady BA, Hollis JH, Fulford AD, Considine RV, Mattes RD. Mastication of almonds: effects of lipid bioaccessibility, appetite, and hormone response. Am J Clin Nutr. 2009; 89:794-800. [DOI] [PubMed] [Google Scholar]