

Abstract
Background
We aimed to develop a simple structural model of aortic aneurysms using computer‐assisted drafting (CAD) in order to create a basis of definition for saccular aortic aneurysms.
Methods and Results
We constructed a simple aortic aneurysm model with 2 components: a tube similar to an aorta and an ellipse analogous to a bulging aneurysm. Three parameters, including the vertical and horizontal diameters of the ellipse and the fillet radius, were altered in the model. Using structural analysis with the finite element method, we visualized the distribution of the maximum principal stress (MPS) in the aortic wall and identified the area(s) of prominent stress. We then selected patients with thoracic aortic aneurysms in whom the aneurysm expansion rates were followed up and applied the theoretical results to the raw imaging data. The maximum MPS drastically increased at areas where the aspect ratio (vertical/horizontal) was <1, indicating that “horizontally long” hypothetical ellipses should be defined as “saccular” aneurysms. The aneurysm expansion rate for the patients with thoracic aneurysms conforming to these parameters was significantly high. Further, “vertically long” ellipses with a small fillet might be candidates for saccular aneurysms; however, the clinical data did not support this.
Conclusions
Based on the biomechanical analysis of a simple aneurysm model and the clinical data of the thoracic aortic aneurysms, we defined “horizontally long” aortic aneurysms with an aspect ratio of <1 as “saccular” aneurysms.
Keywords: aortic aneurysm, principal stress, saccular
Introduction
As an aortic aneurysm (AA) can be fatal in the case of its rupture, it is important to set an optimal treatment strategy based on the type of aneurysm and its prognosis. Among various dynamic factors, aneurysmal diameter and expansion rate have been widely accepted as an indication for open surgery or endovascular aneurysm repair (EVAR), based on reports that observed AA patients not undergoing any treatment.1–3 Although, saccular‐shaped AAs are also accepted as an indication for surgery, there is little evidence to demonstrate the fragility of a certain type of aneurysm morphology.4 Therefore, the definition of “saccular” aneurysms varies widely and is arbitrarily determined by each institution or surgeon.
The biomechanical approach to AA has highlighted the importance of the aneurysm's geometry in predicting its progression5 and rupture.6–9 However, it remains controversial whether the saccular shape should be regarded as an independent risk factor for rupture. Shang et al raised doubts on the malignant nature of saccular AAs.10 They analyzed 122 saccular AAs and found that they did not increase expansion rates as compared to fusiform AAs; on the other hand, Nathan et al11 reported that the normalized wall stress for saccular descending thoracic AAs was greater than that for fusiform descending thoracic AAs. The cause of this discrepancy might be due to the term “saccular,” which has not been defined clearly thus far.
As the mechanisms of AA rupture are multifactorial, the actual cause of rupture varies widely and the process remains unclear. In the present study, we attempted to develop a simple structural model using computer‐assisted drafting (CAD) focusing on the aneurysm's morphology. Simultaneously, we retrospectively selected patients who underwent surgical intervention for thoracic AAs in our institute and examined the expansion rate of their AAs. By applying the theoretical results to raw imaging data, we aimed to create a basis for accurately defining saccular AAs.
Methods
Setting for AA Model Construction
To evaluate the bulging site of the saccular AA at risk of rupture, our model was constructed with only 2 components: a tube similar to an aorta and an ellipse analogous to a bulging aneurysm (Figure 1A). With CAD software, we performed structural analysis with a two‐dimensional (2‐D) axisymmetric model to take circumferential principal wall stress into account. Two parameters that were considered to affect the eccentric morphology of the saccular aneurysm were used in the model: an aspect ratio and a fillet radius of AA. The aspect ratio was defined as a ratio of the vertical diameter to the horizontal diameter of the hypothetical ellipse (Figure 1A). Here, “filleting” indicated a method of smoothing the joint line between the ellipse and the touching linear line. The AA fillet was created using CAD and the joint curve was controlled by changing the fillet radius (Figure 1B).
Figure 1.
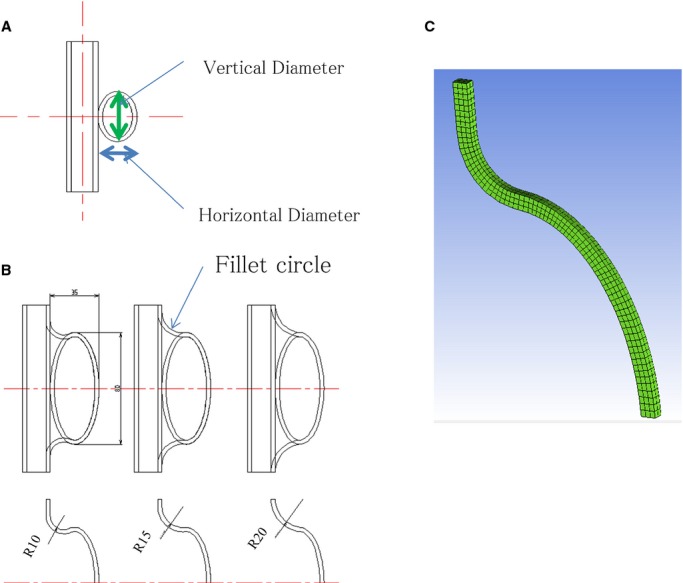
A, A model of an aortic aneurysm, composed of a tube and an ellipse. The horizontal and vertical diameters were changed for structural analysis. B, The “filleting” method indicates a method of smoothing the joint line between the ellipse and the touching linear line. C, The computational grid (hexahedral grid) for analyzing the AA wall structure using the finite element method.
Experimental Planning
In the simulation for our model, we performed experimental planning in order to change the geometric parameters effectively. We set 3 parameters, ie, the vertical diameter, horizontal diameter, and fillet radius. The range of the diameters was set from 15 to 35 mm; that of the fillet radius, from 6 to 14 mm. We analyzed 16 models created twice for each condition in the way described below. We used analysis of variance (ANOVA) for analyzing the interaction of the parameters (Table 1). The vertical and horizontal diameters and their interaction were found to be significantly independent (P<0.01); further, the interactions between the fillet radius and the horizontal as well as vertical diameters were significantly independent (P<0.05, <0.01, respectively). The fillet radius was not significantly independent. Based on these results, we planned to analyze the AA aspect model first, in which we changed the values of the vertical and horizontal diameters, followed by analysis of the AA fillet model by changing the fillet radius.
Table 1.
Analysis of Variance for the Parameters of the Aortic Aneurysm
| Factors | SS | df | V | F | P Value | Judgement |
|---|---|---|---|---|---|---|
| M (average) | 0.01731 | 1 | 0.01731 | |||
| A (vertical axis) | 0.00332 | 1 | 0.00332 | 4600 | <0.001 | ** |
| B (horizontal axis) | 0.00175 | 1 | 0.00175 | 2431 | <0.001 | ** |
| C (fillet) | 0.00000 | 1 | 0.00000 | 1.79 | 0.21 | |
| B×C | 0.00000 | 1 | 0.00000 | 6.03 | 0.03 | * |
| A×C | 0.00002 | 1 | 0.00002 | 37.7 | <0.001 | ** |
| A×B | 0.00159 | 1 | 0.00159 | 2212 | <0.001 | ** |
| e | 0.00000 | 9 | 0.00000 | |||
| Total | 0.02402 | 16 |
*Significant at less than 5%, **Significant at less than 1%. We analyzed total of 16 models created twice with 3 elements for 2 levels. df indicates degree of freedom; F, F‐test; SS, sum of square; V, variance.
Structural Analysis
For analyzing the AA wall structure with the finite element method, we formed a computational grid (hexahedral grid) using the software ICEM CFD™ (ANSYS Inc, USA) (Figure 1C). In the axisymmetric model, we used a shell element of the plane in the hexahedral grid.
Regarding the mechanical properties of the aortic wall, we adopted the data of the normal aorta.12–14 We set the Poisson ratio as 0.49, ie, almost equal to 0.5, under the hypothesis that the vessel structure was non‐compressive (Table 2). For analysis, the upper site of the normal aorta was bound in all directions, and the top of the aneurysmal sac was also bound, except in the x axis direction. An inner pressure of 100 mm Hg corresponding to normal blood pressure was loaded linearly per second on the aortic wall.
Table 2.
Mechanical Properties of the Aneurysm
| Young's modules, Mpa | 0.5 |
| Poisson ratio | 0.49 |
| Density, kg/m3 | 1000 |
| Load pressure, mm Hg | 100 |
| External diameter of the aorta, mm | 20 |
| Aortic wall thickness, mm | 3 |
Model Construction
To describe the change in the maximum principal stress (MPS) on the aortic wall, we applied hypothetical ellipses with various aspect ratios (0.6 to 2.4) (Figure 2). The fillet radius was fixed as 10 mm. In addition, we set 3 values for the horizontal diameter as 15, 25, and 35 mm. According to this setting, the vertical diameter varied from 10 to 80 mm at intervals of 5 mm. To render a similar morphology for the connecting site between the aneurysm and normal aorta, we set a ratio of horizontal diameter to fillet radius as 5 to 2 (6, 10, and 14 mm for each).
Figure 2.

Analysis by changing the aspect ratio of the ellipse.
The fillet radius was considered to be important for defining the “saccular” aneurysm, because eccentric bulging with a small fillet radius is generally thought to relate to wall fragility.11 The fillet radius, set as 1, 3, 5, 7, 9, and 10 mm, was applied to the model with various aspect ratios as 0.8, 1.0, 1.4, 2.0, and 3.0, respectively.
Imaging
Computed tomography (CT) scans were obtained using a 64‐channel multi‐detector row CT (MDCT) scanner (Aquilion™; Toshiba, Tokyo, Japan). All scans were evaluated using a modeling workstation (Osirix™ 4.0‐DICOM viewer for Mac OS X). Basically, we used the longitudinal sagittal view, which included both the aorta and the aneurysm in the most conspicuously demonstrated plane. The hypothetical linear line of the native aorta was first chosen, similar to that in the AA model, and the “ellipse tool” was adapted to the aneurysmal outer line (Figure 3). We calculated the aspect ratio by measuring the vertical (B) and horizontal diameters (C) of the adapted ellipse. Next, the “circle tool” was adapted on the curve of the joint between the aneurysm and the normal aorta to evaluate the degree of fillet. Fillet radius (D) was calculated by measuring the circle radius (Figure 3).
Figure 3.
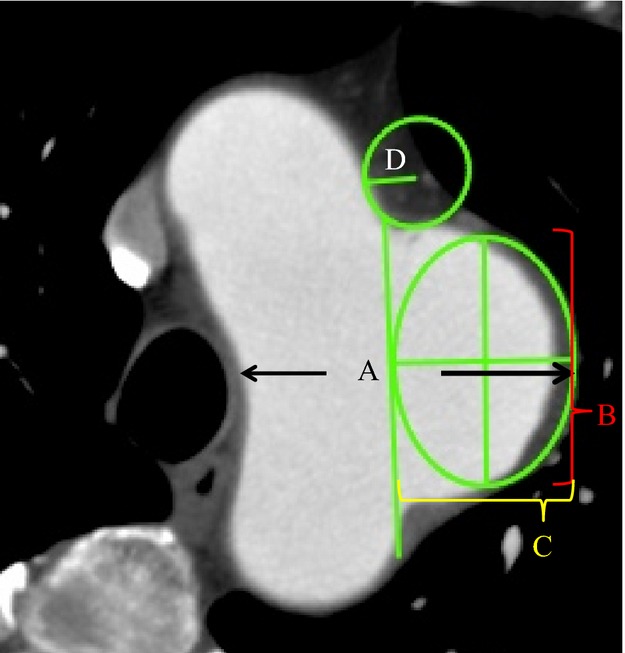
The method of applying this model for clinical use by using the 2‐D image. The aneurysm diameter was measured using a generally accepted method (A). The aspect ratio (vertical diameter (B)/horizontal diameter (C)) was calculated by adapting the ellipse tool to touch both the hypothetical normal aorta and the outer line of the aneurysm. A fillet radius (D) was calculated from the circle fitting the curve of the joint between the aorta and the aneurysm.
Patients
This study was approved by the research ethics committee of our institution. Patients with thoracic AA admitted to our institution from January 2002 to September 2013 were retrospectively examined. From this database, we selected 81 patients who had undergone CT scans at several time points, which enabled the follow‐up of the aneurysm diameter over at least 4 months. Aneurysms located in the aortic arch, descending thoracic aorta, and thoracic‐abdominal aorta were included. Aneurysms caused by infection, aortitis, or connective tissue disorders – such as Marfan syndrome, Ehlers‐Danlos syndrome, and Loeys‐Dietz syndrome – were excluded. Aneurysm patients were divided into 3 groups according to the morphological definition derived from the structural analysis of our aneurysm model. Maximum aneurysm diameters were measured in the CT axial image, and the growth rate was calculated from the measurement data at the 2 longest time points in the follow‐up periods and compared among groups. In addition, the measurement of parameters using the CT imaging data was performed by 3 vascular surgeons (A. T., K. H., and Y. N.) to evaluate inter‐observer variability.
Statistical Analysis
The patient groups were compared using 1‐way ANOVA statistics or Fisher's exact test, as appropriate. The level of inter‐observer agreement of analysis for morphological classification was assessed by Cohen's kappa coefficient. P<0.05 was considered confidence intervals, and all statistical analyses were performed with JMP™ software (JMP Japan, Tokyo, Japan).
Results
Based on the structural analysis, we created a distribution map of MPS on the aneurysm wall and plotted its peak values on the graph. Thereafter, we focused on the MPS area of the aneurysm wall under the assumption that it would be maximally prone to the risk of rupture.
Analysis of the Aspect Ratio
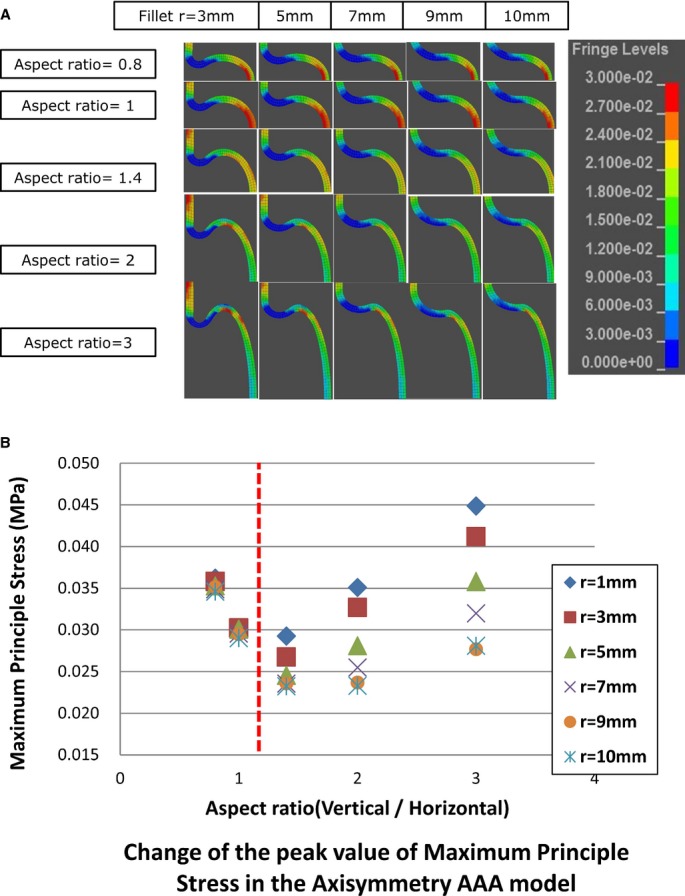
We visualized the MPS on the aortic wall and found that as the aspect ratio increased, the site of maximum stress shifted from the top of the aneurysmal sac to the “shoulder” (Figure 4). In addition, the peak value of the MPS drastically increased in the areas where the aspect ratio was <1. Since an ellipse with an aspect ratio of “1” indicated a precise circle, a ratio of <1 indicated a shape that was “horizontally long.” The exponential change in the MPS when the aspect ratio was <1 indicated that “X=1” might be the border between fusiform and saccular aneurysms. In other words, the “horizontally long” aneurysm was defined as the “saccular” type. High‐value conditions found in the normal aorta in the figures are artifacts due to the boundary condition for the upper aortic wall.
Figure 4.

A, Visualization of the MPS on the aortic wall in the 2‐D aspect ratio model. B, Change in the peak value of the MPS. AAA indicates abdominal aortic aneurysm; MPS, maximum principal stress.
Analysis of the Fillet
Figure 5 shows the results of the model with various fillet radius values. The distribution of the MPS was visualized (Figure 5A) and plotted in the graph (Figure 5B). The graph revealed that the variations caused by changes in the fillet radius on the MPS were small when the aspect ratio was <1; in contrast, the variations increased when the ratio was >1. This indicated that horizontally long shaped aneurysms were less subject to variations based on the fillet radius than vertically long ones.
Figure 5.
A, Visualization of the MPS on the aortic wall in the fillet model. The portion of the normal aorta colored red is an artifact due to the boundary condition. B, Change in the peak value of the MPS in the axisymmetric model. AAA indicates abdominal aortic aneurysm; MPS, maximum principal stress.
Correlation of the Parameters
For the distribution map, we plotted the results shown above in a three‐dimensional (3‐D) graph with 3 axes, ie, the peak values of the MPS, vertical diameter/horizontal diameter (aspect ratio), and fillet radius/vertical diameter (Figure 6, right). To see the distribution in 2‐D form, we modified the 3‐D graph to a graph viewed from the direction of the z axis (Figure 6, left).
Figure 6.
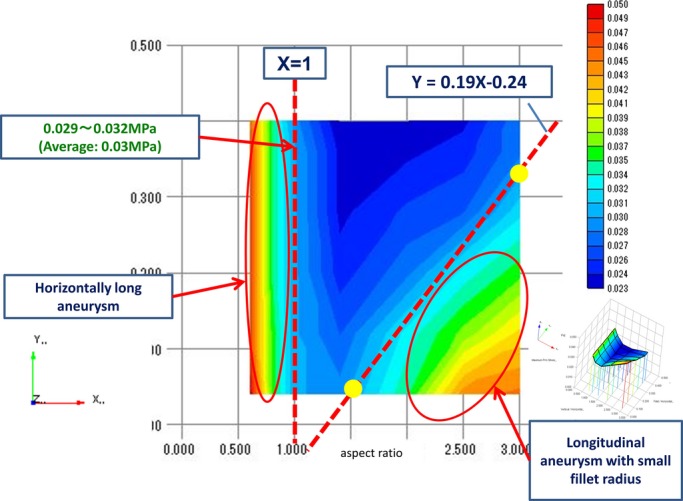
Three‐dimensional distribution map of the MPS with 3 axes; the peak value of the MPS, vertical diameter/horizontal diameter (aspect ratio), and fillet radius/vertical diameter (right). Modified 2‐D graph of the MPS distribution map viewed from the direction of the z axis (left). MPS indicates maximum principal stress.
We noted 2 areas with high peak stress in the graph shown in Figure 6. The area on the left where the aspect ratio was <1 represented the “horizontally long” hypothetical ellipse. Based on the value of MPS in this area (minimum value: 0.03 MPa), we marked a boundary in the right side for the “high peak stress” area, which represented the vertically long aneurysm with a small fillet radius. The borderline that we set was expressed with the formula: Y=0.19X−0.24, and drawing this line covered the area showing MPS >0.03 MPa.
Vector of Principal Stress
As the actual aortic wall is made of anisotropic material (tissue), its resistance to rupture differs for the circumferential and longitudinal directions. We compared the direction and value of the intermediate principal stress and MPS in the 2‐D axisymmetric model, and observed the trends for aortic wall rupture (Figure 7A). The direction of the MPS was circumferential at the connecting site of the aorta and the aneurysm and longitudinal at the peak point of MPS (Figure 7A). Regarding the intermediate principal stress, the direction was longitudinal at the normal aortic wall and circumferential at both the connection and the peak point of MPS (Figure 7C). The value of the intermediate principal stress was less than half of that of MPS in all the models analyzed in this study (Figure 7C). Therefore, the direction of the MPS would maximally affect wall rupture, and MPS itself was noted to be exerted longitudinally on the aortic wall. The aortic wall of the saccular aneurysm would tend to tear transversely at the peak point of the MPS, ie, at the top of the horizontally long aneurysm and at the shoulder of the longitudinal aneurysm.
Figure 7.
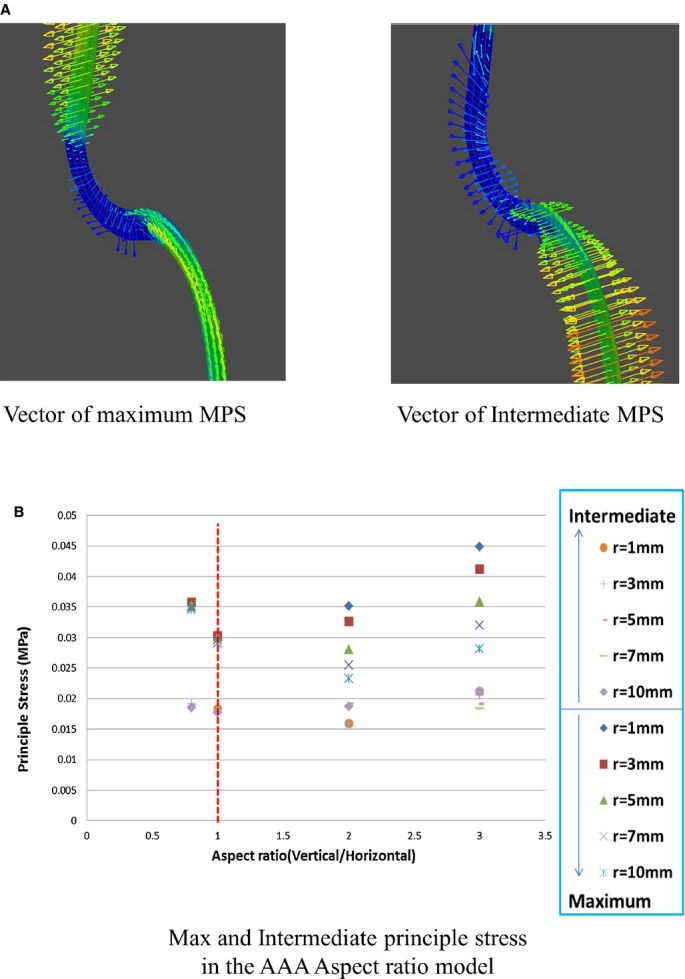
A, Vector of the MPS and that of intermediate principal stress. B, Maximum and intermediate principal stress in the aspect ratio model. MPS indicates maximum principal stress.
Patients’ Characteristics and Groups
Based on the summary of the AA model, an aneurysm might be defined as saccular when it fulfill the expressions; (1) X <1, and (2) Y <0.19X−0.24, which were inferred from the graph shown in Figure 7 (X: aspect ratio; Y: fillet/horizontal diameter). The expression (1) indicates that the hypothetical ellipse was horizontally long in shape. We evaluated each aneurysm using the measuring methodology shown above, and classified the thoracic AA patients into 3 groups as follows: patients who fulfilled expression (1) (group 1), those who met expression (2) (group 2), and the remaining patients (group 3) (Figure 8).
Figure 8.
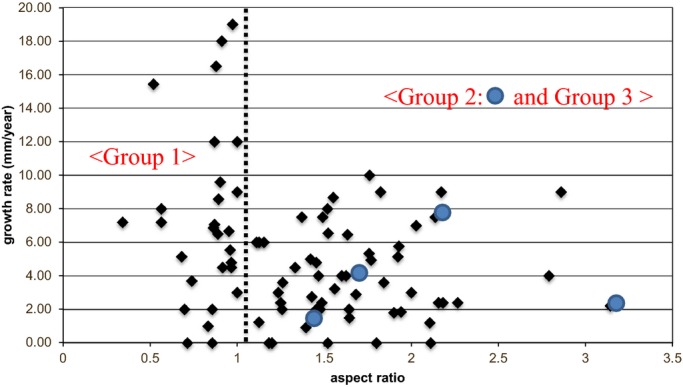
Distribution of the patients with thoracic aortic aneurysms in a graph showing growth rate and the aspect ratio. Large dot: Group 2 (n=4).
One author (T. A.) classified 27 aneurysms into group 1, 4 into group 2, and 50 into group 3, respectively. The baseline characteristics of each group are listed in Table 3. There were no significant differences among the groups with respect to the basic characteristics. The maximum AA diameter was not significantly different among the groups. The overall mean horizontal diameter was 32.1±12.1 mm, the mean aspect ratio was 1.4±0.54, and the mean fillet radius/horizontal diameter was 0.86±0.99.
Table 3.
Patient Characteristics of Each Group
| Variables | Group 1 n=27 | Group 2 n=4 | Group 3 n=50 | P Value |
|---|---|---|---|---|
| Age | 73.0±7.4 | 76.3±4.3 | 72.4±8.4 | 0.64 |
| Male sex, n (%) | 19 (70) | 3 (75) | 39 (78) | 0.82 |
| Aneurymal diameter (maximum) (mm) | 55.9±9.2 | 58.0±9.4 | 53.1±7.3 | 0.22 |
| Expansion rate (mm/year) | 7.45±5.13 | 3.66±2.47 | 4.17±2.67 | 0.002 |
| Comorbidities, n (%) | ||||
| Hypertension | 22 (81) | 3 (75) | 44 (88) | 0.46 |
| Ischemic heart disease | 9 (33) | 0 (0) | 15 (30) | 0.51 |
| Cerebrovascular disease | 1 (4) | 1 (25) | 5 (10) | 0.21 |
| Diabetes mellitus | 5 (19) | 0 (0) | 7 (14) | 0.87 |
| Smoking (ex‐ or current) | 20 (74) | 4 (100) | 35 (70) | 0.64 |
| Medication, n (%) | ||||
| Aspirin use | 6 (22) | 1 (25) | 15 (30) | 0.83 |
| Statin use | 12 (44) | 1 (25) | 16 (32) | 0.52 |
Aneurysm Progression
The follow‐up period for observation of the aneurysm maximum diameter was 13.1±9.2 months. The growth rate of AAs in group 1 was 7.45±5.13 mm/year; in group 2, 3.66±2.47 mm/year; and in group 3, 4.17±2.67 mm/year. The growth rate in group 1 was significantly higher than that in group 3 (P=0.002). No significant differences were observed between groups 2 and 3 (P=0.73).
Evaluation of Inter‐Observer Variability
The result of the groupings performed by the 3 observers are shown in Table 4. The distribution of the patients’ population was similar among all the 3 observers.
Table 4.
Inter‐Observer Agreement Rate and Kappa Values for Each Pairs of Observers and Average for All Pairs
| Pairs | Agreement Rate | Kappa values (95% CI) |
|---|---|---|
| TA/KH | 0.88 | 0.69 (0.51 to 0.87) |
| KH/YN | 0.93 | 0.80 (0.65 to 0.95) |
| YN/TA | 0.88 | 0.71 (0.54 to 0.88) |
| Average | 0.89 | 0.75 |
Discussion
Saccular aneurysms have been variously defined as follows: “a sac formed by localized dilatation of the wall of an artery” (Dorland's Medical Dictionary for Health Consumers), “saclike bulging on 1 side of an artery” (The American Heritage, Medical dictionary), and “a localized dilation of a small area of an artery, forming a saclike swelling or protrusion” (Mosby's Medical Dictionary), however; there is no established single definition for this condition. “An eccentric aneurysm due to weakening of 1 side of a vessel wall” is a unique definition by McGraw‐Hill Concise Dictionary of Modern Medicine, which appears to represent not only the morphology but also the wall characteristics and rupture risk involved in saccular aneurysms; however, it remains too abstract for clinical use. Without a clear definition of “saccular” aneurysms, vascular surgeons have historically perceived saccular AAs to have a greater rupture risk than fusiform ones and accordingly performed aneurysmal repair for saccular aneurysms with relatively small diameters that do not reach the generally accepted threshold for surgery (5 cm for abdominal AA and 6 cm for thoracic AA). We expect that our definition of saccular AA would help in preventing unnecessary surgery for small saccular AAs, which might be intrinsically safe in nature.
Although several factors contribute to the prognosis and development of AAs, hoop stress (the stress induced by pulling stress in the circumferential direction) is considered critical in causing AA rupture, with the effect being far greater than that of wall shear stress, axial stress, or radial stress.15 Since our study aimed to demonstrate only the theoretical rupture risk in the 2‐D AA model, we focused on circumferential stress alone and successfully simulated the site of MPS. In addition, our simulation could visualize the vector of MPS, which might indicate the direction of the rupture (Figure 7). It also revealed that the aneurysm ruptured from the top of the major axis of the aneurysmal ellipse, where the peak MPS was loaded.
Based on the theoretical data, we arrived at 2 formulae, which might define the saccular AA morphology. First, “the aspect ratio was less than 1” indicates that the hypothetical ellipse of the protruded aneurysm was horizontally long. Whether the AA is horizontally long or vertically long in shape was judged by placing the appropriate size of the circle tool on the image, touching both the hypothetical aortic line and the aneurysmal sac.
The next formula, fillet radius/horizontal axis ≤0.19 X aspect ratio – 0.24 represents the triangular area shown in Figure 6. Clinically, an aneurysm in this area would have a vertically long morphology with a sharp junction angle between the hypothetical ellipse and the tube (small fillet radius). Although we tend to regard an aneurysm with such sharp angle junctions as sac‐like or saccular, the group with such aneurysms did not show a greater expansion rate as compared with the non‐saccular group. Nevertheless, the number of patients in this group was very small, and further examinations are required to draw any conclusions in this regard. As such, shapes are typically caused by local dissection of the aortic wall, other factors relating to wall characteristics may affect the expansion rate to a greater extent. Thus, it may not be appropriate to characterize AA cases with a small fillet using our model, which only analyzed the AAs from a mechanical point of view.
Most biomechanical studies related to AAs use contrast‐enhanced CT images for constructing the 3‐D image, which cannot exactly describe the aneurysm's morphology if an intraluminal thrombus is present. Unfortunately, thus far, no commercial software is available that can automatically recognize the aneurysmal adventitia. In our thoracic AA patients, we arbitrarily selected a cross‐section of the multi‐planar reconstruction (MPR) that maximally emphasized the bulging aneurysm (Figure 3), and drew the outline of the aneurysm, as routinely done by most vascular surgeons. Surgeons discriminate the aneurysmal adventitia in the CT image based on their clinical experience, possibly by subtracting adjacent tissues such as vertebra, vena cava, or other retroperitoneal organs or by fleshing out the contrasted aneurysmal internal lumen containing an intra‐sac thrombus. Thus, outlining the aneurysmal shape still needs to be done manually and not by using software.
The manual method used in the present study involved adapting the circle tool to the hypothetical bulging aneurysm. This appeared to be reliable since the inter‐observer variability in our study was minimal, indicating a shared recognition of the aneurysm's morphology. This simple and clear method of identifying “saccular” AAs is expected to be useful in the clinical setting.
This study has certain limitations. First, we used the aneurysm expansion rate as the clinical outcome for judging saccular aneurysms. Observing AAs until rupture cannot be permitted ethically, and we noted some studies that regarded high expansion rates as a rupture risk.16–17 Second, as the actual aorta curves to a certain extent, the theoretical value for wall stress would differ from clinical data. Possibly, the rupture risk of a saccular aneurysm on the convex part of the curved aorta may be overestimated, while that of a saccular aneurysm on the concave part may be underestimated. For evaluating AAs occurring on the angulated part of the aorta more accurately, further development of the model is necessary. Third, we tested our model only with an ellipse of 25 and 35 mm in the horizontal axis; therefore, in the future, we need to compare the value of MPS between saccular and fusiform AAs with various axial diameters. Fourth, the 2‐D cross‐section of the clinical images might not represent the real bulging of the aneurysm. To predict the “real” rupture risk of the saccular aneurysm biomechanically, the deviation of the aneurysm wall from the aortic centerline should be calculated using 3‐dimensional analysis.
Although the current findings appeared to define the “saccular” aneurysm, supported by clinical data of thoracic AAs, it showed only 1 aspect of the aneurysm. It is necessary to evaluate further cases of AAs with longer observation periods to determine the true value of this model. In addition, in order to examine the actual rupture risk for each case, we need to take various mechanical factors, including the distribution of wall calcification, volume of the intra‐sac thrombus, and history of aortic dissection, into consideration.4,6 For the clinical application of this model, it is also important to identify the reasons underlying the formation of the unique and delicate “saccular” aneurysms.
Conclusion
Based on the biomechanical analysis of the simple aneurysm model and the clinical data of the thoracic AAs, we propose that “saccular” AAs can be defined as “horizontally long” shaped aneurysms wherein the aspect ratio is <1. Further biochemical and clinical research are essential for quantifying the real rupture risk of such saccular AAs.
Sources of Funding
This study is supported by a Grant‐in‐Aid for Scientific Research (B) from the Ministry of Education, Culture, Sports, Science and Technology, Japan.
Disclosures
None.
References
- 1.McNamara JJ, Pressler WM. Natural history of arteriosclerotic thoracic aortic aneurysms. Ann Thorac Surg. 1978; 26:468-473. [DOI] [PubMed] [Google Scholar]
- 2.Darling RC. Rupture atherosclerotic abdominal aortic aneurysm: a pathologic and clinical study. Am J Surg. 1970; 119:397-401. [DOI] [PubMed] [Google Scholar]
- 3.Katz DA, Littenberg B, Cronenwett JL. Management of small abdominal aortic aneurysms: early surgery vs watchful waiting. JAMA. 1992; 268:2678-2686. [PubMed] [Google Scholar]
- 4.Shang EK, Nathan DP, Sprinkle SR, Fairman RM, Bavaria JE, Gorman RC, Groman JH., III Impact of wall thickness and saccular geometry on the computational wall stress of descending thoracic aortic aneurysms. Circulation. 2013; 128:S157-S162. [DOI] [PubMed] [Google Scholar]
- 5.Vorp DA, Raghavan ML, Webster MW. Mechanical wall stress in abdominal aortic aneurysm: influence of diameter and asymmetry. J Vasc Surg. 1998; 27:632-639. [DOI] [PubMed] [Google Scholar]
- 6.Fillinger MF, Marra SP, Raghavan ML, Kennedy FE. Prediction of rupture risk in abdominal aortic aneurysm during observation: wall stress versus diameter. J Vasc Surg. 2003; 37:724-732. [DOI] [PubMed] [Google Scholar]
- 7.Truijers M, SchultzeKool LJ, van Sterkenburg SM, Fillinger MF, Blankensteijn JD. Wall stress analysis in small asymptomatic, symptomatic and ruptured abdominal aortic aneurysms. Eur J Vasc Endovasc Surg. 2007; 33:401-407. [DOI] [PubMed] [Google Scholar]
- 8.Fillinger MF, Raghavan ML, Marra SP, Cronenwett JL, Kennedy FE. In vivo analysis of mechanical wall stress and abdominal aortic aneurysm rupture risk. J Vasc Surg. 2002; 36:589-597. [DOI] [PubMed] [Google Scholar]
- 9.Venkatasubramaniam AK, Fagan MJ, Mehta T, Mylankal KJ, Ray B, Kuhan G, Chetter IC, McCollum PT. A comparative study of aortic wall stress using finite element analysis for ruptured and non‐ruptured abdominal aortic aneurysms. Eur J Vasc Endovasc Surg. 2004; 28:168-176. [DOI] [PubMed] [Google Scholar]
- 10.Shang EK, Nathan DP, Boonn WW, Lys‐Dobradin IA, Fairman RM, Woo EY, Wang GJ, Jackson BM. A modern experience with saccular aortic aneurysms. J Vasc Surg. 2013; 57:84-88. [DOI] [PubMed] [Google Scholar]
- 11.Nathan DP, Xu C, Pouch AM, Chandran KB, Desjardins B, Gorman JH, III, Fairman RM, Gorman RC, Jackson BM. Increased wall stress of saccular versus fusiform aneurysms of the descending thoracic aorta. Ann Vasc Surg. 2011; 25:1129-1137. [DOI] [PubMed] [Google Scholar]
- 12.Holzapfel GA, Gasser TC, Stadler M. A structural model for the viscoelastic behavior of arterial walls: continuum formulation and finite element analysis. Eur J Mech A Solids. 2002; 21:441-463. [Google Scholar]
- 13.Gasser TC, Görgülü G, Folkesson M, Swedenborg J. Failure properties of intraluminal thrombus in abdominal aortic aneurysm under static and pulsating mechanical loads. J Vasc Surg. 2008; 48:179-188. [DOI] [PubMed] [Google Scholar]
- 14.Raghavan ML, Webster MW, Vorp DA. Ex vivo biomechanical behavior of abdominal aortic aneurysm: assessment using a new mathematical model. Ann Biomed Eng. 1996; 24:573-582. [DOI] [PubMed] [Google Scholar]
- 15.Prinssen M, Verhoeven EL, Buth J, Cuypers PW, van Sambeek MR, Balm R, Buskens E, Grobbee DE, Blankensteijn JDDutch Randomized Endovascular Aneurysm Management (DREAM) Trial Group. A randomized trial comparing conventional and endovascular repair of abdominal aortic aneurysms. N Engl J Med. 2004; 351:1607-1618. [DOI] [PubMed] [Google Scholar]
- 16.Lederle FA, Wilson SE, Johnson GR, Reinke DB, Littooy FN, Acher CW, Ballard DJ, Messina LM, Gordon IL, Chute EP, Krupski WC, Busuttil SJ, Barone GW, Sparks S, Graham LM, Rapp JH, Makaroun MS, Moneta GL, Cambria RA, Makhoul RG, Eton D, Ansel HJ, Freischlag JA, Bandyk DAneurysm Detection and Management Veterans Affairs Cooperative Study Group. Immediate repair compared with surveillance of small abdominal aortic aneurysms. N Engl J Med. 2002; 346:1437-1444. [DOI] [PubMed] [Google Scholar]
- 17.Masuda Y, Takanashi K, Takasu J, Morooka N, Inagaki Y. Expansion rate of thoracic aortic aneurysms and influence factors. Chest. 1992; 102:461-466. [DOI] [PubMed] [Google Scholar]