

Abstract
We propose the formulation and characterization of solid microparticles as nasal drug delivery systems able to increase the nose-to-brain transport of deferoxamine mesylate (DFO), a neuroprotector unable to cross the blood brain barrier and inducing negative peripheral impacts. Spherical chitosan chloride and methyl-β-cyclodextrin microparticles loaded with DFO (DCH and MCD, respectively) were obtained by spray drying. Their volume-surface diameters ranged from 1.77 ± 0.06 μm (DCH) to 3.47 ± 0.05 μm (MCD); the aerodynamic diameters were about 1.1 μm and their drug content was about 30%. In comparison with DCH, MCD enhanced the in vitro DFO permeation across lipophilic membranes, similarly as shown by ex vivo permeation studies across porcine nasal mucosa. Moreover, MCD were able to promote the DFO permeation across monolayers of PC 12 cells (neuron like), but like DCH did not modify the DFO permeation pattern across Caco-2 monolayers (epithelial like). Nasal administration to rats of 200 μg DFO encapsulated in the microparticles resulted in its uptake into the cerebrospinal fluid (CSF) with peak values ranging from 3.83 ± 0.68 μg/mL (DCH) and 14.37 ± 1.69 μg/mL (MCD) 30 min after insufflation of microparticles. No drug CSF uptake was detected after nasal administration of a DFO water solution. The DFO systemic absolute bioavailabilities obtained by DCH and MCD nasal administration were 6% and 15%, respectively. Chitosan chloride and methyl-β-cyclodextrins appear therefore suitable to formulate solid microparticles able to promote the nose to brain uptake of DFO and to limit its systemic exposure.
Keywords: Deferoxamine mesylate, chitosan chloride, methyl-β-cyclodextrin, nasal formulations, nose-to-brain transport, pharmacokinetic studies
1. Introduction
Deferoxamine (DFO) is a hexadentate chelator binding ferric iron at a 1:1 molar ratio. The iron complex of DFO, ferrioxamine, is highly stable thereby preventing iron ions from catalyzing redox reactions that lead to free radical formation (alternately “iron ions from participating in free radical reactions”) [1,2]. DFO as mesylate salt is the treatment of choice for acute iron intoxication and chronic iron overload due to transfusion-dependent anemia [2,3]. Due to its poor oral bioavailability and short plasma half-life, DFO is only used parenterally, often having a negative impact on patients’ quality of life due to secondary effects [2]. A clinical trial of iv DFO for intracerebral hemorrhage was halted due to an increased incidence of acute respiratory distress syndrome [4]. This should provide more rationale for an intranasal approach.
Direct brain targeting of DFO could be beneficial for the treatment of some diseases characterized by central nervous system (CNS) iron dysregulation. Data concerning animal and human studies show that DFO has diverse neuroprotective effects and its use is beneficial in Huntington’s [5,6], Alzheimer’s [7,8], Parkinson’s [9–11] disease, amyotrophic lateral sclerosis [12], prionopathies [13], neuroferritinopathy [14], intracerebral hemorrhage [3,15], ischemic stroke [16,17], multiple sclerosis [18], and spinal cord injury [19]. Unfortunately, most of these studies used forms of systemic administration or intracranial injections that are not suitable for human use [9]. Whereas some studies indicate that DFO can rapidly penetrate the blood-brain barrier (BBB) and accumulate in the brain tissue in significant concentrations after systemic administration [3,20,21], other authors claim that the BBB is relatively impermeable to DFO [6,18,22]. Many therapeutic agents, including DFO, are rapidly delivered to the CNS by intranasal delivery and have exhibited therapeutic effects in both animals and humans [8,17,23–25]. The advantages of intranasal administration of DFO include targeting of the brain, reducing systemic exposure with possible side effects, and a noninvasive rapid method of administration [26], which rapidly bypasses the BBB reducing systemic exposure. Compared with intravenous administration, intranasal treatment with DFO increased targeting to the frontal cortex by 271-fold [17]. In this study, DFO was delivered in the nose as solution in saline or phosphate buffer solution. This approach, however, fails to take account of several factors limiting the nasal absorption of drugs, such as the (1) low membrane permeability, especially for the larger molecular weight and polar drugs; and (2) a rapid clearance of the drug formulation from the nasal cavity as a result of the mucociliary clearance mechanism [27]. It is possible to greatly improve the nasal absorption of polar drugs by administering them in a drug delivery system and in particular in solid formulations. Powders tend to stick to the moist surface of the nasal mucosa before being dissolved and cleared [28]. Considering the above-mentioned aspects, our aim was to formulate nasal drug delivery systems able to increase the nose to brain transport of DFO. The effect of two different penetration enhancers, methyl-β-cyclodextrin and chitosan, was studied.
Numerous studies have demonstrated that cyclodextrins are efficient absorption enhancers in nasal drug delivery [29,30]. In the case of water-soluble drugs, CDs enhance drug absorption and/or bioavailability because of their ability to form inclusion complexes with specific membrane lipids, such as cholesterol, phosphatidylcholine and sphingomyelin, which cause perturbation of bilayer integrity and increase membrane fluidity [31]. Chitosan has the additional effect of reversibly opening tight junctions, with the potential to increase extracellular transport along olfactory and trigeminal nerve pathways into the CNS [32]. Chitosan, moreover, forms electrostatic interactions with the negatively charged surface of epithelial cells to reduce clearance from the nasal epithelium. This biodegradable polymer absorbs water from the mucus layer in the nasal cavity, swells and forms a gel like layer prolonging drug residence time at the site of absorption and improving its bioavailability [33].
2. Materials and methods
2.1 Materials
Deferoxamine mesylate (aprox. 95% TLC) and 2- Propanol were purchased from Sigma-Aldrich (St. Louis, USA). Chitosan chloride, Protasan UP CL 113 (Mw: 160000 g/mol; deacetylation degree, 86%) were purchased from NovaMatrix/FMC Biopolymer (Sandvika, Norway). Methyl-β-cyclodextrin, Cavasol® W7 M Pharma (Mw: 1300 g/mol; Molecular substitution: 1.7) was purchased from Wacker-Chemie GmbH, (München, Germany). Phenyl Trimethicone, Dow Corning 556 cosmetic grade fluid was obtained from Dow Corning (Brussels, Belgium). Ultra-pure grade water was obtained by Millipore filtration system (Billerica, MA, USA). All used solvents were of analytical grade. Male Sprague–Dawley rats were purchased from Harlan Italy S.r.l., Udine, Italy. Caco-2 and PC-12 cell lines were purchased from Sigma-Aldrich (St. Louis, USA).
2.2 Preparation of microspheres
Two different loaded formulations were prepared: one containing chitosan chloride (DCH) and the other one based on methyl-β-cyclodextrin (MCD). The instrument used was Büchi Mini Spray Dryer B-191 (Büchi Laboratoriums-Technik AG, Flawil, Switzerland). A precisely weighed quantity of chitosan chloride or methyl-β-cyclodextrin was dissolved in MilliQ water; DFO was added after the complete dissolution of the polymer. The resultant feed solution contains a total amount of solid (DFO and polymer) in solution equal to 1% (w/v) with a drug-polymer ratio of 1–2 (w/w). The solution was aspirated by a peristaltic pump, set up at 8%, and atomized through the 0.7 mm nozzle within the nebulization chamber. Here, a hot air flow (100 °C), generated by 90% aspirator, forced the rapid evaporation of the solvent and, consequently, the formation of the solid microparticles inside the high-performance cyclone. At the end of the process, the solid particles were collected and placed in a desiccator until the moment of their use. The yield of production was calculated. In order to verify the different properties and behaviours between microspheres and simple mixtures, feed solutions were also freeze-dried for approximately 8 h, using a Lio 5P Cinquepascale (Trezzano sul Naviglio, Italy). These formulations were denominated DCHL and MCDL. Also a water solution of DFO was freeze-dried and coded as DFOL. Unloaded formulations were also prepared, as comparison and coded as CH and MC.
2.3 Evaluation of drug content and encapsulation efficiency
The drug content, which corresponds to the real amount of drug loaded in the microspheres, was determined by dissolving 10 mg of each formulation in 10 mL of MilliQ water and then adding pH 6.5 phosphate buffer up to 100 mL. A sample (1 mL) was collected and analyzed by HPLC, according to the method described below. The result obtained is the average of three determinations (n = 3; ± standard deviation, SD). Encapsulation efficiency was calculated [34].
2.4 HPLC analysis of deferoxamine mesylate
For the quantification of DFO in buffer samples, a Varian ProStar 210 with AutoSampler 410 and a PDA photodiode array detector (Varian Inc Scientific Instruments, Walnut Creek, CA USA) was employed. The chromatographic separation was performed on a C18 column with polar endcapping (Phenomenex Synergi Hydro-RP 80A, 150 × 4.6 mm I.D. and 4μm of particle size). The HPLC analysis was conducted at room temperature with a flow rate of 1.2 mL/min and UV detection at 210 nm. The volume of the injected samples was 20 μl and the analysis time was 5 min per sample. The binary mobile phase consisted of acetonitrile (pH 4.6 with 0.5M H3PO4) and a 0.1M KH2PO4 (3.4 g/250 mL), 120 mg/L (30 mg/250 mL) 1-eptane sulphonic acid sodium salt solution ratio 17:83 (v/v) adjusted to pH 4.60 by 0.5 M phosphoric acid. All data were collected in triplicate and processed using Varian Star Chromatography Workstation, system control, version 6.20 (Varian, Inc. Cary, NC, USA). Concentrations of analytes were calculated by interpolation of their respective standard curves.
2.5 Particle Size Analysis
Particle size was quantified via Coulter Laser Diffraction (Coulter LS 100Q Laser sizer, Beckman Coulter, Miami, USA). 2-Propanol was used as dispersion fluid for DCH formulation, while Dow Corning 556 was employed in case of MCD and MCDL. Microspheres (2 mg) were dispersed in the medium, sonicated for 30 s and analyzed under gentle magnetic stirring. Three dispersions were made for each formulation and the values reported are the averages of three determinations for each dispersion (n=9). The average particle size of the microspheres was reported as the mean volume-surface diameter, dvs (μm) and the particle size distribution was graphically expressed by reporting the distribution curves obtained by plotting the volume of particles in percentage versus size (μm) shown in logarithmic scale. The coefficient of uniformity (CU) was also calculated by applying the following formula: . The values of d10 and d90 indicate that, respectively, 10% and 90% of the particles of the sample have a diameter less than the number indicated. A CU value approaching 1 indicates a dimensionally uniform sample.
2.6 Morphological Analysis
The morphological attributes of the microparticles were studied by Scanning Electron Microscopy (SEM). A small amount of powder was spread on an aluminium stub, which was placed after gold sputtering in an SEM chamber (Zeiss EVO LS10, Zeiss, Germany).
2.7 Water Uptake
The ability of the formulations to absorb water when placed in contact with an aqueous fluid was measured using a modified apparatus of Enslin. A sample of each formulation (2 mg) was uniformly dispersed on a disk of paper filter (d = 1 cm, A = 0.78 cm2), saturated with phosphate buffer pH 6.5, which was placed on a porous septum. The volume of buffer absorbed by the formulation within 60 min was measured. The result obtained is the average of three determinations (n = 3; ± SD).
2.8 True Density and Aerodynamic Diameter
True density of loaded microspheres was measured by helium pycnometry (Micromeritics Accupyc II 1340 Analysis system, Peschiera Borromeo, Italy) at 21 °C. Microparticles of known mass were transferred into the cell of the instrument (1.03 cm3 volume). The density (ρ) of the powder was determined in triplicate for each batch as follows: ρ = M/V, where M is the mass per each batch of microspheres and V is the average volume occupied with powder, calculated from the 5 cycles of emptying and puffiness with helium. The aerodynamic diameter was calculated. Assuming the particle shape to be spherical, the relation between mass mean aerodynamic diameter, dae, and geometrical diameter, dg, is given by: dae = dg √ρ, with ρ being the true density of particles.
2.9 Solid state characterization
Drug, polymers and formulations were characterized by X-ray diffraction (XRD). XRD analyses were performed at room temperature with a Siemens D5000 diffractometer equipped with a copper tube and a graphite monochromator on the diffracted beam. The acquisition parameters were 40 kV, 30 mA, 2θ range 2–50°, step size 0.020° (2θ), time per step 2 s.
2.10 In vitro permeation test
Experiments were performed using a modified Franz diffusion system incorporating three in-line flow-through diffusion cells [34]. Cellulose acetate membranes (pore size 0.45 μm) were employed as hydrophilic layer; regenerated cellulose membranes (pore size 0.45 μm) saturated with octanol were chosen as lipophilic layer. An amount of microspheres equivalent to about 2.5 mg of DFO was uniformly distributed above each membrane. Then, 1 mL of acceptor fluid was taken at predetermined time intervals (0–120 min) and analyzed by HPLC. The withdrawn volume was restored with fresh buffer at 37±0.5 °C. The results reported are the mean of three determinations and are expressed as cumulative amount of DFO permeated per unit of time. The effective permeability coefficient, Peff, under steady state conditions across the synthetic membranes has been mathematically expressed, as follows: Peff = (dc/dt)ssV/(ACD), where (dc/dt)ss was determined by the slope of the plot of the permeated amount versus time in the steady state, A is the permeation area, V is the volume of the receiver compartment and CD is the initial concentration of DFO in donor compartment [35]. The Transport Enhancement Ratio (TER) of formulation compared to the drug was calculated from Peff values: TER = Peff (formulation)/Peff (drug)
2.11 Ex vivo drug permeation study
This procedure was similar to the in vitro permeation method, replacing the synthetic membrane with fragments of porcine nasal mucosa, obtained from the local slaughterhouse [36]. As acceptor medium, phosphate buffer pH 6.5 has been used. At predetermined time intervals, samples (1mL) of acceptor medium were taken and the volume was replaced with fresh buffer at 37±5 °C. Samples were passed through a 0.45 μm cellulose acetate filter before HPLC analysis. The results reported are the mean of three determinations and are expressed as cumulative amount of DFO permeated per unit of time (n = 3; ± SD). The effective permeability coefficient under steady state conditions across the nasal mucosa and the Transport Enhancement Ratio have been calculated as described above.
2.12 Cellular uptake studies
Cell uptake of DFO released from microspheres was assessed using Caco-2 and PC-12 cells as model of epithelial and neuron-like phenotypes, respectively. Caco-2 cells (human colorectal adenocarcinoma), were cultured in flasks in Dulbecco’s Modified Eagle’s Medium (DMEM, Sigma-Aldrich) supplemented with 1% (v/v) MEM nonessential amino acids (Invitrogen), 10% (v/v) fetal bovine serum (Sigma-Aldrich), 1% (v/v) penicillin and streptomycin solution (Lonza) and were grown in a humidified atmosphere of 5% CO2 at 37 °C. Cells were subcultured at 80% confluence. PC-12 cells (rat pheochromocytoma, ECACC) were cultured in flasks in differentiation medium (RPMI-1640 medium, Sigma-Aldrich) supplemented with 10% (v/v) horse serum, 5% (v/v) fetal bovine serum (not of USA origin, Sigma-Aldrich) and L-glutamine 2 mM (Sigma-Aldrich) and were grown in a humidified atmosphere of 5% CO2 at 37 °C. For differentiation to a neuron-like phenotype, cells were suspended in RPMI-1640 medium, supplemented with 1% horse serum, 100 ng/mL nerve growth factor (NGF) (Sigma-Aldrich). Medium was replaced every 2–3 days. Six-day differentiated PC-12 cells were used as an in vitro model for neuron drug permeation studies. Caco-2 cells were harvested from flasks with trypsin–EDTA (BiocromAG) and seeded in Transwell PET inserts (12 well, 0.4 μm pore size, Corning, USA) at a concentration of 1×10⁵ cells/membrane (number passage 50). PC-12 cells, previously grown in suspension, were seeded in Transwell-COL PTFE insert (12 well, 0.4 μm pore size, collagen coated, Corning, USA) at a concentration of 3×10⁴ cells/membrane and number passage of 5. Cell monolayers were washed twice with warm phosphate buffered saline (PBS) and basolateral and apical compartments were filled with 1.5 and 0.5 mL of DMEM (Caco-2 cells) or RPMI-1640 (PC-12 cells). Microspheres containing 2.6 mg DFO and the same quantity of non-formulated drug were suspended or solubilized in 0.15 mL medium and added to the apical side. Cells were incubated in a humidified atmosphere of 5% CO2 at 37 °C. At fixed intervals (7.5, 15, 30, 45, 60 min), aliquots (20 μl) from basolateral side were collected and replaced with an equal volume of fresh medium. Monolayer integrity was verified before and during the experiments by trans epithelial electric resistance (TEER). DFO was quantified by HPLC. Drug apical concentrations at 7.5 min and 60 min were also evaluated. All tests were performed in duplicate.
2.13 Liquid chromatographic–mass (LC-MS) spectrometric analysis
LC-MS analyses for in vivo pharmacokinetic studies and were undertaken with a micro HPLC Surveyor (Thermo Scientific) coupled to a LTQ XL Linear Ion trap MS detector (Thermo Scientific). Chromatographic conditions were applied to a Luna HST C18 100 × 2.1 mm column (Phenomenex) packed with 2.5 μm particles. Mobile phases were mixtures of formic acid 0.1% v/v in water (channel A) and formic acid 0.1% v/v in methanol (channel B): the gradient profile ranged from 50/50 water/methanol to 10/90 in 5 min, then it continued isocratically for 3 min. Column flow rate was 150 μL/min at 25° C. The following MS conditions were applied to the electrospray ion source (ESI): capillary temperature 275° C; spray voltage 4 kV; capillary voltage 50 V; tube lens voltage 100 V. The molecular ions for DFO, aluminoxamine (AO) and ferrioxamine (FO) were detected at 561.4, 585.3 and 614.3 m/z, respectively. The internal standard CPA was detected at 336 m/z. All ions were in the form [M+H]+. Target analytes in samples were DFO, AO and FO and the sum of these three forms was considered as total amount. Quantitative determination is undertaken by internal standard calibration with the use of N6-cyclopentyladenosine (CPA). DFO, AO and FO were co-eluted from the chromatographic column with retention time of 4.5 min, while CPA has a retention time of 6 min. Calibration range was 0.05–50 μM for both determinations in plasma and cerebrospinal fluid (CSF) matrices. For CSF simulation, standard aliquots of balanced solution (PBS Dulbecco’s without calcium and magnesium) in the presence of 0.45 mg/mL bovine serum albumin (BSA) were employed [37,38]. Calibration data were fitted to straight lines in both cases with R2 values of 0.9910 and 0.9929 for plasma and CSF, respectively (P < 0.001). Limit of detection (LOD) and limit of quantification (LOQ) were estimated with a confidence level of 95% by using the Huabaux and Vos method. Calibration in plasma matrix was characterized by LOD = 0.15 μM (0.08 μg/mL) and LOQ = 0.5 μM (0.28 μg/mL), while for CSF LOD = 0.24 μM (0.13 μg/mL) and LOQ = 0.8 μM (0.45 μg/mL). The average recovery of total analytes was estimated as 85%. Recovery for CPA was already tested in previous work [39]. Chromatograms and related MS/MS spectra referred to a DFO standard solution and to DFO detected in CSF are reported, as representative (Supplemental Fig. S1a–b). The positive ion mode MS/MS spectra are those expected for DFO by fragmentation of parent ion 561 m/z. Daughter ions correspond to those reported in literature (201, 243, 319.2, 361.2, 401.2 and 443.2 m/z) [40].
2.14 In vivo Deferoxamine Administration and Quantification
Male Wistar rats (200–250 g) anaesthetized by a continuous inhalation of isoflurane/air (1.5% mixture) during the experimental period, received a femoral intravenous infusion of 0.2 mg/mL deferoxamine dissolved in a medium constituted by 20% (v/v) DMSO and 80% (v/v) physiologic saline, with a rate of 0.2 mL/min for 5 min. At the end of infusion and at fixed time points, blood samples (300 μL) were collected and CSF samples (50 μL) were withdrawn by cisternal puncture method described by van den Berg et al. [41]. CSF samples (10 μL) were immediately injected into HPLC system for LC-MS analysis. Blood samples were centrifuged at 4000 × g for 15 min, then 100 μl of plasma was quenched in 300 μL of ethanol (4 °C); 100 μL of internal standard (1 μM CPA) was added. After centrifugation at 13,000 × g for 10 min, 300 μL aliquots were reduced to dryness under a nitrogen stream, dissolved in 200 μL of mobile phase and, after filtration, 10 μL was injected into the HPLC system for LC-MS analysis. The in vivo half-life of deferoxamine in the blood was calculated by nonlinear regression (exponential decay) of concentration values in the time range within 2 hours after infusion and confirmed by linear regression of the log concentration values versus time. Nasal administration of DFO was performed on anaesthetized rats laid on their backs, following two procedures. The first one consisted of the introduction of 40 μL of an aqueous solution of DFO (5 mg/mL) in one nostril of rats using a semiautomatic pipette which was attached to a short polyethylene tubing. The tubing was inserted approximately 0.6–0.7 cm into each nostril. After the administration, blood (300 μL) and CSF samples (50 μL) were collected at fixed time points, and they were analyzed with the same procedures described above. Four rats were employed for nasal administration of DFO solution. The second procedure was based on the insufflations of DFO-loaded microparticles (DCH and MCD) to one nostril of anaesthetized rats by single dose Monopowder P® insufflators (Valois Dispray SA, Mezzovico, Switzerland) [42] loaded with about 0.7 mg DFO microparticles (corresponding to about 200 μg of DFO). Blood (300 μL) and CSF samples (50 μL) were collected at fixed time points, and they were analyzed with the same procedures described above. Four rats were employed for nasal administration of each preparation. All in vivo experiments were performed in accordance with the guidelines issued by the Italian Ministry of Health (D.L. 116/92 and D.L. 111/94-B), the Declaration of Helsinki, and the Guide for the Care and Use of Laboratory Animals as adopted and promulgated by the National Institute of Health (Bethesda, Maryland). The protocol of all the in vivo experiments has been approved by Local Ethics Committee (University of Ferrara, Ferrara, Italy). Any effort has been done to reduce the number of the animals and their suffering. The area under concentration curves of DFO in the blood and CSF (AUC, μg/mL min) were calculated by the trapezoidal method. All the calculations were performed by using the computer program Graph Pad Prism (GraphPad Software Incorporated, La Jolla, CA, USA).
2.15 Statistical Analysis
Data were analyzed using the nonparametric Kruskal–Wallis test; individual differences were evaluated using a post hoc Dunn’s multiple comparison test (GraphPad Prism, version 6.02; GraphPad Software Incorporated). When suitable, analysis of variance (ANOVA) followed by a Turkey test was done.
3. Results
3.1 Evaluation of yield of production, drug content and encapsulation efficiency
Microspheres prepared by spray-drying resulted in production yields exceeding 50%. As expected, yields were higher for formulations produced by lyophilization (Table 1). Real drug content was very close to theoretical values and the encapsulation efficiency ranged from 93 to 98% (Table 1). These parameters are not affected by the excipient used (P > 0.05).
Table 1.
Results of the yield of production, drug content and encapsulation efficiency (mean ± SD). Volume-surface diameter (dvs) and coefficient of uniformity (CU) of loaded and unloaded formulations (value ± SD)
| Formulation | Yield of production (%) | Drug content (%) | Encapsulation efficiency (%) | dvs (μm) | CU |
|---|---|---|---|---|---|
| DCH | 63.18 ± 6.76 | 30.77 ± 0.25 | 92.72 ± 1.24 | 1.77 ± 0.06 | 0.26 ± 0.01 |
| MCD | 55.62 ± 3.45 | 31.71 ± 3.39 | 95.07 ± 10.04 | 3.47 ± 0.05 | 0.17 ± 0.00 |
| DCHL | 95.90 ± 5.80 | 32.92 ± 0.82 | 98.02 ± 2.80 | 1.92 ± 0.01 | 0.20 ± 0.00 |
| MCDL | 72.47 ± 8.20 | 32.45 ± 1.05 | 97.54 ± 3.49 | 3.81 ± 0.09 | 0.13 ± 0.01 |
3.2 Particle Size Analysis
Cyclodextrin microparticles had a larger volume-surface diameter (dvs) compared with chitosan particles (Table 1, P < 0.01); no significant differences were observed between loaded and unloaded microspheres (P > 0.05). Distribution curves of loaded microspheres were almost superimposed with those of the drug-free formulations (Supplemental Fig. S2). All formulations had a wide size distribution, as indicated by CU, that decreased in the range order DCH>CH>MCD>MC (P < 0.05). It was not possible to analyze the size of the DCHL particles because chitosan formed a sponge-like film as seen on SEM. MCDL particles had dimensions substantially greater and more heterogeneous than its counterpart produced by spray-drying: the dvs was 9.29 ± 0.50 μm and the CU was 0.07 ±0.01 (P<0.05).
3.3 Morphological analysis
Chitosan and cyclodextrin microspheres had distinct morphologies. DCH had a spherical shape and smooth surface (Figure 1 left), whereas multiple invaginations were present in MCD particles (Figure 1 right).
Figure 1.

Images obtained by SEM of DCH (left) (10.17 KX) and MCD (right) (20.00 KX)
No significant morphological changes were observed with microsphere loading. SEM pictures showed that freeze-dried formulations had a very different morphology compared with the corresponding microspheres. DCHL had crumpled surfaces resembling dry leaves. MCDL was less homogeneous: with particles of variable dimensions having both curved and smooth surfaces. The free drug also changed its morphology when freeze-dried; DFO as received showed aggregates with irregular surfaces, heterogeneous for dimension and shape, whereas the lyophilized drug formed drapes with smoother surfaces, sometimes having filaments on the rims (Supplemental Fig. S3).
3.4 Water Uptake
Formulations containing cyclodextrin absorbed very little water and then rapidly solubilized (Figure 2). Chitosan-based formulations absorbed significantly more water (P < 0.01), regardless of preparation method.
Figure 2.

The water uptake capacity (μl/mg) of the microspheres as well as freeze-dried formulation compared to the free drug as received. Data are reported as the mean value ± SD (n = 3).
3.5 True Density and Aerodynamic Diameter
Absolute densities of DCH and MCD microspheres were very similar (1.414 ± 0.003 and 1.414 ± 0.001 g/cm3, respectively) (P > 0.05), and did not differ from that of drug as received (1.371 ± 0.001 g/cm3, P > 0.05). The freeze drying process increased the density of DFOL (2.196 ± 0.058 g/cm3) and DCHL (1.663 ± 0.045 g/cm3), but decreased that of MCDL (1.355 ± 0.005 g/cm3) compared with that of the corresponding spray dried preparation (P < 0.05). Aerodynamic diameter (dae) ranged from 1.10 and 1.16 μm for MCD and DCH, respectively (P > 0.05).
3.6 Solid state characterization
The XRD pattern of DFO (Figure 3) shows that it has a crystalline structure, with sharp peaks (i.e. the high ratio signal/noise) indicating a high degree of crystallinity. The patterns of MC and CH demonstrate that these polymers are amorphous (Figure 3). In particular, MC shows two main broad reflections at about 11° and 18° of 2θ, and a third, weaker, at about 24°, whereas the XRD pattern of CH is characterized by two slight humps at about 12° and 24° of 2θ. MCD, the MC-DFO formulation, has an amorphous structure. The DFO peaks are not present in the XRD pattern, that is superimposable to that of MC except for the weaker intensity of the first broad reflection (Figure 3). The formulation DCH is also amorphous; the XRD pattern is perfectly superimposable to that of CH. The freeze-drying process led to the amorphization of the pure drug (DFOL in Figure 3). Conversely, lyophilization did not produce significant variations in the XRD patterns of the pure polymers, or of the formulations MCDL and DCHL with respect to their spray-dried counterparts (XRD patterns not reported).
Figure 3.

XRD pattern of: DFO, MC, MCD, CH, DCH and DFOL.
3.7 In vitro permeation test
The in vitro permeation profiles of the drug and formulations are illustrated in Figure 4. DFO as received permeated the hydrophilic membrane more rapidly than membranes saturated with octanol (P < 0.01) in the range between 15–120 min. After freeze-drying, this difference was not observed (P > 0.05).
Figure 4.

The permeation profiles of DFO through hydrophilic (solid line) and lipophilic (dotted line) membranes from spray dried (filled symbol) and freeze-dried (empty symbol) formulations of the same concentration. Profiles are compared with those of drug as received and after freeze-drying. H and O letters have been used to indicate the permeation through hydrophilic and lipophilic membranes, respectively. Data are reported as the mean ±S.D of three independent experiments.
Encapsulation in microspheres affected the permeation behavior of DFO. Both materials reduced the cumulative amount of drug passing through the hydrophilic membrane (P < 0.01). Chitosan reduced the permeation of loaded drug through lipophilic membranes, whereas methyl-β-cyclodextrin increases it (P< 0.05). This was evident by observing the Peff under steady state conditions (Figure 5). MCD demonstrated higher flux through lipophilic membranes when compared with DCH, as also deductible by TER values which are 1.63 and 0.12, respectively. The permeation profiles of the freeze-dried formulations did not differ from the corresponding spray dried formulations in the applied conditions (P > 0.05). The presence of DFO and excipient at the same time in the freeze-dried powders modified the Peff of drug alone through both membrane types, increasing the TER values from 0.22 to 1.27 for DCHL and MCDL, respectively (P < 0.05), indicating that CD was the most effective in facilitate the permeation of DFO through the two membranes.
Figure 5.

Peff (bars) and TER values (line) of formulations compared with drug. Error bars indicate standard deviation of three independent measurements. H and O letters have been used to indicate the permeation through hydrophilic and lipophilic membranes, respectively. P < 0.05: *DCH H versus (vs.) MCD H, DCH H vs. DFO H; #DCHL H vs. MCDL H, DCHL H vs. DFOL H; §DCH O vs. MCD O, DCH O vs. DFO O; $MCD O vs. DFO O; ‡DCHL O vs. MCDL O, DCHL O vs. DFOL O; †DFO H vs. DFO O, DFO H vs. DFOL H.
3.8 Ex vivo drug permeation study
All profiles were characterized by a lag time that increased from 15 to 30 and 60 min in case of DFO, MCD and DCH, respectively (Figure 6) which is compatible with the water behavior of the carrier and consistent with the water uptake and in vitro permeation results. Afterwards, MCD and DFO show the same permeation rates (P > 0.05), that are higher than that of DCH. At the end of the test, almost 50% of DFO as received and loaded in MCD was recovered in the acceptor medium. On the contrary, only 30% of drug encapsulated in DCH microspheres permeated nasal mucosa at the same time. The Peff under steady state conditions are 3.28 ± 0.20 and 1.67 ± 0.16 mg/cm2 min for MCD and DCH, respectively (P < 0.01).
Figure 6.

Ex vivo permeation profiles of DFO from microspheres. Profiles are compared with that of DFO as received. Data are reported as the mean ±S.D of three independent experiments.
3.9 Cellular uptake studies
Permeation capacity of DFO released from microspheres through Caco-2 and PC-12 cells was evaluated (Figure 7). Cell monolayers maintained their integrity during the experiments: TEER remained on a high level (Supplemental Fig. S4). All formulations showed the same permeation profiles through epithelial cells, superimposable to drug (P > 0.05). On the contrary, MCD permitted a faster release and passage of drug through PC-12 cell monolayers (P<0.05), in the range of 15 to 45 min. The permeation rate of MCD and DFO was the same, regardless the cell phenotypes (P> 0.05). Furthermore, after 7.5 min and 60 min, the amount of drug in the donor compartment was measured (Figure 8). From the difference between the amount of DFO permeated and recovered, the percentage of drug inside cells was calculated. Chitosan microspheres rapidly released about 44% of drug that remained in the cells and then slowly diffused; the leftover amount persisted in the microspheres until 60 min, regardless the cells used. On the contrary, the drug released from MCD remained for the longest time in the donor compartment and only 15% and 30% of DFO were in Caco-2 and PC-12 cells, respectively, after 7.5 min. DFO as received had the same behavior of MCD.
Figure 7.

Permeation profiles of DFO from microspheres through Caco-2 (filled symbol) and PC-12 cells (empty symbol). Profiles are compared with that of DFO as received. Data are reported as the mean ±S.D of two independent experiments.
Figure 8.

Percentage of drug permeated in the acceptor medium, recovered in the donor compartment (no permeated) and calculated into the cells after 7.5 min and 60 min through Caco-2 (left) and PC-12 cell lines (right). Error bars indicate standard deviation of two independent measurements.
3.10 In Vivo DFO Administration
DCH and MCD were tested for nasal administration of deferoxamine in order to verify its potential uptake into the CNS. Nasal administration of an aqueous solution of DFO was also tested as control. The analysis of rat blood samples following the intravenous infusion of 0.2 mg of deferoxamine indicated that the drug concentration in the blood stream was 6.40 ± 0.38 μg/mL and decreased over time with an apparent first order kinetic (n = 6, r = 0.980, P < 0.01) and a half-life of 15.4 ± 1.8 min (Figure 9). No DFO was detected in CSF within 120 min of intravenous administration.
Figure 9.
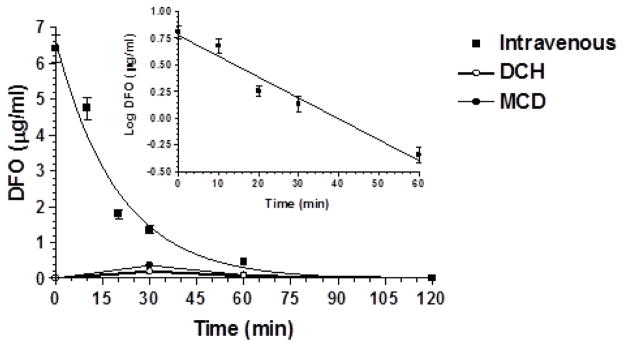
Elimination profile of DFO after 0.2 mg infusion to rats. Data are expressed as the mean ± SD of four independent experiments. The elimination followed an apparent first order kinetic, confirmed by the semilogarithmic plot reported in the inset (n = 6, r = 0.980, P < 0.01). The half-life was calculated to be 15.4 ± 1.8 min. The figure reports also the profile of plasma concentrations of DFO following nasal administration of the same dose of the drug encapsulated in DCH and MCD microparticles.
3.11 Nasal DFO Administration
Nasal administration of pure DFO as powder was not performed, due to the very low dose required (about 200 μg in rats). Therefore, as control, we employed a water solution of the raw drug. No significant amounts of DFO were observed in blood or CSF within 120 min of treatment (data not shown). On the contrary, nasal administration of the powder constituted by the loaded DCH and MCD microparticles (0.7 mg, about 200 μg of DFO) produced detectable DFO levels in both blood and CSF. Following the nasal administration, the peak plasma concentration was detected at 30 min, with values just above the LOD of the analytical method (0.19 ± 0.04 μg/mL by DCH powder; 0.36 ± 0.06 μg/mL by MCD powder), indicating poor permeation of the drug from nose the bloodstream. Indeed, a comparison of the AUC values obtained after intravenous administration (145.1 ± 3.6 μg/mL·min) and nasal administration (8.92 ± 1.11 μg/mL·min for DCH powder; 14.89 ± 2.05 μg/mL·min for MCD powder) indicated absolute bioavailability values of 6.15 % and 10.26% for the microparticulate powders based on chitosan and cyclodextrins, respectively.
Conversely, significant quantities of DFO were detected in CSF following the nasal administration of the microparticulate systems. In particular, the CSF peak concentrations of the drug were detected at 30 min, showing values of 3.83 ± 0.68 μg/mL for DCH powder and 14.37 ± 1.69 μg/mL for MCD powder. DFO concentrations slowly decreased within 60 min of administration (2.77 ± 0.50 μg/mL for DCH powder; 11.68 ± 11.43 μg/mL for MCD powder), then an abrupt decrease was registered within 90 min (Figure 10).
Figure 10.

DFO concentrations (μg/mL) detected in the CSF after nasal administration of DCH and MCD microparticles. Each dose contained 200 μg of the drug. Data are expressed as the mean ± SD of four independent experiments.
The AUC values obtained for DFO in CSF following nasal administration of the DCH and MCD powders were 198.2 ± 17.4 μg/mL min and 815.7 ± 47.0 μg/mL min, respectively. The ratio between MCD and DCH powders was 4.12, indicating that the nasal formulation containing cyclodextrins allowed approximately four times more DFO uptake into the CSF than the chitosan-based formulation.
4. Discussion
Freeze-drying remains the gold standard for the drying technology used in the pharmaceutical industry; spray drying represents the most mature alternative drying technology to lyophilization. The spray drying process provides an opportunity to control particle properties such as crystallinity, particle size, residual water content, bulk density, and morphology [43]. In this research work the properties of freeze-dried and spray-dried powders were compared in order to remark that spray drying is the most useful technique for preparing nasal formulations. In fact, freeze-drying is a technique not applicable for all drug–polymer combinations. DCHL form a sponge-like film with crumpled surfaces whereas MCDL production is characterized by low yield probably due to the aspiration of the smallest solid particles from the vacuum system of the freeze dryer. Moreover, by spray drying, particles with small diameter and narrow size distribution are obtained. Size together with density and morphology are the properties which can affect the aerodynamic features of microparticles and therefore the achievement of targeted deposition sites [44]. MCD and DCH show similar density and size and therefore they do not differ in aerodynamic features among themselves, even if they differ in morphology. Inthavong and co-workers (2009) demonstrated that near-spherical particles with a rough surface show lower deposition in comparison with spherical particles. As a consequence, particles can avoid impaction in the anterior part all the nasal cavity. On the basis of these considerations and of the low dae values, the particles produced have great possibility to reach the olfactory region in the roof of the nasal cavity. After inertial impaction, which is the dominant mechanism of deposition for micron ranged particles [44], because of their rapid water absorption, microspheres can adhere or dissolve at the deposition site. Obviously, in vivo deposition of particles will be influenced also by the dispenser used for the administration and the mucoadhesive properties of microparticles. Both drying techniques generate amorphous state of DFO as shown in XRD patterns; in spite of literature data [45], the higher molecular mobility of this form does not lead to enhanced permeation rate probably due to the high solubility of DFO. On the contrary, the in vitro and in vivo permeation behavior of DFO is affected by materials used as carriers for microparticulate drug delivery systems. In order to study the DFO pharmacokinetics, we have developed a liquid phase extraction method of this drug from plasma, suitable for LC-MS analysis. We have then performed an intravenous administration of the drug (200 μg) to rats and calculated its terminal half-life (15.4 ± 1.8 min) evidencing a value similar to that found in dogs [46] and confirming that after intravenous administration DFO is rapidly eliminated from the bloodstream [17,47]. Moreover, following the intravenous administration of the same dose, DFO was not detected in the CSF of rats at any considered time point. This result appears in agreement with the poor aptitude of the drug to reach the CNS from the bloodstream [17]. It has been indeed reported that the nasal administration of DFO solutions constitutes a viable noninvasive alternative to systemic injections for the treatment and prevention of stroke. In particular, intranasal administration of 6 mg DFO to rats resulted in significantly higher CNS concentrations in the brain (at least two orders of magnitude) and significantly reduced systemic exposure compared with intravenous administration of the same dose [17]. We have previously demonstrated that nasal microparticulate formulations based on chitosan salt microparticles salts (chloride or glutamate) can be very useful for brain targeting of neuroactive drugs [36,48,49]. We have then formulated the DCH formulation for nasal administration. Very recently, β-cyclodextrins were identified as absorption enhancers for transmucosal delivery of drugs [29,34]; the methylated form is more efficient cholesterol chelator than non-methylated β-cyclodextrin [50]. As a consequence, the MCD microparticulate system was prepared as solid nasal formulation for DFO. A dosage of 200 μg DFO was chosen for nasal formulations, in order to minimize the potential peripheral adverse effects of DFO and taking into account that similar nasal dosages allowed us to obtain the CSF uptake of significant amounts of neuroactive drugs, formulated as chitosan based microparticles [36,48,49]. The nasal administration of the aqueous solution of DFO (200 μg) did not allow the drug to reach neither the bloodstream or the CSF of rats, as previously found by us after the nasal administration similar doses of poorly permeable drugs formulated as water suspensions [48,49]. This can be explained considering that the liquid formulation could be rapidly removed from the nasal cavity by the mucociliary clearance, the main protection mechanism of the nose. The nasal administration of 200 μg DFO contained in the DCH and MCD formulations allowed us to detect significant amounts of the drug both in the bloodstream and the CSF of rats. In particular, the systemic absolute bioavailability values of DFO ranged around the 8%. These data indicate the ability of the solid formulations to induce the permeation of DFO across the respiratory mucosa, where systemic absorption occurs. The effect induced by DCH preparation can be attributed to its mucoadhesive properties and to the ability of chitosan to transiently open the tight junctions of the respiratory mucosa [48,49], whereas the results obtained by the MCD preparation seem to confirm the ability of β-cyclodextrins to act as absorption enhancers for transmucosal delivery of drugs [29,30,34,41]. In the case of water-soluble drugs, CDs enhance drug absorption and/or bioavailability because of their ability to form inclusion complex with specific membrane lipids, such as cholesterol, phosphatidylcholine and sphingomyelin, which cause perturbation of bilayer integrity and increase membrane fluidity [31]. The DFO concentrations detected in CSF of rats after nasal administration of the DCH and MCD preparations indicate their ability to induce also a direct nose to brain pathway for DFO. Indeed, its appearance in CSF after insufflations of the microparticulate powders can not to be imputable to a systemic absorption and a successive crossing of BBB, since this drug was undetectable in CSF after IV administration of the same dose (200 μg). DCH preparation confirms therefore the ability of chitosan salt microparticles to induce the CNS uptake from the nose of their encapsulated drug, as previously found by us with other neuroactive drugs [36,48,49]. This phenomenon has been attributed to the activation of a paracellular pathway across the olfactory epithelium after transient opening of mucosal tight junctions [51,52]. The hypothesis appears supported by the relatively fast appearance of DFO in CSF after nasal administration of DCH preparation. Indeed, 30 min after insufflations, about 3 μg/mL of DFO (about 5 μM) was detected in the CSF. As a consequence, intracellular axonal transport mechanisms through olfactory neuronal cells seem to be excluded, requiring a long time (up to 24 h) compared to transcellular or paracellular mechanisms that enable the transport of drugs to the CNS within minutes [53]. Interestingly, the MCD preparation appeared more efficient than the DCH formulation in inducing the DFO uptake into the CNS, producing a concentration of about 15 μg/mL (about 25 μM) within 30 min. Accordingly, the CSF bioavailability of DFO in MCD microparticles was about four times higher than the bioavailability obtained by the DCH formulation. It is important to underline that other authors performed a nasal administration to rats of a solution containing 6 mg of DFO; 30 min after the administration they found that the drug concentration in the brain of rats reached values up to 15 μM [17]. Taking into account that the nasal administration to rats of a MCD sample containing 200 μg of DFO allowed us to detected its concentration up to 25 μM in CSF, we can conclude that the β-cyclodextrin microparticles showed great efficacy in inducing the DFO uptake in the CNS. This phenomenon appears due to the ability of this type of microparticle to differently interact with the respiratory and olfactory epithelium, due to the different cell composition [54]. As evidenced by the our permeation studies across the monolayers obtained with PC-12 cells and confirmed by in vivo studies, methyl-β-cyclodextrin enhances DFO permeation across the neuronal component of the olfactory mucosa. The affinity of the MCD microspheres to a lipophilic substrate was firstly seen in our in vitro permeation studies where unlike the chitosan, cyclodextrin increases the flow of drug through the membranes saturated with octanol. Considering the relatively fast appearance of DFO in the CSF, the intracellular axonal transport mechanisms through olfactory neuronal cells seem to be excluded. For this type of behaviour an extracellular pathway along neurons to the CNS has been hypothesized [53]. Intranasal administration, thus, increases drug concentration in the brain and decreases drug systemic circulation avoiding secondary effects. Nose-to-brain delivery of DFO by microspheres is a promising approach also by considering the recent limitation to the IV administration [4]. Further investigations are required in order to detect the in vivo potential cellular toxicity or therapeutic effects obtained by the nasal administration of the microparticles.
5. Conclusions
Microparticles based on chitosan chloride or methyl-β-cyclodextrins can be obtained by spray drying as carriers of DFO, in order to promote its nose to brain permeation. In particular, the microparticles based on methyl-β-cyclodextrins appear of great efficacy in inducing the drug absorption at CSF level, probably across the neuronal component of the olfactory mucosa. Taking into account the poor systemic bioavailability obtained by the nasal administration of the microparticles, the MCD system appears promising for a noninvasive clinical application of DFO as a neuroactive drug in various brain diseases, while minimizing systemic drug exposure.
Supplementary Material
Acknowledgments
Authors thank Dott.ssa Claudia Juliano for helping in cell studies
Footnotes
Publisher's Disclaimer: This is a PDF file of an unedited manuscript that has been accepted for publication. As a service to our customers we are providing this early version of the manuscript. The manuscript will undergo copyediting, typesetting, and review of the resulting proof before it is published in its final citable form. Please note that during the production process errors may be discovered which could affect the content, and all legal disclaimers that apply to the journal pertain.
References
- 1.Cullen V, Lindfors M, Ng J, Paetau A, Swinton E, Kolodziej P, Boston H, Saftig P, Woulfe J, Feany MB, Myllykangas L, Schlossmacher MG, Tyynela J. Cathepsin D expression level affects alpha-synuclein processing, aggregation, and toxicity in vivo. Mol Brain. 2009;2 doi: 10.1186/1756-6606-2-5. [DOI] [PMC free article] [PubMed] [Google Scholar]
- 2.Poggiali E, Cassinerio E, Zanaboni L, Cappellini MD. An update on iron chelation therapy. Blood Transfus. 2012;10:411–422. doi: 10.2450/2012.0008-12. [DOI] [PMC free article] [PubMed] [Google Scholar]
- 3.Hua Y, Keep RF, Hoff JT, Xi G. Deferoxamine therapy for intracerebral haemorrhage. Acta Neurochir Suppl. 2008;105:3–6. doi: 10.1007/978-3-211-09469-3_1. [DOI] [PubMed] [Google Scholar]
- 4. [Accessed on 5 december 2014];High-Dose Deferoxamine in Intracerebral Hemorrhage (HI-DEF) Available at: https://clinicaltrials.gov/ct2/show/NCT01662895?term=deferoxamine&rank=2.
- 5.Rosas HD, Chen YI, Doros G, Salat DH, Chen NK, Kwong KK, Bush A, Fox J, Hersch SM. Alterations in brain transition metals in Huntington Disease: an evolving and intricate story. Arch Neurol. 2012;69:887–893. doi: 10.1001/archneurol.2011.2945. [DOI] [PMC free article] [PubMed] [Google Scholar]
- 6.Chen J, Marks E, Lai B, Zhang Z, Duce JA, Lam LQ, Volitakis I, Bush AI, Hersch S, Fox JH. Iron accumulates in Huntington’s disease neurons: protection by deferoxamine. PLoS One. 2013;8:e77023. doi: 10.1371/journal.pone.0077023. [DOI] [PMC free article] [PubMed] [Google Scholar]
- 7.Rival T, Page RM, Chandraratna DS, Sendall TJ, Ryder E, Liu B, Lewis H, Rosahl T, Hider R, Camargo LM, Shearman MS, Crowther DC, Lomas DA. Fenton chemistry and oxidative stress mediate the toxicity of the beta-amyloid peptide in a Drosophila model of Alzheimer’s disease. Eur J Neurosci. 2009;29:1335–1347. doi: 10.1111/j.1460-9568.2009.06701.x. [DOI] [PMC free article] [PubMed] [Google Scholar]
- 8.Guo C, Wang T, Zheng W, Shan ZY, Teng WP, Wang ZY. Intranasal deferoxamine reverses iron-induced memory deficits and inhibits amyloidogenic APP processing in a transgenic mouse model of Alzheimer’s disease. Neurobiol Aging. 2013;34:562–575. doi: 10.1016/j.neurobiolaging.2012.05.009. [DOI] [PubMed] [Google Scholar]
- 9.Fine JM, Forsberg AC, Renner DB, Faltesek KA, Mohan KG, Wong JC, Arneson LC, Crow JM, Frey WH, 2nd, Hanson LR. Intranasally-administered deferoxamine mitigates toxicity of 6-OHDA in a rat model of Parkinson’s disease. Brain Res. 2014;1574:96–104. doi: 10.1016/j.brainres.2014.05.048. [DOI] [PubMed] [Google Scholar]
- 10.Mastroberardino PG, Hoffman EK, Horowitz MP, Betarbet R, Taylor G, Cheng D, Na HM, Gutekunst CA, Gearing M, Trojanowski JQ, Anderson M, Chu CT, Peng J, Greenamyre JT. A novel transferrin/TfR2-mediated mitochondrial iron transport system is disrupted in Parkinson’s disease. Neurobiol Dis. 2009;34:417–431. doi: 10.1016/j.nbd.2009.02.009. [DOI] [PMC free article] [PubMed] [Google Scholar]
- 11.Febbraro F, Andersen KJ, Sanchez-Guajardo V, Tentillier N, Romero-Ramos M. Chronic intranasal deferoxamine ameliorates motor defects and pathology in the α-synuclein rAAV Parkinson’s model. Exp Neurol. 2013;247:45–58. doi: 10.1016/j.expneurol.2013.03.017. [DOI] [PubMed] [Google Scholar]
- 12.Jeong SY, Rathore KI, Schulz K, Ponka P, Arosio P, David S. Dysregulation of iron homeostasis in the CNS contributes to disease progression in a mouse model of amyotrophic lateral sclerosis. J Neurosci. 2009;29:610–619. doi: 10.1523/JNEUROSCI.5443-08.2009. [DOI] [PMC free article] [PubMed] [Google Scholar]
- 13.Singh A, Isaac AO, Luo X, Mohan ML, Cohen ML, Chen F, Kong Q, Bartz J, Singh N. Abnormal brain iron homeostasis in human and animal prion disorders. PLoS Pathog. 2009;5:e1000336. doi: 10.1371/journal.ppat.1000336. [DOI] [PMC free article] [PubMed] [Google Scholar]
- 14.Curtis AR, Fey C, Morris CM, Bindoff LA, Ince PG, Chinnery PF, Coulthard A, Jackson MJ, Jackson AP, McHale DP, Hay D, Barker WA, Markham AF, Bates D, Curtis A, Burn J. Mutation in the gene encoding ferritin light polypeptide causes dominant adult-onset basal ganglia disease. Nat Genet. 2001;28:350–354. doi: 10.1038/ng571. [DOI] [PubMed] [Google Scholar]
- 15.Selim M, Yeatts S, Goldstein JN, Gomes J, Greenberg S, Morgenstern LB, Schlaug G, Torbey M, Waldman B, Xi G, Palesch Y. Safety and tolerability of deferoxamine mesylate in patients with acute intracerebral hemorrhage. Stroke. 2011;42:3067–3074. doi: 10.1161/STROKEAHA.111.617589. [DOI] [PMC free article] [PubMed] [Google Scholar]
- 16.Selim MH, Ratan RR. The role of iron neurotoxicity in ischemic stroke. Ageing Res Rev. 2004;3:345–353. doi: 10.1016/j.arr.2004.04.001. [DOI] [PubMed] [Google Scholar]
- 17.Hanson LR, Roeytenberg A, Martinez PM, Coppes VG, Sweet DC, Rao RJ, Marti DL, Hoekman JD, Matthews RB, Frey WH, 2nd, Panter SS. Intranasal deferoxamine provides increased brain exposure and significant protection in rat ischemic stroke. J Pharmacol Exp Ther. 2009;330:679–686. doi: 10.1124/jpet.108.149807. [DOI] [PMC free article] [PubMed] [Google Scholar]
- 18.Weigel KJ, Lynch SG, LeVine SM. Iron chelation and multiple sclerosis. ASN Neuro. 2014;6:e00136. doi: 10.1042/AN20130037. [DOI] [PMC free article] [PubMed] [Google Scholar]
- 19.Dinc C, Iplikcioglu AC, Atabey C, Eroglu A, Topuz K, Ipcioglu O, Demirel D. Comparison of deferoxamine and methylprednisolone protective effect of pharmacological agents on lipid peroxidation in spinal cord injury in rats. Spine. 2013;38:E1649–E1655. doi: 10.1097/BRS.0000000000000055. [DOI] [PubMed] [Google Scholar]
- 20.Palmer C, Roberts RL, Bero C. DFX post treatment reduces ischemic brain injury in neonatal rats. Stroke. 1994;25:1039–1045. doi: 10.1161/01.str.25.5.1039. [DOI] [PubMed] [Google Scholar]
- 21.Zhang L, Hu R, Li M, Li F, Meng H, Zhu G, Lin J, Feng H. Deferoxamine attenuates iron-induced long-term neurotoxicity in rats with traumatic brain injury. Neurol Sci. 2013;34:639–645. doi: 10.1007/s10072-012-1090-1. [DOI] [PubMed] [Google Scholar]
- 22.Shachar DB, Kahana N, Kampel V, Warshawsky A, Youdim MBH. Neuroprotection by a novel brain permeable iron chelator, VK-28, against 6-hydroxydopamine lession in rats. Neuropharmacology. 2004;46:254–263. doi: 10.1016/j.neuropharm.2003.09.005. [DOI] [PubMed] [Google Scholar]
- 23.Fine JM, Baillargeon AM, Renner DB, Hoerster NS, Tokarev J, Colton S, Pelleg A, Andrews A, Sparley KA, Krogh KM, Frey WH, Hanson LR. Intranasal deferoxamine improves performance in radial arm water maze, stabilizes HIF-1α, and phosphorylates GSK3β in P301L tau transgenic mice. Exp Brain Res. 2012;219:381–390. doi: 10.1007/s00221-012-3101-0. [DOI] [PubMed] [Google Scholar]
- 24.Hanson LR, Fine JM, Hoekman JD, Nguyen TM, Burns RB, Martinez PM, Pohl J, Frey WH., 2nd Intranasal delivery of growth differentiation factor 5 to the central nervous system. Drug Deliv. 2012;19:149–154. doi: 10.3109/10717544.2012.657720. [DOI] [PubMed] [Google Scholar]
- 25.Reger MA, Watson GS, Green PS, Baker LD, Cholerton B, Fishel MA, Plymate SR, Cherrier MM, Schellenberg GD, Frey WH, 2nd, Craft S. Intranasal insulin administration dose-dependently modulates verbal memory and plasma amyloid-beta in memory-impaired older adults. J Alzheimers Dis. 2008;13:323–331. doi: 10.3233/jad-2008-13309. [DOI] [PMC free article] [PubMed] [Google Scholar]
- 26.Türker S, Onur E, Ozer Y. Nasal route and drug delivery systems. Pharm World Sci. 2004;26:137–142. doi: 10.1023/b:phar.0000026823.82950.ff. [DOI] [PubMed] [Google Scholar]
- 27.Illum L. Nasal drug delivery: new developments and strategies. Drug Discov Today. 2002;7:1184–1189. doi: 10.1016/s1359-6446(02)02529-1. [DOI] [PubMed] [Google Scholar]
- 28.Vidgren MT, Kublik H. Nasal delivery systems and their effect on deposition and absorption. Adv Drug Deliv Rev. 1998;29:157–177. doi: 10.1016/s0169-409x(97)00067-7. [DOI] [PubMed] [Google Scholar]
- 29.Bshara H, Osman R, Mansour S, El-Shamy Ael-H. Chitosan and cyclodextrin in intranasal microemulsion for improved brain buspirone hydrochloride pharmacokinetics in rats. Carbohydr Polym. 2014;99:297–305. doi: 10.1016/j.carbpol.2013.08.027. [DOI] [PubMed] [Google Scholar]
- 30.Merkus FW, Verhoef JC, Marttin E, Romeijn SG, van der Kuy PH, Hermens WA, Schipper NG. Cyclodextrins in nasal drug delivery. Adv Drug Deliv Rev. 1999;36:41–57. doi: 10.1016/s0169-409x(98)00054-4. [DOI] [PubMed] [Google Scholar]
- 31.Challa R, Ahuja A, Ali J, Khar RK. Cyclodextrins in drug delivery: an updated review. AAPS PharmSciTech. 2005;6:Article 43. doi: 10.1208/pt060243. [DOI] [PMC free article] [PubMed] [Google Scholar]
- 32.Dhuria SV, Hanson LR, Frey WH., 2nd Intranasal delivery to the central nervous system: mechanisms and experimental considerations. J Pharm Sci. 2010;99:1654–1673. doi: 10.1002/jps.21924. [DOI] [PubMed] [Google Scholar]
- 33.Sinha VR, Singla AK, Wadhawan S, Kaushik R, Kumria R, Bansal K, Dhawan S. Chitosan microspheres as a potential carrier for drugs. Int J Pharm. 2004;274:1–33. doi: 10.1016/j.ijpharm.2003.12.026. [DOI] [PubMed] [Google Scholar]
- 34.Gavini E, Spada G, Rassu G, Cerri G, Brundu A, Cossu M, Sorrenti M, Giunchedi P. Development of solid nanoparticles based on hydroxypropyl-β-cyclodextrin aimed for the colonic transmucosal delivery of diclofenac sodium. J Pharm Pharmacol. 2011;63:472–482. doi: 10.1111/j.2042-7158.2010.01220.x. [DOI] [PubMed] [Google Scholar]
- 35.Gavini E, Rassu G, Muzzarelli C, Cossu M, Giunchedi P. Spray-dried microspheres based on methylpyrrolidinone chitosan as new carrier for nasal administration of metoclopramide. Eur J Pharm Biopharm. 2008;68:245–252. doi: 10.1016/j.ejpb.2007.05.002. [DOI] [PubMed] [Google Scholar]
- 36.Gavini E, Rassu G, Ferraro L, Beggiato S, Alhalaweh A, Velaga S, Marchetti N, Bandiera P, Giunchedi P, Dalpiaz A. Influence of polymeric microcarriers on the in-vivo intranasal uptake of an anti-migraine drug for brain targeting. Eur J Pharm Biopharm. 2013;83:174–183. doi: 10.1016/j.ejpb.2012.10.010. [DOI] [PubMed] [Google Scholar]
- 37.Felgenhauer K. Protein size and CSF composition. Klin Wochenschr. 1974;52:1158–1164. doi: 10.1007/BF01466734. [DOI] [PubMed] [Google Scholar]
- 38.Madu A, Cioffe C, Mian U, Burroughs M, Tuomanen E, Mayers M, Schwartz E, Miller M. Pharmacokinetics of fluconazole in cerebrospinal fluid and serum of rabbits: validation of an animal model used to measure drug concentrations in cerebrospinal fluid. Antimicrob Agents Chemother. 1994;38:2111–2115. doi: 10.1128/aac.38.9.2111. [DOI] [PMC free article] [PubMed] [Google Scholar]
- 39.Dalpiaz A, Marchetti N, Cavazzini A, Pasti L, Velaga S, Gavini E, Beggiato S, Ferraro L. Quantitative determination of zolmitriptan in rat blood and cerebrospinal fluid by reversed phase HPLC-ESI-MS/MS analysis: application to in vivo preclinical pharmacokinetic study. J Chromatogr B Analyt Technol Biomed Life Sci. 2012;901:72–78. doi: 10.1016/j.jchromb.2012.06.001. [DOI] [PubMed] [Google Scholar]
- 40.Simionato AV, de Souza GD, Rodrigues-Filho E, Glick J, Vouros P, Carrilho E. Tandem mass spectrometry of coprogen and deferoxamine hydroxamic siderophores. Rapid Commun Mass Spectrom. 2006;20:193–199. doi: 10.1002/rcm.2295. [DOI] [PubMed] [Google Scholar]
- 41.Van den Berg MP, Romeijn SG, Verhoef JC, Merkus FW. Serial cerebrospinal fluid sampling in a rat model to study drug uptake from the nasal cavity. J Neurosci Methods. 2002;116:99–107. doi: 10.1016/s0165-0270(02)00033-x. [DOI] [PubMed] [Google Scholar]
- 42.Sacchetti C, Artusi M, Santi P, Colombo P. Caffeine microparticles for nasal administration obtained by spray drying. Int J Pharm. 2002;242:335–339. doi: 10.1016/s0378-5173(02)00177-1. [DOI] [PubMed] [Google Scholar]
- 43.Walters RH, Bhatnagar B, Tchessalov S, Izutsu KI, Tsumoto K, Ohtake S. Next generation drying technologies for pharmaceutical applications. J Pharm Sci. 2014;103:2673–2695. doi: 10.1002/jps.23998. [DOI] [PubMed] [Google Scholar]
- 44.Inthavong K, Jiyuan T, Goodarz A. Computational modelling of gas-particle flows with different particle morphology in the human nasal cavity. J Comput Multiphase Flows. 2009;1:57–82. [Google Scholar]
- 45.Craig DQ, Royall PG, Kett VL, Hopton ML. The relevance of the amorphous state to pharmaceutical dosage forms: glassy drugs and freeze dried systems. Int J Pharm. 1999;179:179–207. doi: 10.1016/s0378-5173(98)00338-x. [DOI] [PubMed] [Google Scholar]
- 46.Tesoro A, Leeder JS, Bentur Y, Klein J, Freedman M, Koren G. A high-performance liquid chromatographic method for the measurement of deferoxamine in body fluids. Ther Drug Monit. 1989;11:463–470. [PubMed] [Google Scholar]
- 47.Dragsten PR, Hallaway PE, Hanson GJ, Berger AE, Bernard B, Hedlund BE. First human studies with a high-molecular-weight iron chelator. J Lab Clin Med. 2000;135:57–65. doi: 10.1016/s0022-2143(00)70021-7. [DOI] [PubMed] [Google Scholar]
- 48.Dalpiaz A, Gavini E, Colombo G, Russo P, Bortolotti F, Ferraro L, Tanganelli S, Scatturin A, Menegatti E, Giunchedi P. brain uptake of an antiischemic agent by nasal administration of microparticles. J Pharm Sci. 2008;97:4889–4903. doi: 10.1002/jps.21335. [DOI] [PubMed] [Google Scholar]
- 49.Gavini E, Rassu G, Ferraro L, Generosi A, Rau JV, Brunetti A, Giunchedi P, Dalpiaz A. Influence of chitosan glutamate on the in vivo intranasal absorption of rokitamycin from microspheres. J Pharm Sci. 2011;100:1488–1502. doi: 10.1002/jps.22382. [DOI] [PubMed] [Google Scholar]
- 50.Ziolkowski W, Szkatula M, Nurczyk A, Wakabayashi T, Kaczor JJ, Olek RA, Knap N, Antosiewicz J, Wieckowski MR, Wozniak M. Methyl-beta-cyclodextrin induces mitochondrial cholesterol depletion and alters the mitochondrial structure and bioenergetics. FEBS Lett. 2010;584:4606–4610. doi: 10.1016/j.febslet.2010.10.023. [DOI] [PubMed] [Google Scholar]
- 51.Lim ST, Forbes B, Berry DJ, Martin GP, Brown MB. In vivo evaluation of novel hyaluronan/chitosan microparticulate delivery systems for the nasal delivery of gentamicin in rabbits. Int J Pharm. 2002;231:73–82. doi: 10.1016/s0378-5173(01)00873-0. [DOI] [PubMed] [Google Scholar]
- 52.Illum L. Nasal drug delivery-Possibilities, problems and solutions. J Control Release. 2003;87:187–198. doi: 10.1016/s0168-3659(02)00363-2. [DOI] [PubMed] [Google Scholar]
- 53.Illum L. Is nose-to-brain transport of drugs in man a reality? J Pharm Pharmacol. 2004;56:3–17. doi: 10.1211/0022357022539. [DOI] [PubMed] [Google Scholar]
- 54.Mistry A, Stolnik S, Illum L. Nanoparticles for direct nose-to-brain delivery of drugs. Int J Pharm. 2009;379:146–157. doi: 10.1016/j.ijpharm.2009.06.019. [DOI] [PubMed] [Google Scholar]
Associated Data
This section collects any data citations, data availability statements, or supplementary materials included in this article.