Abstract
Recent technical advances, such as chromatin immunoprecipitation combined with DNA microarrays (ChIp-chip) and chromatin immunoprecipitation-sequencing (ChIP-seq), have generated large quantities of high-throughput data. Considering that epigenomic datasets are arranged over chromosomes, their analysis must account for spatial or temporal characteristics. In that sense, simple clustering or classification methodologies are inadequate for the analysis of multi-track ChIP-chip or ChIP-seq data. Approaches that are based on hidden Markov models (HMMs) can integrate dependencies between directly adjacent measurements in the genome. Here, we review three HMM-based studies that have contributed to epigenetic research, from a computational perspective. We also give a brief tutorial on HMM modelling-targeted at bioinformaticians who are new to the field.
Keywords: chromatin states, epigenomics, hidden Markov models, noncoding DNA
Introduction
Many researchers have shown that formal language theory is an appropriate tool in analyzing various biological sequences [1, 2]. The hidden Markov model (HMM) is most closely related to regular grammars, because an n-gram is a subsequence of n items from a given sequence, and language models that are built from n-grams are actually (n-1)-order Markov models. However, the research of modeling biological sequences has usually focused on nucleotide or amino acid sequences that encode RNA or interact with proteins [3, 4, 5, 6, 7, 8, 9, 10, 11, 12]. On the other hand, noncoding DNA regions, which occupy approximately 98% of human DNA, have not been considered for HMM-based analysis. The reason is partially due to the fact that a large proportion of noncoding DNA has been believed to have no known biological functions.
However, recent technical advances, such as chromatin immunoprecipitation sequencing (ChIP-seq), DNase I hypersensitive sites sequencing (DNase-seq), formaldehyde-assisted isolation of regulatory elements (FAIRE) [13, 14], and computational epigenetics, have started to convert unannotated noncoding DNA into highly annotated functional areas [15, 16]. The work is analogous to dissecting the region that constitutes the noncoding DNA and understanding the type of meaning each element contains. For this reason, the field of epigenetics has received a boost of attention and is currently among the fastest moving areas in molecular biology. However, epigenetic mechanisms are highly interwoven in a complex network of interactions. Disentangling this network is an important goal of epigenetic research. Thus, various bioinformatic challenges arise from the analysis of epigenetic data, and HMMs have played a significant role in solving important epigenetic problems, as HMMs are well suited to the task of discovering unobserved 'hidden' states from 'observed' sequences in their spatial genomic context.
In this paper, we give a tutorial review of the design of HMMs and their applications to solve various computational epigenetic problems. We selected three representative works to compare different designs of HMMs for various computational epigenetic problems: the Li et al. [17] two-hidden-state HMM to determine transcription factor binding sites, the Xu et al. [18] three-hidden-state HMM to compare histone modification sites, and the Ernst and Kellis [19] multi-state multivariate HMM to analyze systematic state dynamics of human cells. We want to clarify the fact that this review is by no means exhaustive and that there exist many other types of HMMs for computational epigenetic problems.
HMMs and Their Design Issues
An HMM is a statistical model that can be used to describe observable events that depend on hidden factors. An HMM consists of two stochastic processes: an invisible process of hidden states based on a Markov chain and a visible process of observable symbols. A first-order HMM can be defined formally as a quintuple (S, π, ∑, a, e), where S = {1, 2, . . . , n} is a finite set of hidden states; π is vector of size n defining the starting probability distribution; ∑ = 1, 2, . . . , m is a finite set of output symbols; aij is a two-dimensional matrix of transition probabilities of moving from state i to state j; and ei(x) is an n × m matrix of emission probabilities of generating symbol x in state i. The key property of a Markov chain is that the probability of each symbol xi depends only on the value of the preceding symbol xi-1 [i.e., P(xi ∣xi-1)], not on the entire previous sequence [i.e., P(xi ∣xi -1, . . . , x1)].
In the bioinformatics context, a nucleic one for genes, genomes, amino acids, or RNA is a sequence. And sequences can represent functional regions in the genome. Whereas previous studies of coding DNAs and promoters usually modeled their HMMs using nucleotide or amino acid sequences as their output symbols, recent HMM studies that are related to epigenomics tend to model their HMMs using chromatin marks in bins of equal length as output symbols, replacing the traditional nucleotide or amino acid sequences.
To explain the difference, let us consider a simple example. Suppose that adjacent regions of genomic sequences are divided into multiple 10-bp bins (though unrealistic), as in Fig. 1, in which some kinds of chromatin marks or methylation profiles are annotated. Suppose also that we define two imaginary methylated states, 'M' (in green color) and 'U' (in orange color), based on some kinds of epigenetic profiles.
Fig. 1.
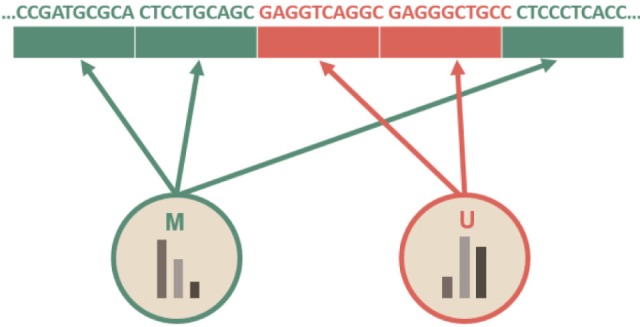
A sample sequence, divided in 10-bp bins, annotated with two hidden states: M and U.
Let us consider a toy HMM for Fig. 1. Given random training data, we try to determine five parameters of the HMM. An HMM is usually visualized as a directed graph with vertices corresponding to the states and the edges representing pairs of states with transition probability aij and emission probability ei(j), as in Fig. 2. The graph defines the topology of the model, while the emission and the transition probabilities define the parameters of the model. The given HMM tries to capture the statistical differences in the two hidden states of 'M' and 'U.' The transition probability represents the change of the methylation state in the underlying Markov chain. According to Fig. 2A, there is a 20% chance of moving from state 'M' to state 'U' (aMU), an 80% chance of staying in state 'M' (aMM), a 10% chance of moving from state 'U' to state 'M' (aUM), and a 90% chance of staying in 'U' (aUU). The probability of starting from M and U is 60% and 40%, respectively. M and U use different sets of emission probabilities to reflect the symbol statistics. In epigenetic studies, emission symbols are not nucleotide or amino acid sequences. Rather, emission symbols are usually defined as a value or even a vector of chromatin marks.
Fig. 2.

A Toy hidden Markov model (HMM) and its 5 parameters. (A) An ergodic model of a toy HMM. (B) An equivalent left-to-right version of the HMM in Fig. 2A (picture adapted from the cs262 class slides by S. Batzoglou with permission).
Fig. 2A is an ergodic HMM. An ergodic HMM is one for which the underlying Markov chain is irreducible and admits a unique stationary distribution. In contrast, a left-to-right version of an instantiated HMM in Fig. 2B is an HMM with a Markov chain that starts in a particular initial state, traverses intermediate states, and terminates in a final state. Each circle shape represents a hidden state. The random variable xt is the hidden state at time t. The variables 'M' and 'U' are the observations at time t (with St ∈ {M, U}). The arrows in the diagram denote conditional dependencies. Unlike an ergodic HMM, the chain may not go backwards while traversing the trellis.
Different HMM Designs for Identifying DNA Methylation Patterns
Genome-wide mapping of epigenetic information follows a basic three-stage design process [13]: conversion of the epigenetic information into genetic information, application of standard DNA techniques, and computational analysis to infer the epigenetic information. All experimental methods for epigenomic annotation generate large amounts of data and require efficient ways of processing the data. In the remainder of this review, we show how HMMs have contributed to answering important epigenetic questions by summarizing HMM-based bioinformatic works, from a computational perspective. Table 1 summarizes the HMM parameters of the three studies that will be reviewed in this paper, in the order of the hidden state complexity.
Table 1.
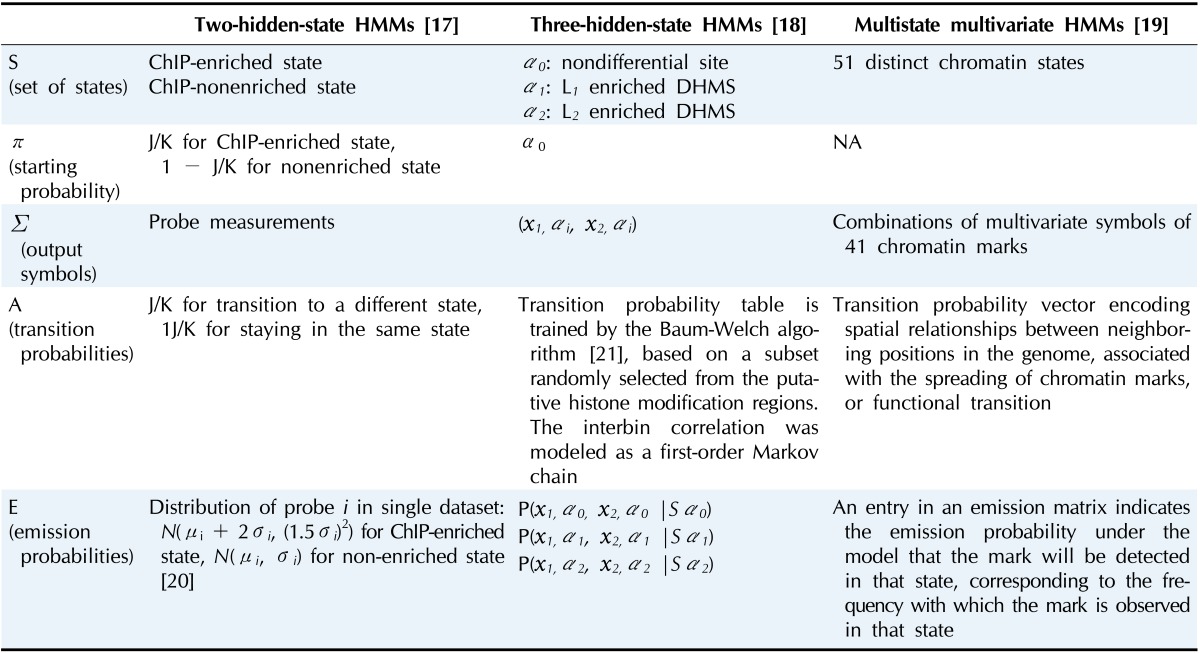
ChIP, chromatin immunoprecipitation; DHMS, differential histone modification site; NA, not acquired.
Two-State HMMs to Differentiate Non-Enriched Genomic Regions from Enriched Ones
Li et al. [17] developed a method to determine transcription factor binding sites from chromatin immunoprecipitation combined with DNA microarrays (ChIP-chip) experiments on an Affymetrix tiling array of chromosomes 21 and 22. Owing to the Affymetrix array characteristics and genome sequence similarity, probes with the same 25-mer sequence tend to be spotted at different locations on the chips. Two-stage procedures were employed to filter out short-range repetitive probe measurements prior to downstream analysis. Then, tiling array data from various experiments were gathered to normalize and model the behavior of each individual probe, where the behavior of each probe was modeled as a normal distribution. Finally, a two-hidden-state (ChIP-enriched state and nonenriched state) HMM was built to estimate the probability of enrichment at each probe location.
Given J potential binding sites along chromosomes covered by K total probes, the initial probabilities and transition probabilities of HMM were characterized, as in Fig. 3. Initial probabilities were set to J/K for the ChIP-enriched state and to 1 - J/K for the nonenriched state. Transition probabilities were set to J/K for transition to a different state and 1 - J/K for staying in the same state. The emission probability distribution of probe in a single dataset was set to N(µi + 2σi, (1.5σi)2) for the ChIP-enriched state and N(µi, σi2) for the nonenriched state (where µi and σi are the mean and standard deviation, respectively, of probe i). The parameters were based on previous results with the Affymetrix SNP arrays [20].
Fig. 3.
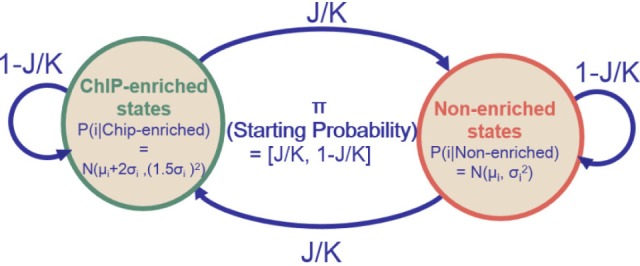
A Two-state hidden Markov model (HMM) [17].
Other methods that are based on two-state HMMs for the identification of methylated regions were proposed [22, 23, 24, 25]. A common characteristic of these studies is the modeling of two different populations of measurements to differentiate nonenriched regions from enriched ones. Ji and Wong [22] suggested TileMap, which is an effective statistical tool to identify genomic loci that show transcriptional or protein binding patterns of interest. Martin-Magniette et al. [23] proposed ChIP-mix, which is a statistical method based on the mixture of regression to classify probes in ChIP-chip experiments. Johannes et al. [24] presented a parametric classification method for genomewide comparisons of chromatin profiles between multiple ChIP samples. In Moghaddam et al. [25], they showed that H3K4me2 and H3K27me3 distribution patterns were similar overall in various Arabidopsis thaliana accessions and remained largely unchanged in their F1 progeny [25].
Three-State HMMs for ChIP Analysis
One general limitation of the methods in the previous section is that they only enable binary classification. For this reason, a three-state HMM has been proposed for the analysis of so-called differential histone modification sites (DHMSs) of H3K27me3 by Xu et al. [18]. To capture the histone modifications on the whole-genome scale, Xu et al. [18] proposed a qualitative analysis for the genome-wide comparison of histone modification sites by computationally comparing two ChIP-seq libraries generated from different cell types or experimental conditions. To do that, the whole genome was partitioned into 1-kb bins, and the number of centers of ChIP fragments was counted and normalized in each bin, generating a profile of ChIP fragment counts.
Based on the observations of ChIP fragment counts, Fig. 4 shows an HMM to infer the states of histone modification changes at each genomic location. The HMM is characterized by three features: the prior probability of the start state, the emission probability, and the transmission probability. A DHMS was defined as a bin in which the ratio of intensities between two profiles (L1 and L2) is larger than τ (L1-enriched DHMSs) or smaller than 1/τ (L2-enriched DHMSs), where τ is a predetermined threshold [19]. Based on the definition of a DHMS, the state Si takes one of the following three values: α0 if 1/τ ≤ p(1,i)/p(2,i) ≤ τ; α1 if p(1,i)/p(2,i) > τ; and α2 if p(1,i)/p(2,i) < 1/τ. (For a region of k bins, the notation x1,i, x2,i was used for the ChIP fragment counts in L1 and L2, and the notation p1,i, p2,i was used for the intensity in L1 and L2, respectively, at the ith bin in that region.) The initial state is fixed to take the value of α0, since the region is assumed to start from the genomic locations where the histone modification is depleted in both libraries. The emission probability P(x1,i, x2,i ∣si) was calculated as in Fig. 4 by integrating p1,i and p2,i over all possible values constrained by si. The transmission probability table was trained using the Baum-Welch algorithm [21].
Fig. 4.
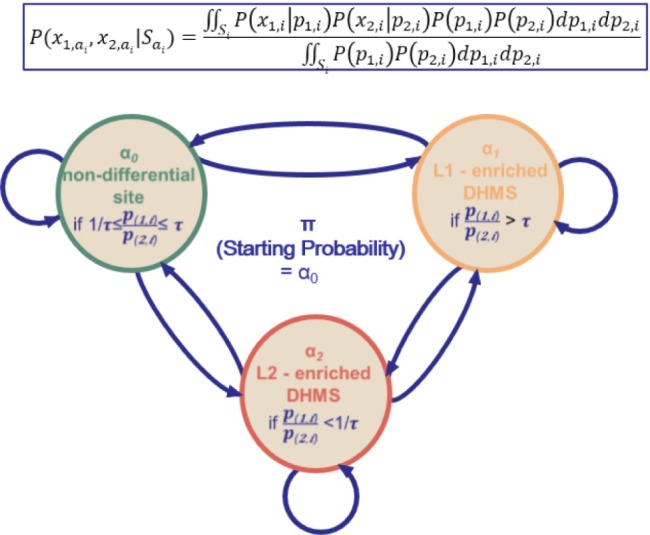
A three-state hidden Markov model (HMM) [18].
Other methods of three-state HMMs for the identification of methylated regions have been proposed. Seifert et al. [26] also proposed a three-state HMM specifically designed for the analysis of Arabidopsis MeDIP-chip data to differentiate between unmethylated ('U'), methylated ('M'), and highly methylated regions ('I'). They utilized a three-state HMM with state-specific multivariate Gaussian emission densities to analyze methylation levels of chromosomal regions in methylation profiles. Arand et al. [27] suggested a four-state HMM (fully methylated, not methylated on both sides, methylated only on the lower strand, and methylated only on the upper strand) to determine the methylation status of both DNA strands.
Multiple-State and Multivariate HMMs for Analyzing Systematic State Dynamics of Human Cells
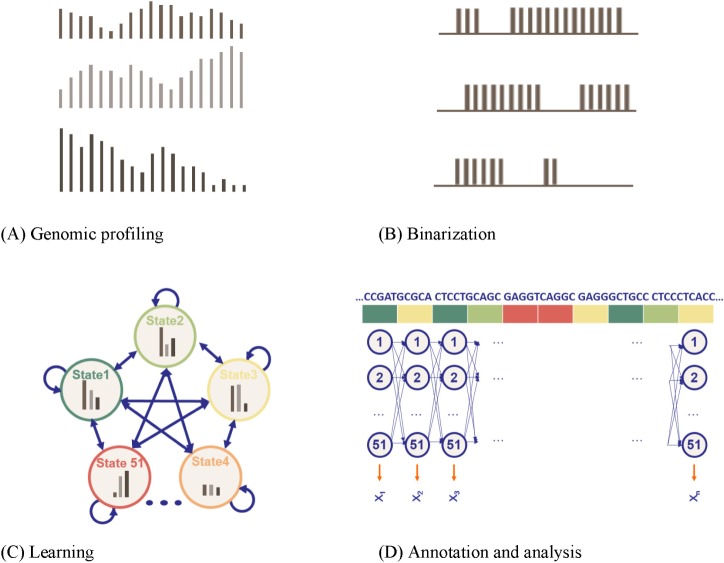
High-dimensional multivariate datasets occur in a large number of problem domains. In many cases, these datasets have either a sequential or temporal structure. To uncover which combinations of histone modifications are biologically meaningful, Ernst and Kellis [19] took a drastically different approach from others, particularly in two aspects: automatic determination of hidden states and usage of a massive amount of multivariate data as observed sequences. They applied unsupervised learning methodologies, converting the ChIP-seq dataset from the Broad Histone track into discrete annotation maps of 51 chromatin elements across the human genome. Fig. 5 summarizes their approach: genomic profiling, binarization, model learning, and annotation.
Fig. 5.
A multivariate, multi-state hidden Markov model (HMM) [19]. (A) Genomic profiling. To apply the model, the genome was divided into 200-base-pair nonoverlapping intervals, within which each of the count of 41 marks that mapped to the interval was annotated. (B) Binarization. For each 200-bp interval, the input ChIP-Seq sequence tag count is processed into a binary presence/absence call. (C) Learning. Each model was scored based on the log-likelihood of the model minus a penalization on the model complexity, determined by the Bayesian Information Criterion (BIC). (D) Annotation and analysis. The vector of 41 numerical values was assigned, each representing the result of a different biochemical assay, and each of the 200-base-pair intervals was assigned to its most likely state under the model (picture adapted from the cs262 class slides by S. Batzoglou with permission).
Fig. 5A shows that the profiles are represented as X1 ={x1,1, x1,2, ..., x1,m}, where xi,j is the fragment count at the jth bin in Li and m is the number of bins. As input, it receives a list of aligned reads for each chromatin mark, which are automatically converted into presence or absence calls for each mark across the genome. Fig. 5B shows that the profile data were binarized separately at 200-base-pair resolution, based on a Poisson background model. The chromatin states were learned from the binarized data using a multivariate HMM. Fig. 5C shows a two-stage nested initialization procedure of hidden states. Ernst and Kellis [19] used an iterative learning expectation-maximization approach to infer state emission and transition parameters, with the best Bayesian Information Criterion (BIC). Fig. 5D shows that each 200-base-pair interval was then assigned to its most likely state under the model. The model assumes a fixed number of 51 distinct hidden states, including promoter-associated, transcription-associated, active intergenic, large-scale repressed, and repeat-associated states.
Originally, Jaschek and Tanay [28] discussed the necessity of automatic determination of hidden states in designing HMMs. Ernst et al. [29] later proposed a more stable 15-state model that showed distinct biological enrichments [19].
Conclusion
In this paper, we reviewed three different types of HMMs and their applications in order of the complexity of the hidden states, from a purely computational perspective. HMMs provide a sound mathematical framework for modeling and analyzing epigenetic data. The appropriate method for the analysis of DNA methylation depends upon the goals of the study. Researchers can design the most appropriate HMMs for their specific research needs and continued improvements in analysis methods make the study of DNA methylation more accessible.
Acknowledgments
This work was partially supported by the Ewha Information and Telecommunication Institute & Center for Convergence Research of Advanced Technologies.
References
- 1.Park HS, Galbadrakh B, Kim YM. Recent progresses in the linguistic modeling of biological sequences based on formal language theory. Genomics Inform. 2011;9:5–11. [Google Scholar]
- 2.Searls DB. The language of genes. Nature. 2002;420:211–217. doi: 10.1038/nature01255. [DOI] [PubMed] [Google Scholar]
- 3.Munch K, Krogh A. Automatic generation of gene finders for eukaryotic species. BMC Bioinformatics. 2006;7:263. doi: 10.1186/1471-2105-7-263. [DOI] [PMC free article] [PubMed] [Google Scholar]
- 4.Durbin R, Eddy SR, Krogh A, Mitchison G. Biological Sequence Analysis: Probabilistic Models of Proteins and Nucleic Acids. Cambridge: Cambridge University Press; 1998. [Google Scholar]
- 5.Pachter L, Alexandersson M, Cawley S. Applications of generalized pair hidden Markov models to alignment and gene finding problems. J Comput Biol. 2002;9:389–399. doi: 10.1089/10665270252935520. [DOI] [PubMed] [Google Scholar]
- 6.Liang KC, Wang X, Anastassiou D. Bayesian basecalling for DNA sequence analysis using hidden Markov models. IEEE/ACM Trans Comput Biol Bioinform. 2007;4:430–440. doi: 10.1109/tcbb.2007.1027. [DOI] [PubMed] [Google Scholar]
- 7.Lottaz C, Iseli C, Jongeneel CV, Bucher P. Modeling sequencing errors by combining Hidden Markov models. Bioinformatics. 2003;19(Suppl 2):ii103–ii112. doi: 10.1093/bioinformatics/btg1067. [DOI] [PubMed] [Google Scholar]
- 8.Won KJ, Hamelryck T, Prugel-Bennett A, Krogh A. An evolutionary method for learning HMM structure: prediction of protein secondary structure. BMC Bioinformatics. 2007;8:357. doi: 10.1186/1471-2105-8-357. [DOI] [PMC free article] [PubMed] [Google Scholar]
- 9.Zhang S, Borovok I, Aharonowitz Y, Sharan R, Bafna V. A sequence-based filtering method for ncRNA identification and its application to searching for riboswitch elements. Bioinformatics. 2006;22:e557–e565. doi: 10.1093/bioinformatics/btl232. [DOI] [PubMed] [Google Scholar]
- 10.Yoon BJ, Vaidyanathan PP. Structural alignment of RNAs using profile-csHMMs and its application to RNA homology search: overview and new results. IEEE Trans Automat Contr. 2008;53:10–25. [Google Scholar]
- 11.Harmanci AO, Sharma G, Mathews DH. Efficient pairwise RNA structure prediction using probabilistic alignment constraints in Dynalign. BMC Bioinformatics. 2007;8:130. doi: 10.1186/1471-2105-8-130. [DOI] [PMC free article] [PubMed] [Google Scholar]
- 12.Weinberg Z, Ruzzo WL. Sequence-based heuristics for faster annotation of non-coding RNA families. Bioinformatics. 2006;22:35–39. doi: 10.1093/bioinformatics/bti743. [DOI] [PubMed] [Google Scholar]
- 13.Shen L, Waterland RA. Methods of DNA methylation analysis. Curr Opin Clin Nutr Metab Care. 2007;10:576–581. doi: 10.1097/MCO.0b013e3282bf6f43. [DOI] [PubMed] [Google Scholar]
- 14.Bailey T, Krajewski P, Ladunga I, Lefebvre C, Li Q, Liu T, et al. Practical guidelines for the comprehensive analysis of ChIP-seq data. PLoS Comput Biol. 2013;9:e1003326. doi: 10.1371/journal.pcbi.1003326. [DOI] [PMC free article] [PubMed] [Google Scholar]
- 15.ENCODE Project Consortium. The ENCODE (ENCyclopedia Of DNA Elements) Project. Science. 2004;306:636–640. doi: 10.1126/science.1105136. [DOI] [PubMed] [Google Scholar]
- 16.ENCODE Project Consortium. An integrated encyclopedia of DNA elements in the human genome. Nature. 2012;489:57–74. doi: 10.1038/nature11247. [DOI] [PMC free article] [PubMed] [Google Scholar]
- 17.Li W, Meyer CA, Liu XS. A hidden Markov model for analyzing ChIP-chip experiments on genome tiling arrays and its application to p53 binding sequences. Bioinformatics. 2005;21(Suppl 1):i274–i282. doi: 10.1093/bioinformatics/bti1046. [DOI] [PubMed] [Google Scholar]
- 18.Xu H, Wei CL, Lin F, Sung WK. An HMM approach to genome-wide identification of differential histone modification sites from ChIP-seq data. Bioinformatics. 2008;24:2344–2349. doi: 10.1093/bioinformatics/btn402. [DOI] [PubMed] [Google Scholar]
- 19.Ernst J, Kellis M. Discovery and characterization of chromatin states for systematic annotation of the human genome. Nat Biotechnol. 2010;28:817–825. doi: 10.1038/nbt.1662. [DOI] [PMC free article] [PubMed] [Google Scholar]
- 20.Lieberfarb ME, Lin M, Lechpammer M, Li C, Tanenbaum DM, Febbo PG, et al. Genome-wide loss of heterozygosity analysis from laser capture microdissected prostate cancer using single nucleotide polymorphic allele (SNP) arrays and a novel bioinformatics platform dChipSNP. Cancer Res. 2003;63:4781–4785. [PubMed] [Google Scholar]
- 21.Baum LE, Petrie T, Soules G, Weiss N. A maximization technique occurring in the statistical analysis of probabilistic functions of Markov chains. Ann Math Stat. 1970;41:164–171. [Google Scholar]
- 22.Ji H, Wong WH. TileMap: create chromosomal map of tiling array hybridizations. Bioinformatics. 2005;21:3629–3636. doi: 10.1093/bioinformatics/bti593. [DOI] [PubMed] [Google Scholar]
- 23.Martin-Magniette ML, Mary-Huard T, Bérard C, Robin S. ChIPmix: mixture model of regressions for two-color ChIP-chip analysis. Bioinformatics. 2008;24:i181–i186. doi: 10.1093/bioinformatics/btn280. [DOI] [PubMed] [Google Scholar]
- 24.Johannes F, Wardenaar R, Colomé-Tatché M, Mousson F, de Graaf P, Mokry M, et al. Comparing genome-wide chromatin profiles using ChIP-chip or ChIP-seq. Bioinformatics. 2010;26:1000–1006. doi: 10.1093/bioinformatics/btq087. [DOI] [PubMed] [Google Scholar]
- 25.Moghaddam AM, Roudier F, Seifert M, Bérard C, Magniette ML, Ashtiyani RK, et al. Additive inheritance of histone modifications in Arabidopsis thaliana intra-specific hybrids. Plant J. 2011;67:691–700. doi: 10.1111/j.1365-313X.2011.04628.x. [DOI] [PubMed] [Google Scholar]
- 26.Seifert M, Cortijo S, Colomé-Tatché M, Johannes F, Roudier F, Colot V. MeDIP-HMM: genome-wide identification of distinct DNA methylation states from high-density tiling arrays. Bioinformatics. 2012;28:2930–2939. doi: 10.1093/bioinformatics/bts562. [DOI] [PubMed] [Google Scholar]
- 27.Arand J, Spieler D, Karius T, Branco MR, Meilinger D, Meissner A, et al. In vivo control of CpG and non-CpG DNA methylation by DNA methyltransferases. PLoS Genet. 2012;8:e1002750. doi: 10.1371/journal.pgen.1002750. [DOI] [PMC free article] [PubMed] [Google Scholar]
- 28.Jaschek R, Tanay A. Spatial clustering of multivariate genomic and epigenomic information. Res Comput Mol Biol. 2009;5541:170–183. [Google Scholar]
- 29.Ernst J, Kheradpour P, Mikkelsen TS, Shoresh N, Ward LD, Epstein CB, et al. Mapping and analysis of chromatin state dynamics in nine human cell types. Nature. 2011;473:43–49. doi: 10.1038/nature09906. [DOI] [PMC free article] [PubMed] [Google Scholar]


