

Abstract
Premature infants develop hyperglycemia shortly after birth, increasing their morbidity and death. Surviving infants have increased incidence of diabetes as young adults. Our understanding of the biological basis for the insulin resistance of prematurity and developmental regulation of glucose production remains fragmentary. The objective of this study was to examine maturational differences in insulin sensitivity and the insulin-signaling pathway in skeletal muscle and adipose tissue of 30 neonatal baboons using the euglycemic hyperinsulinemic clamp. Preterm baboons (67% gestation) had reduced peripheral insulin sensitivity shortly after birth (M value 12.5 ± 1.5 vs 21.8 ± 4.4 mg/kg · min in term baboons) and at 2 weeks of age (M value 12.8 ± 2.6 vs 16.3 ± 4.2, respectively). Insulin increased Akt phosphorylation, but these responses were significantly lower in preterm baboons during the first week of life (3.2-fold vs 9.8-fold). Preterm baboons had lower glucose transporter-1 protein content throughout the first 2 weeks of life (8%-12% of term). In preterm baboons, serum free fatty acids (FFAs) did not decrease in response to insulin, whereas FFAs decreased by greater than 80% in term baboons; the impaired suppression of FFAs in the preterm animals was paired with a decreased glucose transporter-4 protein content in adipose tissue. In conclusion, peripheral insulin resistance and impaired non-insulin-dependent glucose uptake play an important role in hyperglycemia of prematurity. Impaired insulin signaling (reduced Akt) contributes to the defect in insulin-stimulated glucose disposal. Counterregulatory hormones are not major contributors.
Prematurity is one of the two leading causes of perinatal morbidity and mortality. In 2011, premature infants with low-birth-weight infants (<2500 g) accounted for 8.1% of all births in the United States, and they have been found to have increasing incidences of type 2 diabetes mellitus, essential hypertension, and coronary artery disease (1–7). A large proportion of premature infants have impaired glucose control with hyperglycemia during the first few weeks of life. This condition has been associated with hyperosmolar dehydration, intraventricular hemorrhage, retinopathy of prematurity, brain damage, and death (8–12). Hyperglycemic premature infants are commonly treated with glucose restriction until their glucose tolerance improves, adversely affecting their nutritional status and growth (13). Recently neonatologists have allowed permissive hyperglycemia in the neonatal period, tolerating serum glucose levels of 120–150 mg/dL and classifying hyperglycemia only if the glucose is greater than 150 mg/dL with the ultimate goal of promoting growth with higher glucose infusions. Often serum glucose is tolerated at levels greater than 150 mg/dL and if glucose is greater than 200 mg/dL, insulin therapy is typically used. Once hyperglycemia persists, neonates require significantly higher and variable insulin infusion rates than older children and adults to achieve euglycemia (14, 15). In many cases, insulin therapy remains ineffective or causes hypoglycemia, which can result in impaired neurological function (16).
Very low-birth-weight premature infants (<1500 g) have elevated plasma insulin levels, suggesting peripheral insulin resistance (15, 17). Furthermore, humans and animals born with intrauterine growth restriction demonstrate peripheral insulin resistance (18, 19). In adults, peripheral insulin resistance primarily reflects impaired glucose uptake by skeletal muscle, which is the main site for insulin-stimulated glucose disposal (20). Resistance to the action of insulin in muscle has predictive value for the development of type 2 diabetes (21–23). Several abnormalities distinguish insulin-resistant muscle from normal muscle, including the following: decreased insulin-stimulated glucose transporter (GLUT)-4 translocation, impaired insulin receptor (IR) and IR substrate-1 (IRS-1) tyrosine phosphorylation, decreased insulin-stimulated Akt (protein kinase B) phosphorylation, and phosphatidylinositol 3-kinase (PI3-kinase) activity (20).
GLUT1 is the predominant fetal glucose transporter isoform that facilitates basal glucose transport into fetal cells that are proliferating and is found in abundance in most fetal rat and sheep tissues. GLUT4 transporters are found in insulin-responsive tissues and are expressed in low amounts compared with GLUT1 in fetal rats (24). Studies in fetal sheep at term gestation have shown an up-regulation of insulin-signaling molecules in response to insulin, although it remains unclear how this effect compares with similar pathways in children and adults (24). Insulin stimulation causes translocation of GLUT4 from the intracellular compartment to the sarcolema and the transverse tubules mediating insulin-induced glucose transport; some studies have reported reduced GLUT4 translocation in the neonatal rat muscle compared with adult animals (25). Recently our group demonstrated reduced muscle content of key glucose transport-regulating proteins (GLUT1/GLUT4) in the basal state and the up-regulation of upstream insulin-signaling molecules in preterm baboons when compared with mature counterparts (26). It remains to be determined whether these alterations in key insulin-signaling molecules play a role in the pathogenesis of neonatal hyperglycemia and reduced insulin-stimulated glucose disposal.
Baboons are an appropriate animal model to study insulin signaling during the neonatal period because they develop hyperglycemia of prematurity spontaneously (27), are long-lived animals, have close (98%) phylogenetic proximity with humans, and develop insulin resistance/hyperglycemia when obese (28). In the present study, we have used the euglycemic hyperinsulinemic clamp (29) to quantitate insulin sensitivity in neonatal baboons because it has been demonstrated that molecular mechanisms involved in muscle and adipose insulin resistance of adult baboons are similar to those in man (28).
The biological basis for the insulin resistance of prematurity remains unclear, and our understanding of the developmental regulation of glucose production and its mechanisms remains fragmentary. No previous study has examined insulin sensitivity in an extremely preterm animal in a serial manner, and, to date, no study has evaluated insulin sensitivity in preterm humans. The primary objective of this study was to examine maturational differences in insulin sensitivity and in the insulin-signaling pathway in skeletal muscle during the early postnatal period using the euglycemic hyperinsulinemic clamp. A secondary objective was to investigate maturational differences in adipose tissue.
Research Design and Methods
Animal care
A total of 30 baboons were studied: 16 were delivered at 185 days' gestational age (full term), and 14 were delivered at 125 ± 2 days of gestational age (67% of gestation) at the University of Texas Health Science Center in San Antonio (San Antonio, Texas), the Texas Biomedical Research Institute (San Antonio, Texas), or at the University of Oklahoma Health Sciences Center (Oklahoma City, Oklahoma). The animals were delivered prematurely or at term via cesarean section under general anesthesia from healthy, nondiabetic mothers or by vaginal delivery (only term for postnatal survival); fetal animals were killed immediately after birth at the same gestational age and were used as shared controls. All preterm baboons were of an appropriate weight for their gestational age. The Institutional Animal Care Committee at the Texas Biomedical Research Institute and University of Texas Health Science Center in San Antonio approved the studies. Animal experiments were conducted in accordance with accepted standards of humane animal care. Primary analysis was based on the rate of insulin-stimulated glucose metabolism (M) to determine differences in insulin sensitivity between preterm and term baboons. Based on our preliminary data, the M value for term infants at 5 days of life (DOL) was 23 ± 1.6 mg/kg · min, whereas the M value in preterm baboons was 11 ± 2.7 mg/kg · min. We calculated that five animals per group were sufficient to detect a significant difference between groups with 80% power and an alpha of 5%.
Routine care for preterm animals was done as previously described with the exception of iv nutrition and glucose management (27). To prevent hypoglycemia, a 2.5% iv dextrose solution was started after birth at a rate of 150 mL/kg · d. The glucose infusion rate (GIR) was titrated to maintain a target glucose of 50–100 mg/dL using a sliding scale that allowed the adjustment of the GIR every 2–4 hours by 1–2 mg/kg · min. Measurements of glucose levels were obtained shortly after birth and then at a minimum of every 4 hours using the AU640 immunoanalyzer (Olympus Inc) or GM9 glucose analyzer (Analox Instruments Ltd). Additional glucose measurements were obtained if serum glucose was out of target. Urine glucose was measured at least every 12 hours by Multistix 10 SG reagent strips for urinalysis [Siemens (Bayer) Medical Solutions Inc]. Intravenous insulin could be given if the serum glucose was greater than 200 mg/dL despite stopping the iv dextrose infusion. Parenteral nutrition was initiated at 24 hours of life with a mixture of pediatric amino acids at a dose of 1.75 g/kg · d and increased to 3.5 g/kg · d by 48 hours of life and maintained at this rate until 12 hours prior to the initiation of the insulin clamp, at which time the amino acid infusion was stopped. Intravenous lipids were not administered. Enteral feedings were initiated on day 3 of life with Similac formula (Abbot Laboratories) and increased as tolerated by 10–20 mL/kg · d. Feedings were stopped 24 hours prior to the insulin clamp.
Routine care for term animals
Animals were fed by their mother until their transfer to the nursery and then fed following a veterinarian protocol with Similac (Abbot Laboratories) four to five times a day until 12 hours prior to experiments when they were placed nil per os. For experiments, animals were sedated with ketamine (10 mg/kg, im) and isoflurane gas anesthesia (1%-2%) and intubated. Two peripherally inserted central catheters were placed, or if necessary, femoral arterial or venous cut-downs were performed to insert the central catheters. Normal saline was started at a rate of 120 mL/kg · d. A glucose infusion was initiated to avoid hypoglycemia if serum glucose was less than 50 mg/dL. Measurements of glucose levels were obtained hourly using the AU640 immunoanalyzer (Olympus Inc). Additional glucose measurements were obtained if serum glucose was out of target (50–100 mg/dL). Analgesia (Meloxicam 0.2 mg/kg im) was given for potential pain in biopsy and catheter placement sites. Full-term animals that served as gestational controls were fed by their mothers and sedated with ketamine (10 mg/kg) prior to euthanasia without any interventions. All animals were euthanized with pentobarbital followed by exsanguination.
Euglycemic hyperinsulinemic clamp procedure
Insulin sensitivity was measured by performing serial euglycemic hyperinsulinemic clamps as previously described (29). Two 120-minute insulin clamps were performed: one at 5 ± 2 DOL and at 14 ± 2 DOL. Animals received a prime (150 mU/kg−1 · min−1) plus constant infusion of insulin at a rate of 15 mU/kg−1 · min−1 (Novolin; Novo Nordisk Pharmaceuticals). At the same time, glucose (25% dextrose in water) was infused at a variable rate to clamp blood glucose concentration at 60–80 mg/dL. Blood samples were obtained at 5- to 10-minute intervals throughout the clamp to monitor the plasma glucose concentration and to adjust the glucose infusion to maintain euglycemia. Plasma samples were collected to determine serum insulin at −180, 0, +30, +60, +90, and +120 minutes during the insulin clamp by the Ultrasensitive Insulin ELISA kit from ALPCO Diagnostics [intraassay coefficient of variation percentage (CV) 5.2–11.1]. Insulin sensitivity was calculated as previously described (29).
Plasma glucagon (enzyme immunoassay kit from ALPCO Diagnostics; intraassay CV 3.3–5.1), plasma catecholamine research ELISA TM enzyme immunoassay; Labor Diagnostika Nord GMBH & Co; intraassay CV 8.4–10.5), and serum free fatty acids (FFAs) [HR Series NEFA-HR(2) kit; Wako Diagnostics] were measured at time 0 and +120 minutes. Animals were normotensive, euglycemic, and off medications that may alter glucose metabolism for more than 24 hours prior to the clamp.
Muscle biopsies
Two muscle biopsies (basal and insulin stimulated) were performed during each insulin clamp (total of four biopsies). Muscle biopsies were obtained from the biceps femoris muscle via sharp dissection with a sterile technique from one leg for the first biopsy and from the contralateral leg for the second biopsy. Animals were anesthetized and received 1% lidocaine locally prior to the biopsies to obtain approximately 10 mg of muscle tissue. The tissues were snap frozen in liquid nitrogen and stored at −80°C.
Adipose tissue was collected immediately after euthanasia and was snap frozen and stored as above.
Measurement of insulin-signaling and glucose transporter proteins
Western blot analysis
Insulin signaling molecules were measured in skeletal muscle and adipose tissue using our previously described protocol, and the antibodies used are listed on Supplemental Table 1 (26). The intensities of the bands were quantified by densitometry using the imaging program from the National Institutes of Health (Bethesda, Maryland) and the results reported in arbitrary OD units. Glyceraldehyde-3-phosphate dehydrogenase (GAPDH) and/or Ponceau S from Thermo Fisher Scientific were used as loading controls (26). The gels were normalized using internal controls to ensure comparable gel-to-gel data analysis across groups. Phosphorylated proteins were normalized to their total protein content.
PCR analysis
Total RNA was extracted from the tissues using the RNeasy minikit from QIAGEN. Relative quantitation of gene expression was accomplished with the TaqMan (Life Technologies) methodology using the relative standard curve method. The following TaqMan gene expression assays for PCR primers/probes were obtained from Life Technologies: GLUT4/(Hs00168966_m1), GLUT1/(Hs00892681_m1), Akt-1/(Hs00178289_m1), IRS-1/(Hs00178563_m1), and insulin receptor (INSR)/(Hs00961554_m1). The quantity of the mRNA for each gene of interest was normalized to importin 8 (IPO8)/(Hs00183533_m1). Real-time quantitative PCRs were performed as previously described and sequences from primers were similar to those previously published by our group (28).
Statistical analysis
Statistical calculations were performed with SPSS for Microsoft Windows (version 17.0; SPSS, Inc). A two-way ANOVA, followed by the Bonferroni and Tukey tests, repeated-measures ANOVA, paired and unpaired Student's t test, and χ2 tests were performed when appropriate. A value of P < .05 was considered statistically significant.
Results
Animal characteristics
Animal characteristics are shown in Table 1. Plasma insulin concentrations were similar between groups at birth and while fasting during the first week of life (Table 2). During the second week of postnatal life, the fasting plasma insulin concentration was higher in preterm infants (Table 2). In contrast, serum glucose concentrations remained similar at fast during the first 2 weeks of life; of note, we used fetal samples for the comparisons at birth for some animals born at term, which may explain the tendency for a lower fasting glucose level (Table 2). Serum glucose and daily GIR levels from preterm baboons are depicted in Figure 1, A and B. One preterm baboon received dopamine transiently to treat hypotension, but experimental procedures were not performed until more than 48 hours after dopamine was stopped. None of the animals received insulin or medications that could alter glucose metabolism.
Table 1.
Animal Characteristics
| Group | Gestation, % of term | Gestational Age, d | n | Female/Male | Birth Weight, g |
|---|---|---|---|---|---|
| Preterm control | 67 | 125 | 6 | 2/4 | 389 ± 40 |
| Preterm +14 days | 67 | 125 | 8 | 5/3 | 375 ± 42 |
| Term control | 94 | 185 | 6 | 3/3 | 845 ± 133 |
| Term +28 days | 94 | 185 | 10 | 6/4 | 921 ± 141 |
Means ± SD are shown.
Table 2.
Laboratory Values
| Group | Preterm | Term | P Value |
|---|---|---|---|
| Fasting insulin, μIU/mL | |||
| Birth | 1.1 ± 1.0 | 2.4 ± 2.8a | .2 |
| DOL5 | 6.4 ± 7.8 | 4.6 ± 6.2 | .6 |
| DOL14 | 9.9 ± 9.1 | 1.1 ± 0.9 | .05 |
| Fasting glucose, mg/dL | |||
| Birth | 50 ± 20 | 35 ± 5a | .07 |
| DOL5 | 68 ± 13 | 68 ± 18 | .9 |
| DOL14 | 68 ± 15 | 64 ± 22 | .6 |
| Fasting glucagon, pg/mL | |||
| DOL5 | 30 ± 24 | 86 ± 71 | .07 |
| DOL14 | 30 ± 36 | 199 ± 141 | .03 |
Serum concentrations ± SD are shown.
Fetal term animals.
Figure 1.

Daily serum glucose concentrations and GIRs in preterm baboons. Serum glucose measurements are represented as medians with interquartile ranges shown as black lines (A). Daily median glucose infusion rates are expressed as milligrams per kilogram per minute and compared each day of life with interquartile ranges shown as black lines (B).
Insulin sensitivity
Serum insulin was significantly increased from baseline to the end of the clamp to a target of greater than 1000 μU/mL and was similar between groups (Figure 2, A and B); this level was chosen because it had been previously shown to achieve 100% suppression of endogenous glucose production in newborn beagles (30). Preterm baboons had reduced peripheral insulin sensitivity compared with their term counterparts on DOL5 (M value 12.5 ± 1.5 vs 21.8 ± 4.4 mg/kg · min, P < .001) and DOL14 (M value 12.8 ± 2.6 vs 16.3 ± 4.2 mg/kg · min, P = .04) (Figure 2C). Insulin sensitivity did not improve with postnatal age in preterm baboons. Term baboons tended to be more sensitive to insulin during the first week of life than during the second week of life but failed to reach statistical significance (Figure 2C).
Figure 2.
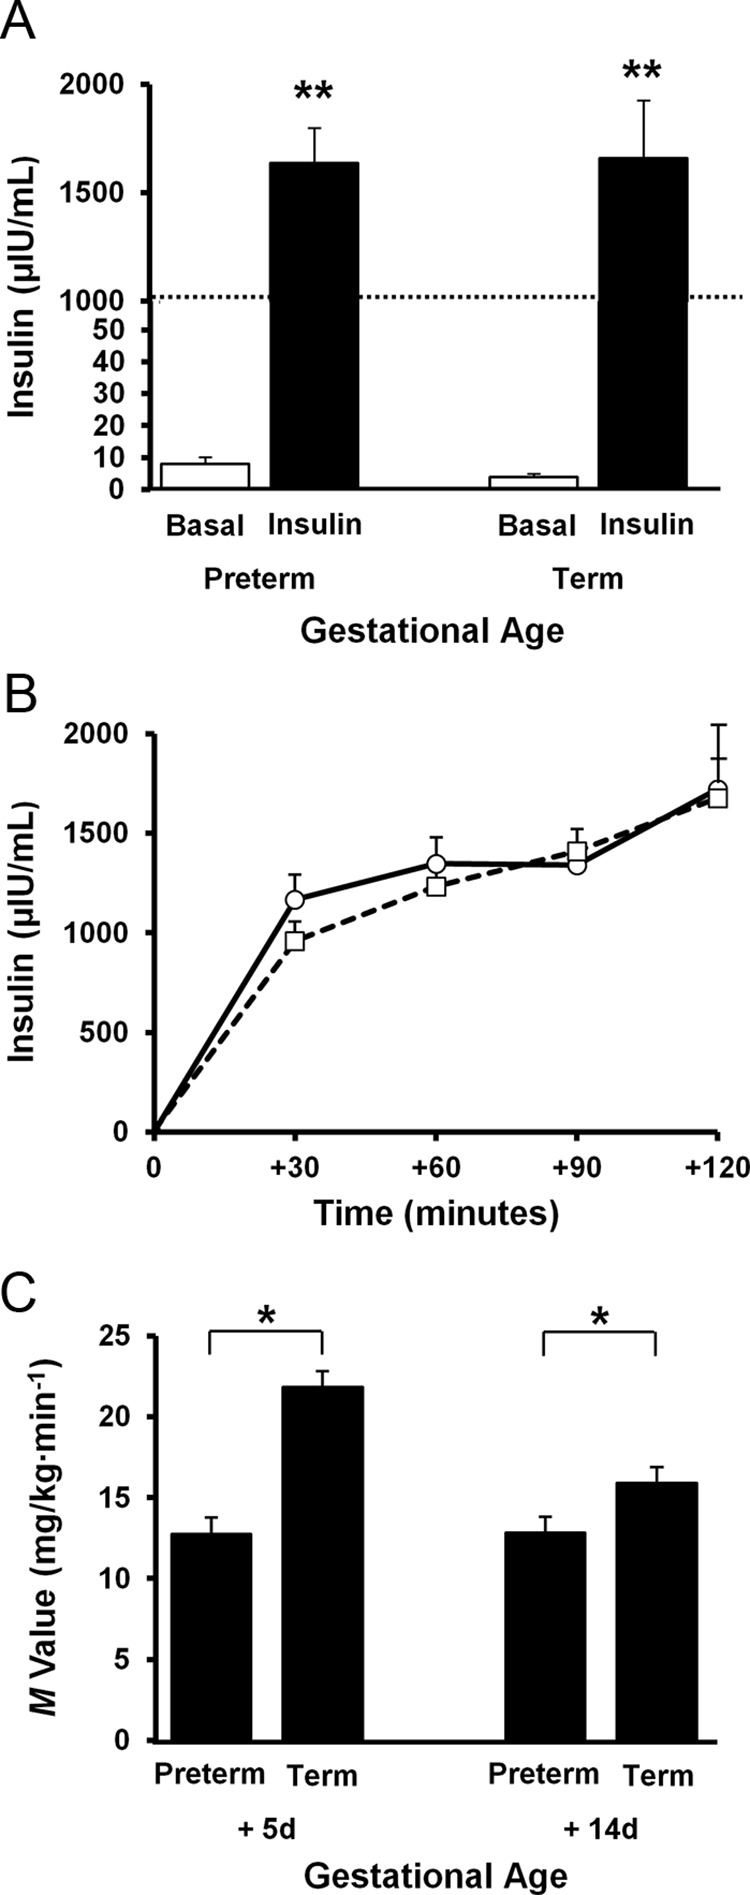
Plasma insulin concentrations and peripheral insulin sensitivity during euglycemic hyperinsulinemic clamp. (A) Serum insulin levels at baseline are shown in white boxes, whereas insulin levels are shown in dark boxes in both preterm and term baboons. Dotted line is depicted to mark where the graph was superimposed to decrease the height of the bar. **, P < .01. (B) Serum insulin levels are shown at 30-minute intervals during the 120-minute insulin clamp. Preterm baboons are shown with a dotted line and square markers, whereas term animals are shown with a solid line and circle markers. Error bars show mean ± 1.0 SE. (C) Insulin sensitivity (M value) is shown in preterm and term animals at 5DOL and 14DOL.
FFAs and counterregulatory hormones
Fasting serum FFA (time 0) was significantly lower in preterm baboons during the first week of life (P < .01) and was similar to term by the second week of life (Figure 3A). In response to insulin, serum FFAs did not decrease (from time 0 to +120) in preterm baboons on DOL5 or DOL14 (Figure 3A); in term baboons, serum FFAs decreased by 88% after insulin stimulation on DOL5 and by 80% on DOL14 (P < .05, Figure 3A).
Figure 3.

Developmental differences in adipose tissue. Serum concentrations of FFAs of preterm and term animals at baseline are shown in white boxes, whereas response of FFAs to insulin are shown in dark boxes at DOL5 and DOL14 (A). Protein content and gene expression of Akt (B) and GLUT4 (C) were measured by Western blotting and in preterm and term baboons at necropsy. Representative blots from each group are also shown. Data are means ± SE. *, P < .05. d, day.
Plasma glucagon was significantly lower in preterm baboons compared to term baboons both at baseline and after maximal insulin stimulation during the first 2 weeks of life (Figure 4A). Fasting glucagon measurements are shown in Table 2. During the insulin clamp, plasma glucagon decreased in term baboons from 85 ± 71 to 26 ± 25 pg/mL (time 0 to +120) at DOL5 and from 199 ± 140 to 135 ± 113 pg/mL (time 0 to +120) at DOL14 (P < .05 and P = .05, respectively). In preterm baboons, plasma glucagon did not decrease after insulin stimulation on DOL5 (30 ± 23 to 24 ± 21 pg/mL, time 0 to +120, respectively); plasma glucagon tended to decrease at DOL14 in preterm baboons (30 ± 35 to 0.5 ± 1.1 pg/mL, time 0 to +120, respectively, P = .1). Plasma epinephrine was similar between preterm and term animals at DOL5 and DOL14 and did not change during the insulin clamp (Figure 4B). Plasma norepinephrine was higher in preterm baboons compared with their term counterparts and similar to fetal baboons (Figure 4C).
Figure 4.

Counterregulatory hormones. Plasma concentrations of glucagon (A), epinephrine (B), and norepinephrine (C) in fetal control, preterm, and term baboons are depicted. Fetal controls are shown in boxes with diagonal lines, basal concentrations are shown in white boxes, and concentrations during the insulin clamp are shown in dark boxes. Data are means ± SE. *, P < .05; **, P < .01.
Developmental differences of key insulin-signaling molecules in skeletal muscle and adipose tissue
Muscle Akt content
Tyrosine phosphorylation of Akt (Ser473) increased after insulin stimulation in preterm and term baboons on DOL5 and DOL14 (P < .05); however, the response of phosphorylated (p) Akt to insulin stimulation was significantly lower in preterm baboons on DOL5 with a 3.2-fold increase from baseline in preterm animals vs 9.8-fold increase from baseline in term animals (Figure 5A). By DOL14, preterm baboons had similar responses in tyrosine phosphorylation of Akt when compared with term counterparts (Figure 5A). Akt-1 mRNA expression was similar between groups (Figure 5B).
Figure 5.

Developmental differences in pAkt (normalized to Akt) and AKt-1 in skeletal muscle. Fold change (from basal) in protein content of pAKt (A) in preterm and term animals at DOL5 and DOL14 were measured by Western blotting and quantitative RT-PCR, respectively. Akt-1 gene expression is shown at DOL5 and DOL14 (B). Representative blots are also shown only a portion of ponceau S is shown, but the whole gel image confirmed equal loading. D, day. Data are means ± SE. *, P < .05.
Content of IR-β, IRS-1, and p85 subunit of PI3-kinase
IR-β gene expression tended to be lower in premature animals compared with term animals at DOL5 but failed to reach statistical significance (P = .08) (Supplemental Figure 1). IRS-1 mRNA expression in skeletal muscle under basal and insulin-stimulated conditions was similar between preterm and term animals (Supplemental Figure 1). The protein content of pIRS-1, IR-β, pIR-β, and the p85 subunit of PI3-kinase was similar in the muscle of both, preterm and term animals (P = NS, not shown).
Glucose transporters in skeletal muscle
The muscle of preterm baboons had markedly lower GLUT1 protein content at DOL5 (12% of term newborns, P < .05) and remained low at DOL14 (8% of term, P = .04) (Figure 6A). In contrast, GLUT1 mRNA expression was similar across gestational ages and did not change over time (Figure 6C). GLUT4 protein content was similar between preterm and term animals at DOL5 and was significantly lower in term animals at DOL14 (Figure 6B). GLUT4 gene expression was similar between groups (Figure 6D).
Figure 6.

Protein content and gene expression of key glucose transporters in skeletal muscle. Protein content and gene expression of GLUT1 and GLUT4 were measured by Western blotting (A and B) and quantitative RT-PCR (C and D) in preterm and term baboons at DOL5 and DOL14. Data from muscle samples taken at baseline are shown in white boxes, whereas those samples taken under insulin stimulation are shown in dark boxes in both preterm and term baboons. Representative blots from each group are also shown. GAPDH served as a loading control. d, day; GAPDH, glyceraldehyde-3-phosphate dehydrogenase. Data are means ± SE. *, P < .05; **, P < .01.
Content of Akt, IRS-1, and GLUT4 in adipose tissue
Total Akt tended to be lower in preterm baboons when compared with the term counterparts but failed to reach statistical significance (P = .2, Figure 3B). Tyrosine phosphorylation of Akt (Ser473), pIRS-1, and IRS-1 were almost undetectable in adipose tissue in both preterm and term animals. The adipose tissue of preterm baboons had markedly lower GLUT4 protein content at DOL14 as compared with term baboons (Figure 3C).
Discussion
Premature infants are the largest clinical population in the neonatal intensive care unit, and hyperglycemia remains a prevalent condition, increasing their risk of brain injury and death (8, 12). To further complicate their outcomes, young adults born preterm are at high risk for abnormal glucose metabolism with decreased β-cell function (31) and increased incidence of type 1 and 2 diabetes. There is a large amount of evidence of developmental programming in which metabolic disturbances early in life might have long-lasting consequences (31–33). Therefore, it is important to understand the biological basis of abnormal glucose homeostasis in the neonatal period.
In this study, we demonstrated marked peripheral insulin resistance in muscle and adipose tissue of preterm baboons compared with term baboons soon after birth. This insulin resistance was accompanied with alterations in the insulin signaling pathway in the muscle of preterm baboons during the first 14 days of postnatal life. Insulin resistance was evidenced by a significantly lower M value in preterm baboons under maximal insulin stimulation during the first 2 weeks of life as compared with their term counterparts. This insulin resistance did not improve from the first to the second week of life evidenced by an almost identical M value at DOL5 and DOL14. We chose a high insulin infusion rate to ensure that hepatic glucose production would be completely suppressed (30), and thus, the glucose infusion rate reflects glucose uptake by peripheral tissues.
To further elucidate the peripheral insulin resistance seen in preterm animals, we investigated the insulin-signaling cascade. In skeletal muscle, Akt is a key mediator of insulin-stimulated glucose disposal and cell growth (34). In both preterm and term baboons, insulin increased Akt phosphorylation, but these responses varied, depending on gestational age. The pAkt fold increase was significantly lower in preterm vs term baboons during the first week of life (3.2-fold vs 9.8-fold), which is consistent with the strikingly decreased peripheral insulin sensitivity in preterm baboons during the first week of life. During the second week of life, insulin sensitivity remained the same in preterm infants, but term infants tended to have a decrease in insulin sensitivity but remained higher than in preterms, and this difference was still significant. The lack of differences at the molecular level (pAkt in particular) during the second week of life might be due to other insulin-signaling molecules not measured, playing a role during the second week of life. Akt exists as several isoforms. In muscle, the most abundant isoforms are Akt-1 and Akt-2 (35). No differences were found in Akt-1 mRNA expression between preterm and term animals. Unfortunately, due to the limited amount of tissues available in these small animals, Akt-2 was not quantified.
Along with the reductions in pAkt responses, we found a tendency for a lower gene expression of IR-β in the muscle of preterm baboons during the first week of life but then normalized to the mRNA expression found in their term counterparts during the second week of life. This mild decrease in IR-β mRNA in skeletal muscle might contribute to the insulin resistance of prematurity, but no differences were found in protein expression or in IRS-1 or PI3-kinase. We previously demonstrated that preterm infants had a significant increase in IR-β immediately after birth compared with term counterparts (26). The lack of consistency of these results might be explained by the high variability of insulin signaling molecules, suggesting a need of a larger sample size, but due to the expensive nature of nonhuman primates, additional animal experiments were not performed. In this study, we demonstrated reduced GLUT1 protein content in premature baboons compared with term baboons. These changes are consistent with our previous studies, in which we found a significant decrease of GLUT1 protein content in immature fetal baboons (26). GLUT1 is responsible for the constitutive, insulin-independent glucose transport that takes place in all cells, including muscle (36). GLUT1 overexpression results in a 3- to 4-fold increase in basal glucose transport in muscle ex vivo and improves glucose tolerance (37), suggesting that GLUT1 also plays an important role in maintaining whole-body glucose homeostasis. Therefore, the significant decrease in GLUT1 protein in the muscle of preterm baboons may contribute to the impairment in non-insulin-dependent glucose metabolism. Gene expression remained unchanged, which is not uncommon because correlations could be low due to the variable rates of mRNA transcription and protein translation.
Muscle GLUT4 protein content was similar in preterm and term animals during the first week of life and higher in preterm baboons by the second week of life. GLUT4 is the main glucose transporter involved in postprandial glucose transport, when circulating insulin concentrations are the highest (36). Studies in fetal sheep have shown transient increases and decreases of glucose transporters in insulin-sensitive and insulin-insensitive tissues in response to hyperglycemia and hyperinsulinemia (24). These responses are variable, depending on the type of exposure and tissue exposed (24). We speculate that preterm infants may develop alterations in insulin-signaling molecules as a result of developmental disruption of fetal glucose metabolism. Perhaps the increases in the expression of GLUT4 by the second week of life in preterm baboons may be a neonatal adaptation in an attempt to improve insulin sensitivity. On the other hand, it could be due to tissue responses to the increasing fasting insulin levels observed in preterm baboons by 14 days of age (Table 2). Our findings indicate that alterations in glucose transporters differ in skeletal muscle of preterm and term baboons, and this may explain the gestational differences in glucose homeostasis during early postnatal life.
To our knowledge, this is the first study to demonstrate insulin resistance in a preterm animal model along with impairments of insulin signaling in the skeletal muscle, and we were able to perform two insulin clamps longitudinally in an extremely preterm animal (67% gestation). Human studies are not possible because muscle biopsies cannot ethically be performed in the neonatal period. Although sheep or mice could be used, no other preterm animal at borderline viability can survive for more than 48 hours like the baboon.
Our group recently demonstrated that hyperglycemia is common in the preterm baboon and increases their risk of death (27). In that study, 91% of preterm baboons developed hyperglycemia and had poor glucose control. In this study, we had a tight glucose control from birth by limiting the glucose infusion using a sliding scale to target serum glucose instead of targeting growth. In human premature infants, this study could not be possible because glucose infusion is increased to increase caloric intake, regardless of serum glucose level (unless it is > 150 mg/dL) and intralipids are given from birth on. Therefore, in this study under tight normoglycemic conditions, hyperglycemia does not contribute to the insulin resistance observed. Furthermore, lipid emulsions were not infused because they are known to cause insulin resistance. Preterm baboons had similar insulin levels to term baboons at birth; therefore, hyperinsulinemia could not be responsible for the insulin resistance observed but, rather, developed over time as evidenced by the increases in fasting insulin levels by DOL14 in preterm animals. Of note, there were no deaths in our preterm baboons in the present study as compared with the high risk of death observed in our previous published studies in hyperglycemic baboons (27). We attribute this to the tight glucose control during the early postnatal period and believe this observation has important implications for the management of human premature infants.
It is possible that counterregulatory hormone surges (cathecolamines, glucagon) at the time of birth may cause insulin resistance and worsen hyperglycemia in premature infants. Epinephrine levels were not increased compared with term infants, but norepinephrine levels were higher in preterm baboons. However, norepinephrine infusions, unlike epinephrine, have been shown not to adversely affect insulin sensitivity in humans (38). Additionally, previously published plasma levels of norepinephrine in the chronically ventilated preterm baboon model peaked at approximately 7000 pg/mL at 24 hours of age, suggesting that our experiments were performed after norepinephrine had peaked and gone back to the baseline levels seen in fetal preterm baboons of approximately 1000 pg/mL (39). Furthermore, the serum glucagon concentration was significantly lower in preterm baboons throughout the first 2 weeks of life during fasting and during the clamp compared with term baboons, indicating that preterm baboons had a significant impairment in glucagon secretion. Therefore, hyperglucagonemia cannot contribute to the insulin resistance in the present study or the development of hyperglycemia. These differences in glucagon secretion and the pancreatic responses to insulin may be related to pancreatic developmental differences as previously shown by our group (40). To further complicate pancreatic development, our group has found the presence of pluripotential pancreatic cells in preterm fetal baboons (40). These maturational differences may have long-term consequences when born preterm as we have now seen an increased incidence of type 1 diabetes in preterm infants (32).
Lastly, we found insulin resistance in the adipose tissue, as demonstrated by impaired suppression of FFAs after maximal insulin stimulation in preterm baboons (Figure 3A). This was paired with decreased GLUT4 protein content in adipose tissue (Figure 3C) in preterm baboons. We need to further elucidate whether these alterations in GLUT4 protein content are reversible and whether they persist into adulthood. Insulin resistance in type 2 diabetes is in part due to impaired stimulation of GLUT4 translocation and trafficking in the adipose tissue and has been a target for therapeutic interventions to improve insulin sensitivity (41). In premature infants, the therapeutic options available to improve glucose control in the neonatal period are limited to insulin. Understanding the specific mechanisms for insulin resistance of prematurity may improve glucose control in the neonatal period with a long-term goal of decreasing the emergence of type 2 diabetes that appears early in life in surviving adults born preterm.
The protein content of Akt in adipose tissue tended to be lower in preterm baboons but failed to reach significance (Figure 3B); this was likely due to the small sample size because the differences seemed significant to the naked eye. These alterations in insulin-signaling molecules may contribute to the peripheral insulin resistance of the adipose tissue found in preterm baboons. The alterations of adipose tissue are consistent with findings in human adipocytes of diabetic adults who have significant reductions in the protein content of Akt (42). Furthermore, Akt and IRS-1 have been shown to be altered in adipose tissue of adult rats with altered fetal growth, which in humans has been shown to be associated with metabolic syndrome (43). A limitation to this study was the lack of adipose tissue collection during insulin stimulation; as expected, there was a lack of detection of phosphorylated Akt and IRS-1 because adipose tissue was collected after necropsy and therefore was no longer under maximal insulin-stimulated conditions. Additional studies using insulin-stimulated adipose tissue responses are needed, but due to limited amount of adipose tissue in the neonatal period, those studies will need to be performed later in life.
These findings are of extreme importance because infants born prematurely are at high risk for diabetes and cardiovascular disease (44, 45). Furthermore, type 2 diabetes in children is more aggressive than in adults, with signs of kidney disease and hypertension just a few years after diagnosis (46). We postulate interventions that improve insulin resistance and glucose control in premature infants may lead to improved cardiovascular outcomes and decreased incidence of diabetes and obesity later in life. It is therefore it is critical to understand developmental differences between premature and term infants to prevent long-term sequelae.
In conclusion, peripheral insulin resistance and impaired noninsulin dependent glucose disposal play an important role in prematurity. Impaired insulin signaling in both muscle and adipose tissue contribute to the defect in insulin-stimulated glucose disposal. Counterregulatory hormones are not major contributors to the insulin resistance and hyperglycemia of prematurity. Understanding the underlying mechanisms responsible for the development of insulin resistance and hyperglycemia in the neonatal period likely will identify novel interventions to ameliorate the insulin resistance and correct hyperglycemia in premature infants and requires further investigation.
Acknowledgments
We thank the personnel from the Veterinarian Services at University of Texas Health Science Center at San Antonio, the Oklahoma Primate Center, and the Texas Biomedical Research Institute for their dedication and support for this project.
Authors' contributions and statement of assistance included the following: C.L.B. is the guarantor of this work and, as such, had full access to all of the data in the study and takes responsibility for the integrity of the data and the accuracy of the data analysis. C.L.B, N.M., and R.D. designed the study. C.L.B., D.G.A., M.J., and H.L. performed the key experiments. C.L.B., L.L.M.-V., D.A., M.C.J., A.G., N.M., and R.A.D. participated in the planning of the work and the interpretation of the results. C.L.B., S.R.S, D.C.M., M.M.L., and L.L.M.-V. designed the animal care and were on call 24 hours a day, 7 days a week for all the animals. All of the authors have participated in the writing of the paper.
This work was supported by the American Diabetes Association (to C.L.B., R.A.D., and N.M.); the Robert Wood Johnson Foundation (to C.L.B.); University of Texas Health Science Center at San Antonio Clinical and Translational Science Award UL1RR025767 (to C.L.B.); the National Institutes of Health Grants HL52636 (to the BPD Resource Center), AG030979 (to N.M.), DK080157 (to N.M.), and DK24092 (to R.A.D.); Grant P51RR13986 for facility support at the Texas Biomedical Research Institute, the San Antonio Nathan Shock Center (to N.M.); the University of Texas Health Science Center at San Antonio Executive Research Committee (to N.M.); the South Texas Health Research Center (to N.M.); and the US Department of Veterans Affairs (to R.A.D.). The salary of R.A.D. was, in part, supported by the South Texas Veterans Health Care System, Audie Murphy Division.
Disclosure Summary: The authors have nothing to disclose.
Footnotes
- CV%
- coefficient of variation percentage
- DOL
- days of life
- FFA
- free fatty acid
- GIR
- glucose infusion rate
- GLUT
- glucose transporter
- IR
- insulin receptor
- IRS-1
- IR substrate-1
- M value
- insulin-mediated glucose uptake
- p
- phosphorylated
- PI3-kinase
- phosphatidylinositol 3-kinase.
References
- 1. Martin JA, Hamilton BE, Ventura SJ, Osterman MJK, Matthews TJ. Births: final data for 2011. Centers for Disease Control and Prevention, National Center for Health Statistics. Natl Vital Stat Rep. 2013;62(1):1–69, 72. [PubMed] [Google Scholar]
- 2. Whincup PH, Kaye SJ, Owen CG, et al. Birth weight and risk of type 2 diabetes. JAMA. 2008;300:2886–2897. [DOI] [PubMed] [Google Scholar]
- 3. Hovi P, Andersson S, Eriksson JG, et al. Glucose regulation in young adults with very low birth weight. N Engl J Med. 2007;356:2053–2063. [DOI] [PubMed] [Google Scholar]
- 4. Hofman PL, Regan F, Cutfield WS. Prematurity—another example of perinatal metabolic programming? Horm Res. 2006;66:33–39. [DOI] [PubMed] [Google Scholar]
- 5. Rotteveel J, van Weissenbruch MM, Delemarre-Van de Waal HA. Decreased insulin sensitivity in small for gestational age males treated with GH and preterm untreated males: a study in young adults. Eur J Endocrinol. 2008;158:899–904. [DOI] [PubMed] [Google Scholar]
- 6. Bacchetta J, Harambat J, Dubourg L, et al. Both extrauterine and intrauterine growth restriction impair renal function in children born very preterm. Kidney Int. 2009;76:445–452. [DOI] [PubMed] [Google Scholar]
- 7. Hack M. Young adult outcomes of very low-birth-weight children. Semin Fetal Neonatal Med. 2006;11:127–137. [DOI] [PubMed] [Google Scholar]
- 8. Blanco CL, Baillargeon JG, Morrison RL, Gong AK. Hyperglycemia in extremely low birth weight infants in a predominantly Hispanic population and related morbidities. J Perinatol. 2006;26:737–741. [DOI] [PubMed] [Google Scholar]
- 9. Hey E. Hyperglycaemia and the very preterm baby. Semin Fetal Neonatal Med. 2005;10:377–387. [DOI] [PubMed] [Google Scholar]
- 10. Garg R, Agthe AG, Donohue PK, Lehmann CU. Hyperglycemia and retinopathy of prematurity in very low birth weight infants. J Perinatol. 2003;23:186–194. [DOI] [PubMed] [Google Scholar]
- 11. Hall NJ, Peters M, Eaton S, Pierro A. Hyperglycemia is associated with increased morbidity and mortality rates in neonates with necrotizing enterocolitis. J Pediatr Surg. 2004;39:898–901. [DOI] [PubMed] [Google Scholar]
- 12. Alexandrou G, Skiold B, Karlen J, et al. Early hyperglycemia is a risk factor for death and white matter reduction in preterm infants. Pediatrics. 2010;125:e584–e591. [DOI] [PubMed] [Google Scholar]
- 13. Liechty EA. The resistant premie: documenting the prevalence of hyperglycemia in the extremely low birth weight infant. J Pediatr. 2010;157:699–700. [DOI] [PubMed] [Google Scholar]
- 14. Hewson M, Nawadra V, Oliver J, Odgers C, Plummer J, Simmer K. Insulin infusions in the neonatal unit: delivery variation due to adsorption. J Pediatr Child Health. 2000;36:216–220. [DOI] [PubMed] [Google Scholar]
- 15. Goldman SL, Hirata T. Attenuated response to insulin in very low birthweight infants. Pediatr Res. 1980;14:50–53. [DOI] [PubMed] [Google Scholar]
- 16. Ng SM, May JE, Emmerson AJ. Continuous insulin infusion in hyperglycaemic extremely low-birth-weight neonates. Biol Neonate. 2005;87:269–272. [DOI] [PubMed] [Google Scholar]
- 17. Mitanchez-Mokhtari D, Lahlou N, Kieffer F, Magny JF, Roger M, Voyer M. Both relative insulin resistance and defective islet β-cell processing of proinsulin are responsible for transient hyperglycemia in extremely preterm infants. Pediatrics. 2004;113:537–541. [DOI] [PubMed] [Google Scholar]
- 18. Magnusson A, Powell T, Jansson T. Glucose metabolism in the human preterm and term placenta of IUGR fetuses. Placenta. 2004;25:337–346. [DOI] [PubMed] [Google Scholar]
- 19. Wallace JM, Milne JS, Aitken RP, Hay WW. Sensitivity to metabolic signals in late-gestation growth-restricted fetuses from rapidly growing adolescent sheep. Am J Physiol Endocrinol Metab. 2007;293:E1233–E1241. [DOI] [PubMed] [Google Scholar]
- 20. Jefferson AC. Regulation of Muscle glucose update in vivo. In: Mandarino LR, Bonadonna O, McGuinness A, Halseth, Wasserman D, eds. The Handbook of Physiology. Oxford, United Kingdom: The Oxford University Press; 2001:803–848. [Google Scholar]
- 21. Del Prato S, Leonetti F, Simonson DC, Sheehan P, Matsuda M, DeFronzo RA. Effect of sustained physiologic hyperinsulinaemia and hyperglycaemia on insulin secretion and insulin sensitivity in man. Diabetologia. 1994;37:1025–1035. [DOI] [PubMed] [Google Scholar]
- 22. Tantiwong P, Shanmugasundaram K, Monroy A, et al. NF-κB activity in muscle from obese and type 2 diabetic subjects under basal and exercise-stimulated conditions. Am J Physiol Endocrinol Metab. 2010;299:E794–E801. [DOI] [PMC free article] [PubMed] [Google Scholar]
- 23. Shepherd PR, Kahn BB. Glucose transporters and insulin action—implications for insulin resistance and diabetes mellitus. N Engl J Med. 1999;341:248–257. [DOI] [PubMed] [Google Scholar]
- 24. Anderson MS, Flowers-Ziegler J, Das UG, Hay WW, Devaskar SU. Glucose transporter protein responses to selective hyperglycemia or hyperinsulinemia in fetal sheep. Am J Physiol Regulatory Integrative Comp Physiol. 2001;281:R1545–R1552. [DOI] [PubMed] [Google Scholar]
- 25. He J, Thamotharan M, Devaskar SU. Insulin-induced translocation of facilitative glucose transporters in fetal/neonatal rat skeletal muscle. Am J Physiol Regulatory Integrative Comp Physiol. 2003;284:R1138–R1146. [DOI] [PubMed] [Google Scholar]
- 26. Blanco CL, Liang H, Joya-Galeana J, DeFronzo RA, McCurnin D, Musi N. The ontogeny of insulin signaling in the preterm baboon model. Endocrinology. 2010;151:1990–1997. [DOI] [PMC free article] [PubMed] [Google Scholar]
- 27. Blanco CL, McGill-Vargas LL, McCurnin D, Quinn AR. Hyperglycemia increases the risk of death in extremely preterm baboons. Pediatr Res. 2013;73:337–343. [DOI] [PMC free article] [PubMed] [Google Scholar]
- 28. Chavez AO, Lopez-Alvarenga JC, Tejero ME, et al. Physiological and molecular determinants of insulin action in the baboon. Diabetes. 2008;57:899–908. [DOI] [PubMed] [Google Scholar]
- 29. DeFronzo RA, Tobin JD, Andres R. Glucose clamp technique: a method for quantifying insulin secretion and resistance. Am J Physiol Endocrinol Metab. 1979;237:E214–E223. [DOI] [PubMed] [Google Scholar]
- 30. Hulman SE, Kliegman RM. Assessment of insulin resistance in newborn beagles with the euglycemic hyperinsulinemic clamp1. Pediatr Res. 1989;25:219–223. [DOI] [PubMed] [Google Scholar]
- 31. Kelly BA, Lewandowski AJ, Worton SA, et al. Antenatal glucocorticoid exposure and long-term alterations in aortic function and glucose metabolism. Pediatrics. 2012;129:e1282–e1290. [DOI] [PubMed] [Google Scholar]
- 32. Li S, Zhang M, Tian H, Liu Z, Yin X, Xi B. Preterm birth and risk of type 1 and type 2 diabetes: systematic review and meta-analysis. Obes Rev. 2014;15(10):804–811. [DOI] [PubMed] [Google Scholar]
- 33. Wang G, Divall S, Radovick S. Preterm birth and random plasma insulin levels at birth and in early childhood. JAMA. 2014;311:587–596. [DOI] [PMC free article] [PubMed] [Google Scholar]
- 34. Cho H, Thorvaldsen JL, Chu Q, Feng F, Birnbaum MJ. Akt1/PKBα is required for normal growth but dispensable for maintenance of glucose homeostasis in mice. J Biol Chem. 2001;276:38349–38352. [DOI] [PubMed] [Google Scholar]
- 35. Bae SS, Cho H, Mu J, Birnbaum MJ. Isoform-specific regulation of insulin-dependent glucose uptake by Akt/Protein Kinase B. J Biol Chem. 2003;278:49530–49536. [DOI] [PubMed] [Google Scholar]
- 36. Pessin JE, Bell GI. Mammalian facilitative glucose transporter family: structure and molecular regulation. Annu Rev Physiol. 1992;54:911–930. [DOI] [PubMed] [Google Scholar]
- 37. Marshall BA, Ren JM, Johnson DW, et al. Germline manipulation of glucose homeostasis via alteration of glucose transporter levels in skeletal muscle. J Biol Chem. 199;268:18442–18445. [PubMed] [Google Scholar]
- 38. Koopmans SJ, Ohman L, Haywood JR, Mandarino LJ, DeFronzo RA. Seven days of euglycemic hyperinsulinemia induces insulin resistance for glucose metabolism but not hypertension, elevated catecholamine levels, or increased sodium retention in conscious normal rats. Diabetes. 1997;46:1572–1578. [DOI] [PubMed] [Google Scholar]
- 39. Ervin MG, Seidner SR, Leland MM, Ikegami M, Jobe AH. Direct fetal glucocorticoid treatment alters postnatal adaptation in premature newborn baboons. Am J Physiol Regulatory Integrative Comp Physiol. 1998;274:R1169–R1176. [DOI] [PubMed] [Google Scholar]
- 40. Quinn AR, Blanco C, Perego C, et al. The ontogeny of the endocrine pancreas in the fetal/newborn baboon. J Endocrinol. 2012;214:289–299. [DOI] [PMC free article] [PubMed] [Google Scholar]
- 41. Maianu L, Keller SR, Garvey WTJ. Adipocytes exhibit abnormal subcellular distribution and translocation of vesicles containing glucose transporter 4 and insulin-regulated aminopeptidase in type 2 diabetes mellitus: implications regarding defects in vesicle trafficking. Clin Endocrinol Metab. 2001;86(11):5450–5456. [DOI] [PubMed] [Google Scholar]
- 42. Algenstaedt P, Rosenblatt N, Kolb I, Krützelmann A, et al. A new model of primary human adipocytes reveals reduced early insulin signalling in type 2 diabetes. Horm Metab Res. 2004;36(8):531–537. [DOI] [PubMed] [Google Scholar]
- 43. Berends LM, Fernandez-Twinn DS, Martin-Gronert MS, Cripps RL, Ozanne SE. Catch-up growth following intra-uterine growth-restriction programmes an insulin-resistant phenotype in adipose tissue. Int J Obes (Lond). 2013;37(8):1051–1057. [DOI] [PMC free article] [PubMed] [Google Scholar]
- 44. Massaeli H, Hurtado C, Austria JA, Pierce GN. Oxidized low-density lipoprotein induces cytoskeletal disorganization in smooth muscle cells. Am J Physiol Heart Circ Physiol. 1999;277:H2017–H2025. [DOI] [PubMed] [Google Scholar]
- 45. Lewandowski AJ, Lazdam M, Davis E, et al. Short-term exposure to exogenous lipids in premature infants and long-term changes in aortic and cardiac function. Arterioscler Thromb Vasc Biol. 2011;31:2125–2135. [DOI] [PubMed] [Google Scholar]
- 46. TODAY Study Group. Rapid rise in hypertension and nephropathy in youth with type 2 diabetes: the TODAY clinical trial. Diabetes Care. 2013;36:1735–1741. [DOI] [PMC free article] [PubMed] [Google Scholar]