


Abstract
Genetic screens of an unprecedented scale have recently been made possible by the availability of high-complexity libraries of synthetic oligonucleotides designed to mediate either gene knockdown or gene knockout, coupled with next-generation sequencing. However, several sources of random noise and statistical biases complicate the interpretation of the resulting high-throughput data. We developed HiTSelect, a comprehensive analysis pipeline for rigorously selecting screen hits and identifying functionally relevant genes and pathways by addressing off-target effects, controlling for variance in both gene silencing efficiency and sequencing depth of coverage and integrating relevant metadata. We document the superior performance of HiTSelect using data from both genome-wide RNAi and CRISPR/Cas9 screens. HiTSelect is implemented as an open-source package, with a user-friendly interface for data visualization and pathway exploration. Binary executables are available at http://sourceforge.net/projects/hitselect/, and the source code is available at https://github.com/diazlab/HiTSelect.
INTRODUCTION
RNA interference (RNAi) provides a powerful technique for gene knockdown by exploiting a cell's endogenous machinery for mRNA degradation. RNA-induced silencing complexes target mRNAs via short oligonucleotide guide strands excised from short-hairpin RNA (shRNA). Loss-of-function analysis via high-complexity shRNA screening has successfully identified pathways associated with cancer (1–4), modulators of ricin susceptibility (5), regulators of protein degradation (6) and barriers to cellular reprogramming (7). Additionally, the clustered regularly interspaced palindromic repeats (CRISPR) pathway has been adapted from the bacterial and archaeal immune systems for gene knockout in eukaryotic cells via synthetic single guide-RNA (sgRNA). CRISPR-based screening in human cells has been shown to scale genome-wide effectively (8,9).
A typical approach is to use barcoded lentiviral vectors to express genome-wide libraries of oligonucleotide guide-RNA (shRNA or sgRNA). Cells are infected in a pooled fashion. Subsequently, cells exhibiting a phenotype of interest (often in response to a treatment) are identified and isolated. Barcodes are recovered from both phenotype-positive and phenotype-negative cells via polymerase chain reaction (PCR) amplification and quantified via next-generation sequencing (NGS). The relative abundance of guide-RNA in the phenotype-positive population, as measured by the abundance of reads mapping to the corresponding barcode, allows one to infer the effect of inhibiting the targeted gene on phenotype.
Despite the power of genome-wide screens, off-target effects, variance in gene silencing efficiency and variance in sequencing depth of coverage can be significant, making it difficult to distinguish knockdowns/knockouts that truly regulate a given phenotype from background noise (10). Moreover, identifying relevant genes and pathways not only requires rigorous statistical methods for hit selection but also meta-analysis of relevant, secondary genomic data such as gene expression, chromatin state, known physical interactions and functional annotations. Thus, the enormous potential of pooled genome-wide screens is currently hampered by limitations in the methodologies for analysis. To address this roadblock, we developed a computational pipeline for analyzing pooled, high-complexity screens and implemented it into a user-friendly software package called HiTSelect (Supplementary Software). The HiTSelect pipeline includes comprehensive modules for screen hit selection based on robust statistics, a module for the integration of gene expression data, a module for functional annotation analysis, a module for genetic interaction analysis and a module for gene network visualization (Figure 1). We illustrate the power of HiTSelect using the data from our recent screen for genes that function as barriers to reprogramming somatic cells to induced pluripotent stem (iPS) cells, as well as another recently published data set from a screen for growth factors in ovarian carcinoma (4,7). We compare the gene-ranking module of HiTSelect to both the RNAi Gene Enrichment Ranking (RIGER) and the Redundant siRNA Activity (RSA) algorithms (11,12). We show that HiTSelect's ranking algorithm is both more sensitive and more specific, HiTSelect's predictions correlate better with secondary validation assays and HiTSelect is less prone to off-target effects than RSA or RIGER. While RSA and RIGER were designed for multi-well plate-based screens, and/or pooled screens with microarray readout, HiTSelect is specifically designed for high-complexity shRNA and CRISPR screens with NGS readout. In addition, HiTSelect provides tools for metadata integration, analysis and visualization that are not available in any other software.
Figure 1.
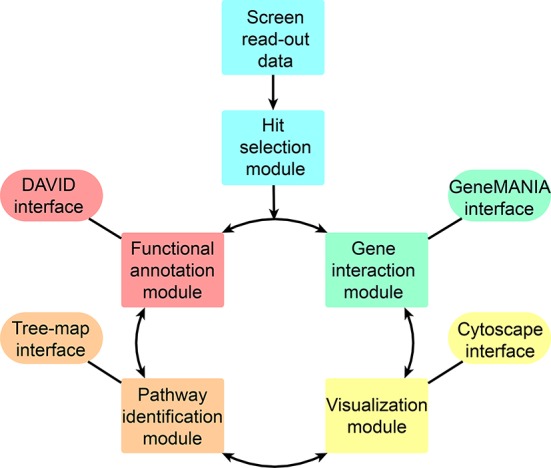
Flowchart for the HiTSelect de-convolution method. Screen de-convolution begins with loading screen readout and proceeds to hit selection. HiTSelect's hit selection module estimates and controls for variances in intra-library knockdown efficiency and sequencing depth-of-coverage. HiTSelect users may then iterate between rounds of (i) functional analysis and clustering, (ii) gene interaction and gene network-centrality estimation, (iii) interactive data visualization of gene ontology and gene interaction (via Cytoscape) data and (iv) searching, curating and comparing gene sets generated from their analyses.
MATERIALS AND METHODS
HiTSelect's gene ranking algorithms and statistics
Our hit selection method was developed with two concerns in mind: dealing with off-target effects and handling variances in sequencing depth-of-coverage and in knockdown/knockout efficiency across guide-RNA, which can be either shRNA in RNAi screens or sgRNA in CRISPR screens. To address the former, we use multi-objective optimization to identify genes with multiple highly active guide-RNA. To address the latter, we utilize a random effects model to assess sampling variance in the estimation of gene effect size. We focus on a two-group problem and assume that guide-RNA read counts have been tabulated from a phenotype positive sample  and a phenotype negative control sample
  . Let
. Let  and
and  denote the total numbers of sequenced reads from each population, respectively. For clarity, we use Greek letters to index guide-RNA and Roman letters to index genes.
To avoid division by zero in the following formulae, we add a pseudo-count of 1 read to each count. Let  denote the read count of the
  guide-RNA in
  . Let
. Let  denote the read count in
  normalized by sequencing depth
  . If the user selects the option to normalize by a user-provided list of control sequences, then we instead normalize by the ratio
  , where
  and
and  are the median read counts for the control sequences from
  and
and  , respectively. We model the activity level of the
  guide-RNA in the positive population by the read count log odds ratio (log-odds)
  that we estimate by the sample log-odds
  . Here
  and
and  are the (normalized) frequencies of reads in
  and
and  , respectively. In the case of normalization by user-defined control sequences
  and
and  . We designate a guide-RNA as ‘active’ if
  and
and  , where
  the sample median absolute deviation of the read counts in
  . The latter criterion eliminates undersequenced guide-RNA. We call a guide-RNA active if it has greater odds of being sequenced in the treatment population relative to control. Given a gene
  targeted by
  distinct guide-RNA
  with log-odds
  , we wish to combine them into a single measure of gene effect size. If
  had perfect efficiency in its knockdown/knockout of
  , reads mapping to
  would occur in
  with some log-odds
  determined solely by
  's effect on phenotype. In practice, there will be less than perfect efficiency and reads will occur with log-odds
  , for some
  to be determined. Thus,
  gives the variance in knockdown/knockout efficiency across guide-RNA targeting
  . The
. The  -statistic (13) of the residuals
  allows us to assess the homogeneity of knockdown/knockout efficiency across
  as well as compute an estimator of
  . Given that
  's standard error (
 ) is
) is  by normal approximation (in the case of sequencing depth normalization; for control sequence normalization, replace this formula with
  ), we have
  where
where  and
and  . Notice that the formula for the log-odds standard error is a decreasing function of increasing depth-of-coverage. From
  , DerSimonian and Laird (14) derive estimators of
  , given by
  , and
, and  , given by
  . Here
  and
and  . Thus, we model the effect size for gene
  by the summary log-odds
  that we estimate via
  . This model accounts for variance in knockdown/knockout efficiency across guide-RNA via
  and variance in the sequencing depth of individual guide-RNA via
  . We now describe how both the estimate of gene effect size
  and its variance estimate
  are used to formulate a probabilistic ranking scheme.
If we denote the number of active guide-RNA targeting gene  as
as  , then the pair
  characterizes the evidence for
  being a hit. We want to preferentially rank genes whose knockdown/knockout exhibits a large effect (
 is high) and for which that effect is reproducible (
 is high). To this end we developed a multi-objective optimization algorithm to maximize both quantities simultaneously. Our method for gene ranking uses the concept of Pareto dominance. A
  -tuple
  of real numbers measuring
  criteria for ranking is said to dominate another
  -tuple
  if: (i) for all
  ,
,  , and (ii) there exists at least one
  such that
  . If these conditions hold, then we write
  . Since this relationship defines only a partial ordering on the set of
  -tuples, it is possible that neither
  nor
nor  . We will write
  in the case that
  and
and  are not comparable. The gist of our algorithm will be to allow genes to compete for Pareto dominance in the multi-objective criterion
  .
.
A Pareto dominant gene is a superior candidate for a hit, since it shows an increase in summary guide-RNA log-odds, in the number of distinct active guide-RNA, or both. We therefore score genes by the number of other genes that they dominate. In the absence of uncertainty, our method would be to give each gene 1 point for every gene it dominates and 1/2 point for every gene to which it is not comparable. We then rank genes by the number of points they have. In this way, genes compete for dominance in the ranked list. This algorithm can be summarized as:
ALGORITHM 1: Deterministic multi-objective ranking
- For each gene
 :
:
- Set

- For each gene
 :
:
- If
 , then
- If
 , then
Rank genes based on their scores.
To make our method more robust, we incorporated uncertainty in the estimation of  , using a probabilistic version of this algorithm. For the independent random variables
  and
and  , we can define
  , where
  and
and  are sampled values of
  and
and  , respectively. In order to be able to compute
  , we need to make additional assumptions about how
  and
and  are distributed. In the case of normal distributions with unknown means and known variance
  and
and  , it can be shown (15) that
 |
Hughes (16) demonstrates that this formula can be further reduced to  . Here
  , and
, and  denotes the error function. We can use the above formulas to estimate
  for the gene pair
  and
and  . We can compute
  by setting
  . We treat the number of active guide-RNA,
  , as Poisson distributed, modeling the binary activities of guide-RNAs targeting a given gene
  as independent identically distributed Bernoulli random variables (17). Thus, to compute
  we need to compute the probability that
  is drawn from a Poisson distribution with mean less than the mean of the Poisson distribution from which
  was drawn. The test statistic
  is asymptotically standard normal under the null hypothesis of equal Poisson means (18) and has been shown to be more powerful than an exact test in determining whether two samples were drawn from Poisson distributions with the same rate (19). Thus, we replace
  above with
  when we compute
  . In general, guide-RNA pools targeting different genes will have different complexities, both in the original viral library and in the initial population of infected cells. We apply the Anscombe transform (
 ) to
) to  and
and  , before computing
  , to stabilize variance in sampling across genes targeted by guide-RNA pools of varying degrees of complexity (20). This has the practical effect of producing a more uniform Pareto dominance estimate for small differences in the number of observed active guide-RNA (Supplementary Figure S1). Note that once we define
  we can immediately define the probability of non-comparability:
  . Let
. Let  denote the set of all genes that have at least one active guide-RNA. We compute all pairwise Pareto dominance probabilities between genes in
  and assign a score to gene
  via the formula
  . We then rank genes by their score. Our algorithm, as implemented in HiTSelect, can be summarized as follows.
ALGORITHM 2: Stochastic multi-objective ranking
- For each gene
 :
:
- Set

- For each gene
 :
:
Rank genes based on their scores.


Joint-spectral network centrality for gene interaction networks
Given a set of genes of interest  , we wish to summarize multiple lines of evidence for their interaction into a single metric of a gene's influence. HiTSelect interfaces with GeneMANIA (http://genemania.org) to aggregate genetic interaction (the perturbation of one gene causing a change in expression of a second gene), physical interaction (protein–protein interaction) and co-localization (genes expressed in the same tissue) experimental data. Suppose we have
  total types of interaction, and for each interaction type, we have a measurement of the interaction strength
  ,
,  , between genes
  and
and  for the
  interaction type. We want to summarize these
  interaction networks. HitSelect computes the interaction strengths,
  , using GeneMANIA. We then replace each
  with its network-wide quantile
  , i.e. its quantile estimated from the set of numbers
  . This is done so that interaction strength estimates can be made comparable across networks. In matrix notation we write
  . We formulate a statistic on the set of graphs with common nodes labeled by the genes
  , and vertex sets that have the
  as their adjacency matrices. We refer to this ensemble of networks as the joint network.
Bonacich first identified the components of the dominant eigenvector of a connected network's adjacency matrix as a measure of network centrality for the corresponding nodes (21). This eigenvector solves  , where
  is the largest eigenvalue of
  in absolute value. We can extend network centrality to an estimate of joint-network centrality by solving the following optimization problem:
  . The first term assures
 is an approximate eigenvector for each of the
  networks. The second term,
  , assures convergence of iterative solution algorithms to a non-trivial solution by keeping iterates on the unit sphere and away from the origin. In the absence of this regularization term, the origin would be a basin of attraction. This restriction is acceptable, since we are only interested in the relative importance of genes to a particular pathway. HiTSelect solves this optimization problem using a sequential-quadratic program, with the centroid of the dominant eigenvectors of
  (normalized to unit length) as a starting value. As a termination criterion, HiTSelect uses the criterion that the objective function is
  or the algorithm has performed more than 400 iterations.
Comparison of HiTSelect to the RIGER and RSA methods
We compared the gene-ranking module of HiTSelect to RIGER and RSA on readout from two independent high-complexity shRNA screens: (i) Tan et al. screened mesenchymal (HeyA8) and stem-like (Stem-A) ovarian carcinoma cell subpopulations for genes responsible for growth and proliferation (4). Pooled libraries of 80 000 clones targeting 16 000 genes were introduced in the HeyA8 and Stem-A subpopulations separately. After 14 days, shRNA copy numbers were quantified in each population via NGS. The authors used the Stem-A population as a control to assess enrichment in the HeyA8 population. We here refer to HeyA8 as the treatment population. (ii) We co-infected human fibroblasts with lentivirus expressing a genome-wide high-coverage (600 000 shRNAs with ∼30 shRNA/gene) shRNA library along with SOX2, KLF4, OCT4 and c-MYC reprogramming factors and an shRNA targeting P53 (7). Following the appearance of colonies with iPS cell characteristics 28 days post induction, the transduced cells were FACS-purified for TRA-1-81, a marker of fully reprogrammed cells. Then, shRNAs recovered from the TRA-1-81 positive (TRA-1-81+) and TRA-1-81 negative (TRA-1-81−) populations were sequenced (Supplementary Table S1). Using the TRA-1-81− population as a control, shRNA enrichment in the TRA-1-81+ population (which we call the treatment population) was determined. We chose these two screens as test data sets, because both used genome-wide high-complexity libraries, used NGS as readout and performed extensive screen validation assays that we can use to estimate the sensitivity and specificity of hit selection algorithms. RIGER analysis was performed using the RIGER.jar Java archive downloaded from the GENE-E website (http://www.broadinstitute.org/cancer/software/GENE-E/extensions.html). As originally described by Luo et al. (12), this implementation uses a Kolmogorov–Smirnov test for significance assessment. RSA was designed for well-based screens (22), and codes for RSA analysis are available (http://carrier.gnf.org/publications/RSA/). However, the algorithm itself can be adapted to NGS screen readout by replacing well activity level with barcode read count odds ratio. We implemented RSA for NGS readout in MATLAB, using an odds ratio of 1 for the lower-bound parameter and 2 as an upper-bound parameter.
Following their primary screen, Tan et al. (4) validated 135 genes using short interfering RNA (siRNA). Tan et al., having identified ovarian carcinoma subtypes via microarray and clinicopathological parameters, chose these genes with the intention of specifically targeting pathways enriched in the Stem-A subtype. One siRNA was transfected per well in a 96-well plate format. After 96 h of incubation, a colorimetric cell-proliferation assay was performed to quantify siRNA effect on growth. The assay was performed in quadruplicate, and there were two negative-control wells per plate. We compared siRNA-well to control-well proliferation ratios (obtained from the authors) between the HeyA8 and Stem-A populations using single-tailed t-tests, corrected for multiple-hypothesis testing via the Benjamini–Hochberg method (23). We found 65 genes in HeyA8 cells and 47 genes in Stem-A cells with differential negative effect on cell growth at a t-test P-value cutoff of P = 0.05. We then tabulated true-positive (TP), true-negative (TN), false-positive (FP) and false-negative (FN) gene-hit calls for HiTSelect, RIGER and RSA. Hit calls were tabulated in the following fashion: we consider a gene TP if it is ranked within the top 5% of genes in the primary screen of HeyA8 and, in the validation assay, has a mean proliferation ratio which is higher in HeyA8 at a t-test P ≤ 0.05; we call a gene FP if it is enriched in the HeyA8 primary screen but not in the validation assay (P > 0.05). Similarly, if a gene is ranked within the top 5% in the screen of Stem-A and has a higher proliferation ratio in the Stem-A validation with P ≤ 0.05, then it is a TN. If it is enriched in Stem-A's primary screen but fails to validate (P > 0.05), then we call it an FN. Sample sizes were unbalanced in the validation assay (65 genes down in HeyA8 cells versus 47 genes down in Stem-A). We chose the Matthews correlation coefficient as an estimator of an algorithm's predictive value, since it is generally considered to be the most robust estimator of a classifier's success for unbalanced sample sizes (24). We also chose balanced accuracy (BA) as a second measurement of these algorithms’ performance as classifiers. Balanced accuracy  is a renormalized accuracy that avoids overestimation of classifier performance arising when the sample is imbalanced (25).
Lastly, we assembled lists of negative-control genes and positive-control genes for our iPS cell screen and compared their rank distributions between algorithms. In the iPS cell screen, we screened for barriers to reprogramming, i.e. genes whose knockdown enhances reprogramming efficiency. As negative controls, we used the validated targets of known tumor suppressor micro-RNA (miRNA) miR-218 (26), a random gene list and explicit negative-control sequences. As positive control genes, we used a list of 26 barrier genes whose knockdown has been already shown to enhance reprogramming efficiency (Supplementary Table S2). Additionally, we used the experimentally validated targets of miR-17 (whose targets include the tumor suppressor P21) and miR-200 (an inhibitor of the epithelial-to-mesenchymal transition) as positive controls. Both of these miRNA have been shown to enhance reprogramming efficiency (27,28). We also found that HiTSelect outperformed RSA and RIGER on simulated data by computing a Receiver Operating Characteristic curve shown in Supplementary Figure S2.
Single-gene knockdown validation
BJ fibroblasts were seeded on a 6-well plate and infected with lentivirus expressing shRNA the following day. Each shRNA was cloned into a separate pSicoR-CMV-Puro-T2A-GFP lentiviral vector. To make lentivirus, 293T cells at 60–70% confluency were transfected in 10-cm plates with 4 μg of the lentiviral vectors together with 1 μg each of the packaging plasmids VSV-G, MDL-RRE and RSVr using Fugene 6 from Roche. After 72 h, viral supernatants were harvested, filtered, titered and stored at −80°C. Five days after infection, fibroblasts were harvested, and RNA was isolated using the RNeasy Mini RNA Isolation kit (Qiagen) and reverse-transcribed using the High-Capacity cDNA Reverse Transcription kit (Applied BioSystems). The cDNA reaction was diluted 1:5 in TE (10-mM Tris-Cl/1-mM EDTA, pH 7.6) and used in Sybr Green real-time PCR reactions (Applied BioSystems). PCR primers were designed to amplify 100–400-bp fragments spanning exons. Housekeeping genes GAPDH and UBB were used as controls (Supplementary Table S2). Reactions were run in triplicates on a 7900HT machine (Applied BioSystems) according to the manufacturer's instructions. Only samples with single and matching end-point melting curve peaks were used for subsequent analysis. Cycle threshold values were imported into the REST software for fold-change calculations, using the housekeeping genes GAPDH and UBB as controls.
RESULTS
HiTSelect gene ranking outperforms on cancer stem cell and iPS cell shRNA screens
Although RSA and RIGER were not designed for screens with NGS readout, they can be adapted for that purpose. One important insight of the RSA algorithm is the use of a test statistic that is sensitive to the number of distinct active guide-RNA (the hyper-geometric test). Thus, in principle, RSA controls for off-target effects, and it works well for smaller-scale screens on the order of hundreds of wells. However, we find that at the scale of the screens we considered (80 000 and 600 000 shRNA), the hyper-geometric test is not very sensitive. In fact, in both screens, RSA enriches for ‘singletons’, i.e. genes with only one active shRNA. By contrast, HiTSelect preferentially ranks genes for which the effect of knockdown is reproducible across multiple shRNA (Figure 2A and B). Compared to HiTSelect, RSA's predictions for the primary screen of Tan et al. do not correlate as well with the results of their siRNA validation assay (Figure 2C). In comparing HiTSelect to RSA and RIGER in our iPS cell screen, we found that the upper-quartiles of the HiTSelect and RIGER gene rankings were enriched for positive-control genes to a statistically significant extent (hypergeometric tests: 3.3 × 10⁻⁵ ≤ P ≤ 2.4 × 10⁻³), indicating good sensitivity in hit detection (Figure 2D). However, RSA was not very sensitive and did not rank positive control genes highly (0.17 ≤ P ≤ 0.7). While neither HiTSelect nor RSA frequently ranked negative-control genes in the upper quartile range (0.16 ≤ P ≤ 0.68), RIGER ranks control sequences highly (P = 1.5 × 10⁻²). Thus, RIGER's false-positive rate is high for some samples. RIGER also enriches for singletons (Figure 2A and B), and RIGER has the least correlation between the primary screen and the siRNA validation assay of Tan et al. (Figure 2C). Furthermore, RIGER ranks negative control sequences highly in our iPS cell screen (Figure 2D), indicating that RIGER's FDR is high. Figure 2E shows the overlap of the three algorithms.
Figure 2.
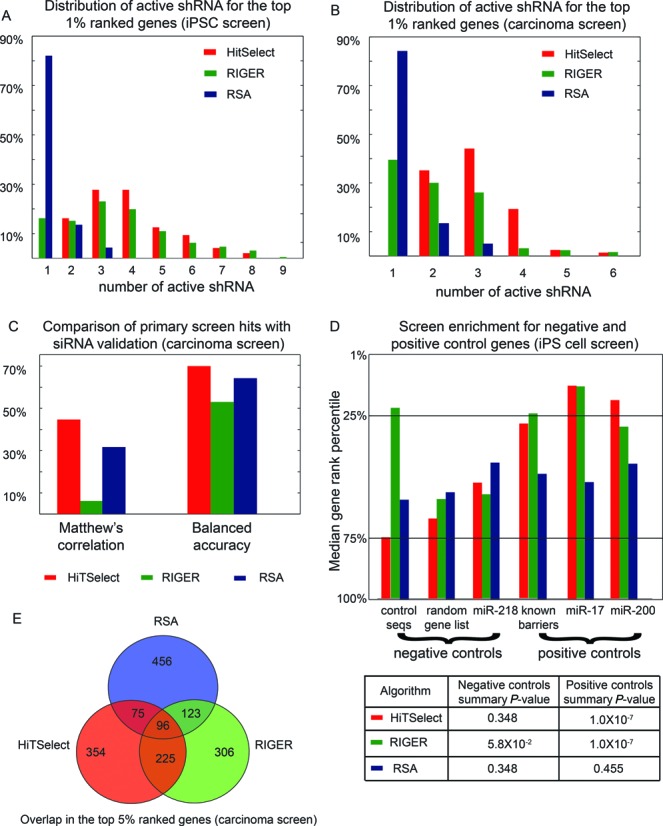
A comparison of HiTSelect with the RSA and RIGER algorithms for sensitivity, specificity and off-target effects. (A) The distribution of the numbers of active shRNA for genes ranked in the top 1% by each algorithm in the iPS cell screen. While RSA and RIGER enrich for genes with only one supporting shRNA, all of HiTSelect's genes have two or more active shRNA as redundant evidence of effect. (B) The distribution of the numbers of active shRNA for genes ranked in the top 1% by each algorithm in the ovarian carcinoma screen of Tan et al. Only HiTSelect has multiple active shRNA for all top genes. Thus, HiTSelect is more robust to off-target effects. (C) HiTSelect's primary screen predictions from the data of Tan et al. correlate better with the results of their downstream siRNA validation assay. (D) Rankings for genes from positive and negative control gene lists in the iPS cell screen were tabulated and their distributions are compared among the HiTSelect, RSA and RIGER algorithms. A list of known gene barriers to reprogramming as well as the validated targets of micro-RNA known to enhance reprogramming were used as positive controls. A random gene list, control sequences and the validated targets of miR-218 (a known tumor suppressor) were used as negative controls (Supplementary Table S2). The medians of the rank distributions of these genes are shown. While HiTSelect and RIGER both enrich for positive control genes, RSA does not. This indicates that RSA may lack sensitivity on some data sets. On the other hand, RIGER shows significant enrichment for negative control sequences, while HiTSelect and RSA do not. This may point to a high false positive rate in RIGER for some samples. (E) Overlap between the top 5% gene hits ranked by HiTSelect, RSA and RIGER in the screen of Tan et al.
In a typical workflow, a researcher may first call hits at the 5% level, in order to have a large enough sample to perform functional annotation clustering and gene network analysis. After obtaining relevant pathways, one may then choose genes from those pathways for validation using a more stringent threshold, such as 1%. At this threshold, the distributions of the number of active guide-RNA are shifted to the left for RSA and RIGER compared to HiTSelect in both screens. In particular, RSA and RIGER preferentially rank singletons in the top 1%. HiTSelect's top 1% ranked genes all have at least two (and most have three or more) active shRNA. Thus, HiTSelect is less prone to off-target effects since, for all genes ranked in the top 1%, the effect of knockdown is reproducible over multiple guide-RNA. To compare the impact of off-target effects on hit selection of the three algorithms, we spot-checked a handful of gene hits for ineffective shRNA and also employed the software GESS (29) to identify off-targets attributable to ‘seed effects’. Firstly, we identified the seven most highly ranked singleton genes that were mutually ranked in the top 1% by RIGER and RSA in our iPS cell screen. None of HiTSelect's top 1% are singletons. We measured the knockdown efficiency of the single active shRNA for each singleton gene via reverse transcription quantitative real-time polymerase chain reaction (RT-qPCR), comparing the effect of RNAi to that of a nonsense-sequence control. We then compared these knockdown effect sizes to those observed in knockdown experiments of genes identified in the top 1% by HiTSelect. All of HiTSelect's top 1% hits have at least two active shRNA, and we performed knockdowns using the two most active shRNA (identified by HiTSelect) separately and averaged the results. All knockdowns were performed in human fibroblasts. The median knockdown efficiency was slightly greater in HiTSelect's picks (log2 fold-change = −2) than in the RSA/RIGER singletons (log2 fold-change = −1.8), and two of the seven RSA/RIGER singletons did not show significant knockdown efficiency (<2-fold change compared with nonsense-sequence control) (Figure 3A). To explore whether this 29% off-target rate observed in the RSA/RIGER hits was an artifact of the small sample size used, we computed the ‘seed-match frequencies’ for the top iPS cell screen hits using GESS. GESS identifies shRNAs that may exhibit off-target effects by computing the frequency with which the seed sequences in those shRNAs match known transcripts in a database. GESS produces Benjamini–Hochberg-corrected P-values for seed-match frequency (SMF). We ran GESS on the top 1% hits for RSA, RIGER and HiTSelect, using the bottom 1% as negative controls. GESS did not report any HiTSelect hit to have a statistically significant SMF at the GESS P-value cutoff of 0.05. However, 17% of shRNA from RIGER and 35% of shRNA from RSA show a statistically significant SMF (Figure 3B). Taken together, these findings show that HiTSelect is less prone to off-target effects than RSA or RIGER.
Figure 3.

Validation of knockdown for singleton genes highly ranked by RSA and RIGER. (A) RSA and RIGER enriched for genes with only one active shRNA in both the carcinoma screen of Tan et al. and in our iPS cell screen. In contrast to these methods, all of HiTSelect's top genes demonstrate a robust effect over at least two shRNA. To validate that this phenomenon leaves RSA and RIGER prone to off-target effects, we performed knockdowns in human fibroblasts for the top seven ranked genes that were ranked in the 1% by both RSA and RIGER and that were also singletons. The ranking was relative to the iPS cell screen. Using the single shRNA identified by their algorithms per gene, we were able to produce a knockdown greater than 2-fold for only five out of seven genes. In contrast, all of HiTSelect's genes identified in the top 1% had at least two active shRNA which produced a knockdown of greater than 2-fold. (B) GESS analysis to identify shRNAs that may exhibit off-target effects due to homology between their seed sequences and unintended gene targets. GESS compared the seed-match frequency (SMF) of shRNAs targeting the top 1% gene hits of our iPS screen (phenotype) to those targeting the bottom 1% ranked genes (no-phenotype). GESS did not find any HiTSelect hits with statistically significant off-target effects at the GESS (Benjamini–Hochberg corrected) P-value cutoff of 0.05. However, 17% of shRNA from RIGER and 35% of shRNA from RSA showed statistically significant off-target effects.
HiTSelect provides an integrative analysis suite with visualization tools
While a good ranking algorithm is a prerequisite for robust screen analysis, identifying key pathways also requires going beyond the statistical significance of individual genes and integrating relevant metadata. To this end, we developed modules to automate data aggregation, calculate statistics for data synthesis and visualize the data and results. HiTSelect's visualization module allows the user to seamlessly browse and search screen results (Supplementary Figure S3A). Genes of interest can be annotated with user-defined gene lists, which can then be exported to a delimiter-separated file or analyzed with other HiTSelect modules. For example, HiTSelect's functional annotation module interfaces programmatically with DAVID (30) to generate reports presented as interactive visualizations (Supplementary Figure S3B). An example, obtained from clustering the functional annotations of the iPS cell screen hits, is available online: http://song.igb.illinois.edu/ipsScreen/docs/david_treemap.html. HiTSelect's gene network analysis module interfaces with GeneMANIA (http://www.genemania.org), which contains annotations for genetic interactions, physical interactions and tissue co-localization of expression data aggregated from public databases. As a summary statistic for GeneMANIA output, we developed the concept of joint-network centrality. Joint-network centrality generalizes eigenvalue network centrality to multiple networks defined on the same set of genes. Lastly, we developed a Cytoscape interface module to visualize screen hit network interactions with an overlay of metadata from the above modules. Together, these modules provide a powerful and user-friendly system for screen analysis.
HiTSelect is suitable for both shRNA and CRISPR-mediated screens
To demonstrate the versatility of our approach, we use HiTSelect to analyze four screens recently performed via CRISPR knockout and reported by two separate groups (8,31). Wang et al. (8) screened for genes necessary for survival in HL60 and KBM7 cells expressing Cas9 nuclease. Cell populations were infected with barcoded lentivirus expressing a library of 73 151 sgRNA, targeting 7114 genes. After an incubation period of 12 cell doublings, barcodes were recovered via PCR and sequenced. We analyzed these screens’ data using HiTSelect and identified the top 5% of genes most under-represented after the incubation period (Figure 4A and B, left panel). We found that while HiTSelect and RIGER agreed better in the shRNA screen of Tan et al. (4) (Figure 2E), HiTSelect overlapped better with RSA in the CRISPR screen of Wang et al. (8) (Supplementary Figure S4C). Using a combination of HiTSelect's network analysis module and the MCODE plugin to Cytoscape (32), we then studied interactions between screen hit genes. Strikingly, both screens reproduced four sub-networks comprised of genes associated with the ribosomal, proteasomal, DNA replication and transcription pathways (Figure 4A and B, right panel). Moreover, in both screens, the joint-network centrality metric is elevated in the ribosome sub-network cluster, i.e. the median joint-network centrality across genes in the ribosomal sub-network is at the 97th percentile of the distribution of joint-network centrality scores network wide. This result is consistent with Wang et al., who also observed a depletion of sgRNA targeting ribosomal proteins. Although Wang et al. also identified enrichment for ribosomal, proteasomal and DNA replication genes, the sub-network of transcription-related genes, which contains mediator complex components and other genes essential for cell survival, was not reported to be statistically significant. Also not previously reported, but enriched in our HiTSelect analysis, are the clusters of genes that are known to be essential for cell survival: cell cycle genes (e.g. components of the anaphase-promoting complex and cyclin-dependent kinases), components of the cytoskeleton and elements of the ubiquitination pathway (Figure 4C). Identification of these additional, essential pathways further validates the sensitivity of HiTSelect.
Figure 4.
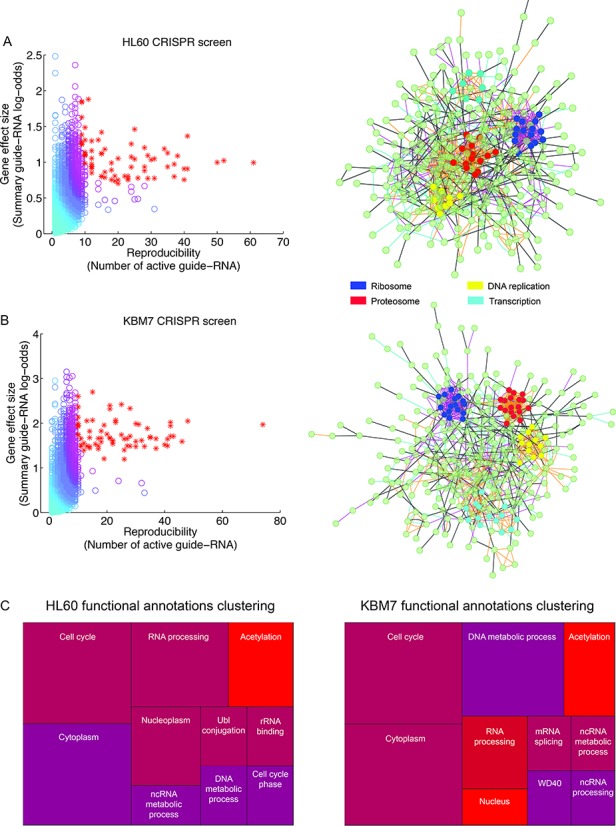
HiTSelect analysis of CRISPR-mediated negative selection screens in HL60 and KBM7 cells, respectively. Genes ranked in the top 5% by HiTSelect's gene ranking algorithm (A, B: left panels) are enriched for functional annotations for fundamental biological processes, such as transcription, translation, DNA replication and cell cycle (C). These annotations were discovered using HiTSelect's functional annotation analysis module. In both screens, analysis using a combination of HiTSelect's gene-interaction module and MCODE identifies dense clusters of genes associated with the ribosome, proteasome, DNA replication and transcription. In particular, the median joint-network centrality for genes in the ribosome sub-network is in the 97th percentile of joint-network centrality scores overall.
Likewise, Zhou et al. (31) created a library of 873 sgRNA targeting 291 genes. Two screens were then performed in OCT1 and Cas9 expressing HeLa cells (HeLaOC) to identify genes necessary for intoxication by chimeric anthrax (PA/LFnDTA) and diphtheria toxin (DT). HeLaOC cells were infected with barcoded lentivirus expressing the aforementioned sgRNA library and then treated with each toxin. The treatment was followed by PCR amplification and sequencing of the vectors’ barcodes in surviving cells. We analyzed these screens using HiTSelect and identified 14 and 16 genes with a non-zero effect size (log-odds>0) in the PA/LFnDTA and DT screens, respectively (Supplementary Figure S4A and B). All seven of the genes validated by Zhou et al. (via a cell viability assay) were identified in HiTSelect's picks. In particular, anthrax receptor (ANTXR1) and diphtheria toxin receptor (HBEGF) were the number 1 genes in HiTSelect's ranking of the PA/LFnDTA and DT screens, respectively. Moreover, knockout of these two genes in Zhou et al.'s validation assay produced the greatest increases in cell viability over control, following treatment with PA/LFnDTA or DT, respectively. Due to the small number of gene hits in the screens of Zhou et al. (14–16 genes), DAVID did not identify any over-represented functional annotation terms, and GeneMANIA also did not identify significant interactions among these genes, limiting our re-analysis of the screens. HiTSelect thus provides a rigorous analysis method for selecting hits that correlate well with validation. In addition to these cell-surface receptors, HiTSelect also identifies adenosine triphosphate (ATP) binding proteins in the PA/LFnDTA screen: CFTR and PECR. PECR knockout was validated by Zhou et al. as conferring resistance to PA/LFnDTA, but CFTR was not. Another bacterial toxin, cholera toxin, induces the secretion of intestinal fluid via CFTR upregulation (in an ATP-mediated fashion); thus, HiTSelect revealed that the role of CFTR in anthrax toxicity is a potential avenue for further investigation (33).
DISCUSSION
High-throughput, genome-wide screening is a powerful technique to identify genes and pathways regulating a phenotype of interest. However, statistical approaches designed for smaller-scale screens, performed at low throughput in multi-well plates and/or screens using microarrays as readout, do not completely control for variation in knockdown/knockout efficiency or variation in sequencing depth-of-coverage. Thus, analysis techniques that are robust to these random effects are currently lacking. Moreover, there are no bioinformatics tools available to perform integrative analysis of screen metadata. To address these needs, we have developed HiTSelect. In addition to providing a rigorous hit selection method that compares very favorably with existing approaches, HiTSelect is a comprehensive tool with gene network analysis, gene ontology analysis and visualization modules. HiTSelect is free, open source and available as a stand-alone software package for Windows, MacOS and Linux. As exemplified by the algorithm comparisons and data analyses reported here, HiTSelect is expected to enable a high degree of confidence in the interpretation of genome-wide screen data and maximize the depth of biological insights arising from these kinds of screens.
SUPPLEMENTARY DATA
Supplementary Data are available at NAR Online.
Footnotes
The authors wish it to be known that, in their opinion, the first two authors should be regarded as Joint First Authors.
Present address: Jun S. Song, Departments of Bioengineering and Physics, University of Illinois, Urbana-Champaign, Urbana, IL, USA
FUNDING
CIRM [RB4-06028 to M.R.-S.]; National Institutes of Health (NIH) Director's New Innovator Award [DP2OD4698 to M.R.-S.]; Sontag Foundation Distinguished Scientist Award [to J.S.S.]; NIH [R01CA163336 to J.S.S.]. Funding for open access charge: NIH [R01CA163336].
Conflict of interest statement. None declared.
REFERENCES
- 1.Dompe N., Rivers C.S., Li L., Cordes S., Schwickart M., Punnoose E.a., Amler L., Seshagiri S., Tang J., Modrusan Z., et al. A whole-genome RNAi screen identifies an 8q22 gene cluster that inhibits death receptor-mediated apoptosis. Proc. Natl Acad. Sci. U.S.A. 2011;108:E943–E951. doi: 10.1073/pnas.1100132108. [DOI] [PMC free article] [PubMed] [Google Scholar]
- 2.Possemato R., Marks K.M., Shaul Y.D., Pacold M.E., Kim D., Birsoy K., Sethumadhavan S., Woo H.-K., Jang H.G., Jha A.K., et al. Functional genomics reveal that the serine synthesis pathway is essential in breast cancer. Nature. 2011;476:346–350. doi: 10.1038/nature10350. [DOI] [PMC free article] [PubMed] [Google Scholar]
- 3.Schlabach M.R., Luo J., Solimini N.L., Hu G., Xu Q., Li M.Z., Zhao Z., Smogorzewska A., Sowa M.E., Ang X.L., et al. Cancer proliferation gene discovery through functional genomics. Science. 2008;319:620–624. doi: 10.1126/science.1149200. [DOI] [PMC free article] [PubMed] [Google Scholar]
- 4.Tan T.Z., Miow Q.H., Huang R.Y.-J., Wong M.K., Ye J., Lau J.A., Wu M.C., Bin Abdul Hadi L.H., Soong R., Choolani M., et al. Functional genomics identifies five distinct molecular subtypes with clinical relevance and pathways for growth control in epithelial ovarian cancer. EMBO Mol. Med. 2013;5:983–998. doi: 10.1002/emmm.201201823. [DOI] [PMC free article] [PubMed] [Google Scholar]
- 5.Bassik M.C., Kampmann M., Lebbink R.J., Wang S., Hein M.Y., Poser I., Weibezahn J., Horlbeck M.a., Chen S., Mann M., et al. A systematic mammalian genetic interaction map reveals pathways underlying ricin susceptibility. Cell. 2013;152:909–922. doi: 10.1016/j.cell.2013.01.030. [DOI] [PMC free article] [PubMed] [Google Scholar]
- 6.Van de Weijer M.L., Bassik M.C., Luteijn R.D., Voorburg C.M., Lohuis M.aM., Kremmer E., Hoeben R.C., Leproust E.M., Chen S., Hoelen H., et al. A high-coverage shRNA screen identifies TMEM129 as an E3 ligase involved in ER-associated protein degradation. Nat. Commun. 2014;5:3832–3845. doi: 10.1038/ncomms4832. [DOI] [PMC free article] [PubMed] [Google Scholar]
- 7.Qin H., Diaz A., Blouin L., Lebbink R.J., Patena W., Tanbun P., LeProust E.M., McManus M.T., Song J.S., Ramalho-Santos M. Systematic Identification of Barriers to Human iPSC Generation. Cell. 2014;158:449–461. doi: 10.1016/j.cell.2014.05.040. [DOI] [PMC free article] [PubMed] [Google Scholar]
- 8.Wang T., Wei J.J., Sabatini D.M., Lander E.S. Genetic screens in human cells using the CRISPR-Cas9 system. Science. 2014;343:80–84. doi: 10.1126/science.1246981. [DOI] [PMC free article] [PubMed] [Google Scholar]
- 9.Shalem O., Sanjana N.E., Hartenian E., Shi X., Scott D.a, Mikkelsen T.S., Heckl D., Ebert B.L., Root D.E., Doench J.G., et al. Genome-scale CRISPR-Cas9 knockout screening in human cells. Science. 2014;343:84–87. doi: 10.1126/science.1247005. [DOI] [PMC free article] [PubMed] [Google Scholar]
- 10.Rusk N. Genetics: mammalian genes interacting. Nat. Methods. 2013;10:281–281. doi: 10.1038/nmeth.2424. [DOI] [PubMed] [Google Scholar]
- 11.König R., Chiang C., Tu B.P., Yan S.F., DeJesus P.D., Romero A., Bergauer T., Orth A., Krueger U., Zhou Y., et al. A probability-based approach for the analysis of large-scale RNAi screens. Nat. Methods. 2007;4:847–849. doi: 10.1038/nmeth1089. [DOI] [PubMed] [Google Scholar]
- 12.Luo B., Cheung H.W., Subramanian A., Sharifnia T., Okamoto M., Yang X., Hinkle G., Boehm J.S., Beroukhim R., Weir B.a., et al. Highly parallel identification of essential genes in cancer cells. Proc. Natl Acad. Sci. U.S.A. 2008;105:20380–20385. doi: 10.1073/pnas.0810485105. [DOI] [PMC free article] [PubMed] [Google Scholar]
- 13.Cochran W. The combination of estimates from different experiments. Biometrics. 1954;10:101–129. [Google Scholar]
- 14.DerSimonian R., Laird N. Meta-analysis in clinical trials. Control. Clin. Trials. 1986;7:177–188. doi: 10.1016/0197-2456(86)90046-2. [DOI] [PubMed] [Google Scholar]
- 15.Fieldsend J. Multi-objective optimisation in the presence of uncertainty. Evol. Comput. 2005. 2005;1:243–250. [Google Scholar]
- 16.Hughes E. Proceedings of the First International Conference on Evolutionary Multi-Criterion Optimization. Berlin: Springer-Verlag; 2001. Evolutionary multi-objective ranking with uncertainty and noise; pp. 329–343. [Google Scholar]
- 17.Haight F.A. Handbook of the Poisson Distribution. NY: John Wiley & Sons, Inc.; 1967. [Google Scholar]
- 18.Thode H.C. Power and sample size requirements for tests of differences between two Poisson rates. J. R. Stat. Soc. D Stat. 1997;46:227–230. [Google Scholar]
- 19.Detre C.W.K. The comparison of two Poisson-distributed observations. Biometrics. 1970;26:851–854. [Google Scholar]
- 20.Anscombe F. The transformation of Poisson, binomial and negative-binomial data. Biometrika. 1948;35:246–254. [Google Scholar]
- 21.Bonacich P. Factoring and weighting approaches to status scores and clique identification. J. Math. Sociol. 1972;2:113–120. [Google Scholar]
- 22.Chiang C., Tu B.P., Ko R., Yan S.F., Dejesus P.D., Romero A., Bergauer T., Orth A., Krueger U., Zhou Y., et al. A probability-based approach for the analysis of large-scale RNAi screens. Nat. Methods. 2007;4:847–849. doi: 10.1038/nmeth1089. [DOI] [PubMed] [Google Scholar]
- 23.Benjamini Y., Hochberg Y. Controlling the false discovery rate: a practical and powerful approach to multiple testing. J. R. Stat. Soc. B Methodol. 1995;57:289–300. [Google Scholar]
- 24.Jurman G., Riccadonna S., Furlanello C. A comparison of MCC and CEN error measures in multi-class prediction. PLoS One. 2012;7:e41882. doi: 10.1371/journal.pone.0041882. [DOI] [PMC free article] [PubMed] [Google Scholar]
- 25.Brodersen K.H., Ong C.S., Stephan K.E., Buhmann J.M. Proceedings of the 20th International Conference on Pattern Recognition. Istanbul: IEEE Conference; 2010. The balanced accuracy and its posterior distribution; pp. 3121–3124. [Google Scholar]
- 26.Uesugi A., Kozaki K.-I., Tsuruta T., Furuta M., Morita K.-I., Imoto I., Omura K., Inazawa J. The tumor suppressive microRNA miR-218 targets the mTOR component Rictor and inhibits AKT phosphorylation in oral cancer. Cancer Res. 2011;71:5765–5778. doi: 10.1158/0008-5472.CAN-11-0368. [DOI] [PubMed] [Google Scholar]
- 27.Li Z., Yang C.-S., Nakashima K., Rana T.M. Small RNA-mediated regulation of iPS cell generation. EMBO J. 2011;30:823–834. doi: 10.1038/emboj.2011.2. [DOI] [PMC free article] [PubMed] [Google Scholar]
- 28.Gregory P.a, Bert A.G., Paterson E.L., Barry S.C., Tsykin A., Farshid G., Vadas M.a, Khew-Goodall Y., Goodall G.J. The miR-200 family and miR-205 regulate epithelial to mesenchymal transition by targeting ZEB1 and SIP1. Nat. Cell Biol. 2008;10:593–601. doi: 10.1038/ncb1722. [DOI] [PubMed] [Google Scholar]
- 29.Sigoillot F.D., Lyman S., Huckins J.F., Adamson B., Chung E., Quattrochi B., King R.W. A bioinformatics method identifies prominent off-targeted transcripts in RNAi screens. Nat. Methods. 2012;9:363–366. doi: 10.1038/nmeth.1898. [DOI] [PMC free article] [PubMed] [Google Scholar]
- 30.Jiao X., Sherman B.T., Huang D.W., Stephens R., Baseler M.W., Lane H.C., Lempicki R.a. DAVID-WS: a stateful web service to facilitate gene/protein list analysis. Bioinformatics. 2012;28:1805–1806. doi: 10.1093/bioinformatics/bts251. [DOI] [PMC free article] [PubMed] [Google Scholar]
- 31.Zhou Y., Zhu S., Cai C., Yuan P., Li C., Huang Y., Wei W. High-throughput screening of a CRISPR/Cas9 library for functional genomics in human cells. Nature. 2014;509:487–491. doi: 10.1038/nature13166. [DOI] [PubMed] [Google Scholar]
- 32.Bader G., Hogue C. An automated method for finding molecular complexes in large protein interaction networks. BMC Bioinformatics. 2003;27:1–27. doi: 10.1186/1471-2105-4-2. [DOI] [PMC free article] [PubMed] [Google Scholar]
- 33.Liu S., Moayeri M., Leppla S.H. Anthrax lethal and edema toxins in anthrax pathogenesis. Trends Microbiol. 2014;22:317–325. doi: 10.1016/j.tim.2014.02.012. [DOI] [PMC free article] [PubMed] [Google Scholar]
Associated Data
This section collects any data citations, data availability statements, or supplementary materials included in this article.