


Abstract
Genomic structural variation (SV), a common hallmark of cancer, has important predictive and therapeutic implications. However, accurately detecting SV using high-throughput sequencing data remains challenging, especially for ‘targeted’ resequencing efforts. This is critically important in the clinical setting where targeted resequencing is frequently being applied to rapidly assess clinically actionable mutations in tumor biopsies in a cost-effective manner. We present BreaKmer, a novel approach that uses a ‘kmer’ strategy to assemble misaligned sequence reads for predicting insertions, deletions, inversions, tandem duplications and translocations at base-pair resolution in targeted resequencing data. Variants are predicted by realigning an assembled consensus sequence created from sequence reads that were abnormally aligned to the reference genome. Using targeted resequencing data from tumor specimens with orthogonally validated SV, non-tumor samples and whole-genome sequencing data, BreaKmer had a 97.4% overall sensitivity for known events and predicted 17 positively validated, novel variants. Relative to four publically available algorithms, BreaKmer detected SV with increased sensitivity and limited calls in non-tumor samples, key features for variant analysis of tumor specimens in both the clinical and research settings.
INTRODUCTION
Genomic structural variations (SVs) are frequently observed in cancer and consist of insertions/deletions (indels), larger genomic copy losses or gains and/or intra- and inter-chromosomal rearrangements (1). SV can have implications in treatment and disease outcome (2,3). Indeed, several clinically relevant diagnostic and treatment modalities are based on these events (4,5), including the therapeutic targeting of EML4-ALK fusion protein in adenocarcinoma, the BCR-ABL fusion protein in chronic myelogenous leukemia, FLT3 internal tandem duplications (ITDs) in acute myeloid leukemia (AML) and others (6–10). Thus, rapidly identifying somatic SV in the clinic is important for both diagnosis and treatment guidance.
Conventional cytogenetic studies and molecular-based technologies are available to detect SV in both the clinical and research settings (11). These include karyotype analysis to identify chromosomal abnormalities, fluorescence in situ hybridization (12) (FISH) for translocation and copy number analysis, polymerase chain reaction (PCR) or reverse-transcription-PCR (RT-PCR) for the detection of known genomic translocations or fusion transcripts and immunohistochemistry to detect antigens that may be the result of genomic alterations (13). However, none of these technologies are comprehensive, and often multiple methods must be employed to obtain reliable diagnostic results (14). A faster, more sensitive method for identifying somatic SV at a high-resolution would be of considerable value.
Massively parallel DNA sequencing (MPS) technology has reduced scalability, cost, speed and resolution barriers for genomic analysis. MPS has significantly impacted the clinical setting by facilitating rapid molecular tumor profiling for diagnostic and therapeutic decisions (15,16). Sequencing selective genomic regions is substantially more cost effective than whole-genome sequencing considering that virtually all of the ‘actionable’ genomic alterations occur in protein coding regions, which constitute ∼1% of the human genome. Hybrid selection-based techniques are routinely being used to interrogate the whole exome (17,18), which is ∼10-fold less expensive than whole-genome sequence (WGS) (19), and further reduction in the number of genomic regions targeted (e.g. cancer-specific panels) equates to greater cost savings and the ability to immensely increase sample throughput and read depth for increased somatic event detection (20); however, there is a paucity of methodologies to accommodate SV analysis from targeted sequencing data.
Current methods typically apply read depth and misalignment information from reference-mapped sequence reads to identify SV (21–23) and indels (24,25) with sizes extending beyond the detection limits of current indel callers (26). Detection algorithms identify patterns from the misalignment features that deviate from expectation, such as partially aligned or ‘split’ reads (SR) and ‘discordantly mapped’ paired-end reads with unmapped mates or reads aligned with unexpected orientations or insert sizes (21). Nearly all of the current detection methods have been aimed toward analyzing WGS-based data, where the designs to extract the SV signal appropriately account for the specific characteristics of the sequencing data, such as read length and insert size. With conventional WGS libraries consisting of paired-end or mate-pair libraries with insert sizes larger than 300 bp and read lengths less than 100 bp, the initial methods focused on using discordantly mapped read pairs because these contained most of the SV signal in the data. As read lengths increased and provided more direct coverage at SV breakpoint locations, techniques began incorporating the SR information generated at these locations by the aligners, often as a secondary signal or just to resolve the breakpoint locations.
For targeted sequencing of hybrid-captured tumor DNA, there are numerous differences to conventional WGS data with considerable impacts to sources of SV signal. Discordantly mapped read pairs become limited as a primary signal due to the expected use of libraries with smaller insert sizes (< = 250 bp) required for formalin-fixed paraffin embedded (FFPE) samples, which are typical for cancer specimens. The discordantly mapped read pair evidence may be further limited due to the design of the targeted panel, which may only target and provide coverage for one of the breakpoint locations in an SV event. The use of SRs becomes more relevant with this type of data as the targeted design aims to directly capture and sequence reads spanning certain breakpoint locations and longer read sequences (> = 100 bp) provide ample information. Available methods that exclusively use SRs (e.g. 27) or jointly consider SRs and discordantly mapped read pairs (e.g. 28–30) can be trivially applied to the targeted sequence data, yet treatment of the soft-clipped sequences in the SV detection process for these remains limited. Current strategies using soft-clipped sequences for primary signal information involve remapping and clustering (e.g. 28,29), assembling with co-located soft-clipped sequences and then remapping (e.g. 27), or relying on nearby discordantly mapped read pairs rather than remapping (e.g. 30). The first strategy is limited by the ability to reliably remap short soft-clip sequences and by the exclusion of soft-clipped sequences that are too short to map. The second strategy is limited by only being able to create an assembly using soft-clipped sequences aligned at a single position and not include other reads, such as unmapped reads with mapped mates. Both methods only using the soft-clipped sequence, or assembly of these, to remap, which may not be optimal when relevant microhomology sequence may exist in the neighboring non-clipped sequences that could be used for improved remapping. The third strategy relies on the existence of discordantly mapped read pairs. Beyond these limitations, none of these methods are designed to algorithmically leverage the design or properties of the targeted data to improve the calling. Furthermore, the generation of many artifact calls from experimental data likely due to PCR, sequencing and/or alignment errors is a prohibitive barrier to the usage of existing methods.
Here, we have developed ‘BreaKmer’, a novel method to detect SV in targeted MPS data. BreaKmer identifies SV and nucleotide-level breakpoints using the realignment of variant contigs built from assembling all the misaligned reads (i.e. soft-clipped or unmapped reads) in a targeted region. A key feature in BreaKmer's method is analyzing the defined target regions independently, providing a reduced search space and ability to perform an assembly process that optimally uses all of the relevant misaligned sequences to build a comprehensive variant contig. Three additional innovations in BreaKmer are the implemented assembly strategy using subsequences (‘kmers’) of the misaligned sequences to build the variant contigs, the SV calling procedure from the realignment of the contigs to reference and the incorporation of discordantly mapped paired reads for candidate calls. Currently, it is the only tool that calls SV along with breakpoint locations using a single assembly procedure that takes into consideration all misaligned sequences in a user-defined region. We applied our method to targeted and WGS paired-end MPS data from 122 tumor and non-tumor samples, a subset of which had known translocation events based on orthogonal clinical tests. BreaKmer yielded a high sensitivity rate of 97.4% for validated events and a positive predictive value of 77.3% for novel events. Comparative to three publically available SV calling tools, BreaKmer achieved higher sensitivity in calling SV in the cancer specimen's targeted sequencing data while calling few SV in the non-tumor samples, suggesting a low false-positive rate. These are important features in both the clinical and research settings.
MATERIALS AND METHODS
Here we present the BreaKmer algorithm, which uniquely combines defined target regions with an assembly and realignment strategy to identify SV in individual samples. The algorithm is designed to independently analyze target sequenced regions, providing a reduced SV detection search space relative to a whole chromosome or genome. BreaKmer uses the reduced search space to apply a solution that comprehensively assesses the misaligned sequences of the reads in each region by first assembling them into contiguous sequences and secondly determining if the assembled sequences contain SV based on realignment to a reference sequence. To enhance the SV calling and filtering, the discordantly mapped read pairs in each region are also extracted and applied to any corresponding SV. By jointly considering all of the misaligned reads in a region for a single assembly, this strategy uses all the available sequence information to create the longest and most accurate variant contigs that may span SV breakpoints, as opposed to using multiple assemblies for clusters of SRs at different positions, such as CREST (27). To efficiently assemble all misaligned read sequences in a region jointly, the assembly implementation uses ‘kmers’ to filter, rank and select reads to assemble using a greedy assembly approach. The implementation focuses on building all possible contigs, particularly those containing low-frequency variants with minimal read support. The BreaKmer strategy is outlined in Figure 1A.
Figure 1.
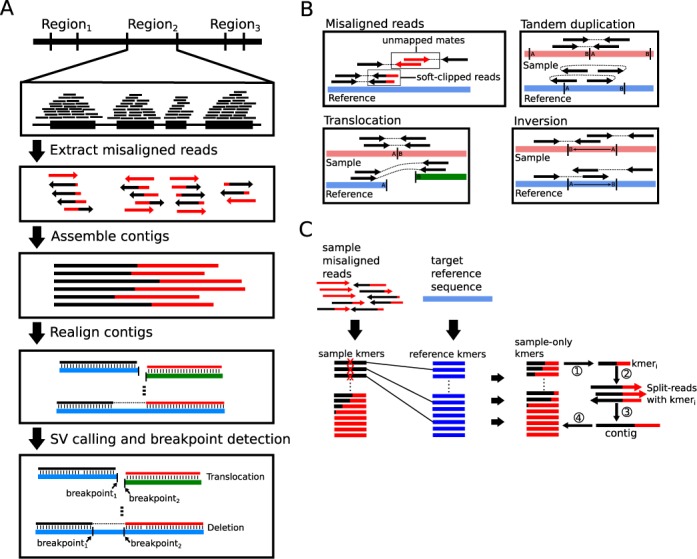
(A) Algorithm workflow for a given target region. (B) Illustration of reads with ‘misaligned’ sequences that are soft-clipped by the alignment tool or paired-end reads with unmapped mates are extracted to use for building contigs. The locations of the discordantly mapped paired-end reads with signatures suggestive of inversions, tandem duplications and translocations are stored and used for downstream analysis and filtering. (C) BreaKmer assembly process using the kmer subtraction procedure to iteratively build contigs.
Read extraction and cleaning
For an individual sample, BreaKmer analyzes sequenced reads aligned to a reference genome and formatted in a binary alignment format file (BAM). For a defined target region containing aligned reads, the algorithm first extracts non-duplicated ‘misaligned’ reads including SRs, reads that have been partially aligned to the reference (i.e. ‘soft-clipped’) and unmapped reads with a mapped mate (Figure 1B). Adapter and poor quality (Phred quality < = 2) sequences that exist in the extracted reads are removed using cutadapt (https://code.google.com/p/cutadapt). Additionally, alignment positions of the discordantly mapped read pairs (DRs), or read pairs that are mapped to different chromosomes or with insert sizes greater than 1 kilobase (kb), are stored for evidence in downstream filtering and reporting of translocations. Read pairs aligned on the same strands (forward–forward or reverse–reverse) or out-of-order (reverse–forward) are stored for inversion and tandem duplication evidence, respectively (Figure 1B).
Contig assembly
For the extracted and cleaned sample reads, a ‘kmer’ subtraction from reference is performed (Figure 1C). Specifically, all possible k-length DNA strings, or kmers, from a sample's extracted sequence reads are enumerated. The same procedure is completed with the reference sequence from the corresponding target being analyzed. The kmers that only exist within the sample set are retained for the assembly.
The iterative assembly process begins with a seed kmer that is used to retrieve the reads containing the kmer in their sequences (Figure 1C). For the retrieved reads, the first read is used to establish the initial contig sequence, and the subsequent reads with sequences that overlap the contig sequence are merged to extend the contig. Any sequences that do not have an overlapping sequence with 90% homology to the contig are cached for assembly with other potential contigs. After the initial contig is assembled, additional sample-specific kmers within the retrieved read(s) are used to recruit additional reads in which they are contained to further extend the contig. The process continues until all kmers have been assembled into a contig.
Contig re-alignment and SV calling
The workflow for re-alignment, calling and filtering SV is displayed in Supplementary Figure S1. Each contig assembled with the specified minimum number of reads (default of 2) is aligned against the target region reference sequence using BLAT (31). The initial alignment to the target reference sequence determines if a contig contains an ‘insertion’ or ‘deletion’. The BLAT results are processed and it is determined whether there is an indel event and whether the blat results pass indel filters (see Supplemental Methods). If a BLAT result is determined to have an indel event but fails to pass the filters nothing is called. If the BLAT result does not have an indel event, the contig is then aligned against the whole reference genome. Calling proceeds if there are at least two results stored and at least one of the results is within the target region being analyzed. Based on the stored BLAT results, an intra- or inter-chromosomal rearrangement is called. The intra-chromosomal rearrangements can be further defined as inversions or tandem duplications. These are classified based on the ‘misalignment’ signatures that exist from both the re-alignment results and the discordantly mapped paired-end reads that support the event. Called rearrangement events are subject to specific filters. These filters include criteria that consider the amount of read support assembled at the inferred breakpoints in the contig and from discordantly mapped read pairs as well as metrics assessing the realignment, such as the minimum length of the BLAT aligned segments and alignment within low-complexity or simple repeat regions (see Supplemental Methods).
Verification of BreaKmer-identified SVs and indels
To confirm novel insertions and deletions identified by BreaKmer we employed Sanger sequencing. Oligonucleotide primers were designed using Primer3 (http://biotools.umassmed.edu/bioapps/primer3_www.cgi) and used to amplify an ∼500 base pair region surrounding the identified indel. For each putative indel, both tumor and normal liver samples were tested. The area of interest was PCR amplified using AmpliTaq Gold DNA polymerase (Life Technologies, Carlsbad, CA, USA) and size separated on an agarose gel. Individual bands were purified and Sanger sequenced from both ends using the PCR amplification primers (BigDye Terminator Sequencing Kits, Life Technologies, Carlsbad, CA, USA).
To verify novel translocations, tumor samples with clinically validated rearrangements as well as novel BreaKmer-identified rearrangements were selected. Primers were designed to span the breakpoint resulting in an ∼200-bp amplicon (Supplementary Table S1). Several tumor samples with known translocations were also included to demonstrate the validity of the approach. For verification of each translocation, normal tissue samples were also included to test specificity. PCR-amplified products were size-separated by agarose gel electrophoresis and appropriately sized amplicons purified (Supplementary Figure S2). Sanger sequencing across the breakpoint verified discrepant results.
Patients and tumor tissue collection
Validation samples were selected from patients who were consented under institutional review board (IRB) approved protocol 11–104 from the Dana-Farber/Partners Cancer Care Office for the Protection of Research Subjects or discarded de-identified patient samples housed at the Brigham and Women's Hospital (BWH) Center for Advanced Molecular Diagnostics (CAMD). For cases for which patient consent had been documented, pathologic samples were obtained from DFCI or the BWH Department of Pathology for DNA extraction, and subsequent testing preformed in the BWH CAMD. The BWH Clinical Cytogenetics Laboratory performed all karyotyping and FISH assays. Molecular assays were performed by CAMD at BWH. All assays performed at BWH were developed and validated under CLIA guidelines. Patient charts were reviewed and appropriate specimens were selected for next-generation sequencing with the following criteria: ≥20% viable tumor content size ≥3 mm in greatest linear diameter. Specimen types profiled included FFPE, fresh/frozen and blood/marrow. Non-cancer ‘normal’ DNA samples were collected from de-identified, discarded DNA from blood samples submitted for Factor II or Factor V molecular screening.
Target capture panels
Two solution-phase hybrid capture targeted panels OncoPanel version 2.1 (OPv2.1) and OncoPanel version 2.2 (OPv2.2) were designed to capture the exons of 305 and 504 genes, respectively, using Agilent SureSelect RNA baits. OPv2.1 and OPv2.2 were further augmented with selected introns from 14 and 29 genes or cluster regions (e.g. IgK, IgL), respectively, to detect a set of known cancer-specific translocations (Supplementary Table S2). A total of 110 samples were captured using OPv2.1 (21 translocation samples, eight FLT3-ITD samples, one KIT deletion sample and 80 normal samples), and nine translocation samples were captured using OPv2.2.
DNA extraction and preparation
For solid tumor specimens, tissue was sectioned and hematoxylin and eosin (H&E)-stained slides were obtained. Tumor-rich areas from FFPE tumors were macrodissected from unstained slides or cored from whole FFPE blocks; fresh tissues were grossly minced and digested overnight with Proteinase K. Blood or marrow samples with mononuclear hematologic malignancies were enriched by Ficoll gradient prior to DNA extraction. DNA was extracted manually or using an automated protocol (QiaSymphony) as recommended by the manufacturer (Qiagen, Valencia, CA, USA) and quantified using SYBR-green based dsDNA detection (Invitrogen, Carlsbad, CA, USA). Samples with at least 200 ng of DNA were processed for next-generation sequencing.
Target capture, sequencing and analysis
DNA was fragmented using sonication (Covaris Inc., Woburn, MA, USA) to 250 bp and further purified using Agencourt AMPure XP beads. A total of 50 ng of size-selected DNA was then ligated to specific adaptors during library preparation (Illumina TruSeq, Illumina Inc., San Diego, CA, USA). Each library was made with sample-specific barcodes quantified using quantitative PCR (Kapa Biosystems, Inc., Woburn, MA, USA), and libraries were pooled to a total of 500 ng for capture enrichment using the Agilent SureSelect hybrid capture kit. For OPv2.1, 24 libraries were pooled and sequenced on two flow cell lanes (Illumina Inc., San Diego, CA, USA) for an equivalent of 12 samples per lane. For OPv2.2, eight to 24 samples were pooled and sequenced over two flow cell lanes. The 100-bp, paired-end sequences were generated using a HiSeq 2500 system in rapid run mode (Illumina Inc., San Diego, CA, USA).
Sequenced reads were aligned to the reference sequence b37 editions from the Human Genome Reference Consortium using bwa (32) with the parameters ‘-q 5 –l 32 –k 2 –o 1’. Duplicate reads were identified and removed using Picard tools. The alignments were further refined using the GATK tool for localized realignment around indel sites. Recalibration of the quality scores was performed using GATK tools (http://www.broadinstitute.org/gatk/guide/best-practices).
Sequencing output and quality metrics are listed in Supplementary Table S3. The total sequence yield per sample ranged from 6.8 to 98.1 million ‘pass filter’ reads with ‘pass filter’ rates between 76 and 98%. The average mean target coverage for all samples was 198 x. Coverage distributions are similar for the two panels and normal samples (Supplementary Figure S2).
Sample selection and replications
A total of 38 cancer specimens were selected for BreaKmer analysis (Table 1). There were 35 cancer samples clinically profiled at CAMD with a rearrangement event within a target-captured gene (Supplementary Table S4). To assess reproducibility, 12 samples were processed in triplicate across multiple independent runs. To avoid discordant results, several isolations were performed for each sample, pooled to ensure sample homogeneity and then aliquoted to produce replicates. All subsequent processes were performed independently for each sample. To estimate the lower limit of detection, four samples were prepared as for reproducibility and then diluted. FFPE samples with known translocation events were diluted with FFPE normal liver DNA, while fresh frozen or heme samples with known translocation events were diluted with DNA isolated from normal peripheral blood. Samples were sequenced at 100, 50 and 20% tumor content. Two human NSCLC cell lines, NCI-H2228 and NCI-H3122, were derived from an adenocarcinoma non-small cell lung cancer (33). An acute monocytic leukemia cell line, THP-1, with a KMT2A-AF9 translocation was also obtained (34). A total of 80 normal (non-cancer) samples were acquired from Factor II or Factor V molecular screening as positive controls.
Table 1. A list of sequenced tumor and non-tumor samples with known alterations, clinical annotations and number of replicates.
| Sample ID | Known alteration | Diagnosis | Tumor percentage | Tissue | Detection method | Panel | Nt | Nd |
|---|---|---|---|---|---|---|---|---|
| 1 | FLT3 indel | AML | 50 | Blood | Sanger sequencea | OPv2.1 | 1 | 0 |
| 2 | FLT3 indel | AML | 50 | Blood | Sanger sequencea | OPv2.1 | 1 | 0 |
| 3 | FLT3 indel | AML | 50 | Blood | Sanger sequencea | OPv2.1 | 1 | 0 |
| 4 | FLT3 indel | AML | 50 | Blood | Sanger sequencea | OPv2.1 | 1 | 0 |
| 5 | FLT3 indel | AML | 50 | Blood | Sanger sequencea | OPv2.1 | 1 | 0 |
| 6 | FLT3 indel | AML | 50 | Blood | Sanger sequencea | OPv2.1 | 1 | 0 |
| 7 | FLT3 indel | AML | 50 | Blood | Sanger sequencea | OPv2.1 | 1 | 0 |
| 8 | FLT3 indel | AML | 50 | Blood | Sanger sequencea | OPv2.1 | 1 | 0 |
| 9 | KIT deletion | GIST | NA | FFPE | Sanger sequence | OPv2.1 | 1 | 0 |
| 10 | t(2;2) ALK-EML4 | LA | 50 | FF | FISHb | OPv2.1 | 16 | 6 |
| 11 | t(2;2) ALK-EML4 | LA | 60 | FFPE | FISHb | OPv2.1 | 1 | 0 |
| 12 | t(2;2) ALK-EML4 | LA | 100 | Cell line | See reference (33) | OPv2.2 | 2 | 0 |
| 13 | t(2;2) ALK-EML4 | LA | 100 | Cell line | See reference (33) | OPv2.2 | 1 | 0 |
| 14 | t(2;2) ALK-EML4 | LA | 70 | FFPE | FISHb | OPv2.2 | 1 | 0 |
| 15 | t(9;22) BCR-ABL1 | CML | NA | Blood | qRT-PCR | OPv2.2 | 3 | 0 |
| 16 | t(9;22) BCR-ABL1 | ALL | NA | Heme | qRT-PCR | OPv2.1 | 2 | 0 |
| 17 | t(9;22) BCR-ABL1 | CML | NA | Heme | qRT-PCR | OPv2.1 | 1 | 0 |
| 18 | t(9;22) BCR-ABL1 | CML | NA | Heme | qRT-PCR | OPv2.1 | 10 | 6 |
| 19 | t(9;22) BCR-ABL1 | CML | NA | Heme | qRT-PCR | OPv2.1 | 7 | 0 |
| 20 | t(9;22) BCR-ABL1 | CML | NA | Heme | qRT-PCR | OPv2.1 | 6 | 0 |
| 21 | t(9;22) BCR-ABL1 | CML | 50 | Bone Marrow | qRT-PCR | OPv2.2 | 1 | 0 |
| 22 | t(7;16) EGFR translocation | LA | 70 | FFPE | PCR | OPv2.1 | 15 | 6 |
| 23 | t(21;22) ERG-EWSR1 | Ewing's Sarcoma, PNET | >90 | FFPE | FISHc | OPv2.2 | 1 | 0 |
| 24 | t(11;22) FLI1-EWSR1 | Ewing's Sarcoma | 100 | FFPE | FISHc | OPv2.1 | 1 | 0 |
| 25 | t(11;22) WT1-EWSR1 | DSRCT | 90 | FFPE | FISHc | OPv2.1 | 1 | 0 |
| 26 | t(11;22) FLI1-EWSR1 | Ewing's Sarcoma, PNET | >90 | FFPE | karyotype | OPv2.2 | 1 | 0 |
| 27 | t(8;17) FGFR1-ANKRD13B | CML | 90 | MeoH Ac-acid fixed | Karyotype, FISH | OPv2.1 | 1 | 0 |
| 28 | t(4;4) FIP1L1-PDGFRA | CML | NA | MeoH Ac-acid fixed | FISH | OPv2.1 | 1 | 0 |
| 29 | t(16;21) FUS-ERG | AML | 100 | Bone Marrow | Karyotype | OPv2.1 | 1 | 0 |
| 30 | t(14;18) IGH-BCL2 | CAP survey sample | NA | DNA | Qualitative DNA PCR assay | OPv2.1 | 3 | 0 |
| 31 | t(14;18) IGH-BCL2 | FL | NA | Frozen lymph node | Qualitative DNA PCR assay | OPv2.1 | 8 | 0 |
| 32 | t(10;11) KMT2A translocation | AML | NA | MeoH Ac-acid fixed | FISH | OPv2.1 | 1 | 0 |
| 33 | t(11;17) KMT2A translocation | AML | NA | MeoH Ac-acid fixed | FISH | OPv2.1 | 1 | 0 |
| 34 | t(6;11) KMT2A translocation | AML | 50 | Bone Marrow | FISH | OPv2.1 | 1 | 0 |
| 35 | t(9;11) MLLT3-KMT2A | AML | 100 | Cell line | See reference (34) | OPv2.2 | 2 | 0 |
| 36 | t(8;14) MYC-IGH | DLBCL | 70 | FFPE | FISH | OPv2.1 | 1 | 0 |
| 37 | t(15;17) PML-RARA | APML/AML M3 | 50 | Bone Marrow | RT-PCR | OPv2.2 | 1 | 0 |
| 38 | t(15;17) PML-RARA | APML/AML M3 | NA | Bone Marrow | Qualitative DNA PCR assay | OPv2.1 | 10 | 6 |
| 39–118 | Normal ‘controls’ | NA | NA | Blood | NA | OPv2.1 | 80 | 0 |
Nt: total number of replicates; Nd: number of dilution replicates; LA: lung adenocarcinoma; AML: acute myeloid leukemia; GIST: gastrointestinal stromal tumor; NSCLC: non-small cell lung cancer; DSRCT: desmoplastic small round cell tumor; CML: chronic myelogenous leukemia; ALL: acute lymphoblastic leukemia; PNET: primitive neuroectodermal tumor; DLBCL: diffuse large B-cell lymphoma; APML: acute promyelocytic leukemia; FL: follicular B-cell lymphoma; OPv2.1: OncoPanel-clinical; OPv2: OncoPanel v2; FFPE: formalin-fixed paraffin-embedded; FF: fresh frozen; FISH: fluourescence in situ hybridization; qRT-PCR: quantitative real-time PCR; NA: not available.
aNon-CLIA validated assay.
bVysis LSI ALK Dual color, Break Apart Rearrangement Probe (Abbott Molecular) at 2p23.
cLSI EWSR1 Dual Color, Break Apart Rearrangement Probe (Abbott Molecular) at 22q12.
SV detection analysis and processing
BreaKmer was used to analyze the targeted MPS data from all the replicates of the 38 cancer and 80 non-cancer specimens. All the target-captured regions in the OPv2.1 and OPv2.2 panels (OPv2.1, n = 305; OPv2.2, n = 504) were analyzed for each sample in which the corresponding panels were used. Default and minimum thresholds were used for assembling a contig (n = 2) and for subsequent filtering of variants (the Materials and Methods section).
Four other SV detection methods—CREST (27), Meerkat (28), BreakDancer (35) and Pindel (25)—were run on our data set. Parameters for each program were set to mimic the thresholds and settings used by BreaKmer. CREST 1.0 was run with the same SV read support threshold parameters and adjusted to be able to call variants with read support at a single breakpoint location (–min_sclip_reads 2, –min_one_side_reads 2, –sensitive, –rescue, –norm_tandem_repeat and –tr_max_size 100 for FLT3 ITDs). Meerkat 0.185 scripts (pre_process.pl, meerkat.pl, mechanism.pl and somatic_sv.pl) were run with default parameters with the exception of adjustment of the parameters to identify discordantly mapped read pairs for long-tailed insert size distributions that fit our data (-c 5, -d 5). BreakDancer-max 1.44 and Pindel 0.2.5a1 were run with default parameters. No matched normal samples were available to use for either method.
To properly compare the output from each of the programs, the results from each were annotated using the hg19 refGene table (http://hgdownload.cse.ucsc.edu/goldenPath/hg19/database). Similar to BreaKmer calls, any results not occurring within a targeted region were discarded from comparison. For inversions, intra-chromosomal rearrangements, insertions and deletions, one of the breakpoints must be in or near (±20 bp) an ‘exonic-tiled’ region or an ‘exonic-tiled’ region must be between the two breakpoints (±20 bp). Translocations were only kept if one of the inferred breakpoints occurred in a targeted region.
AML data
We selected four AML patients whose cancer genomes had previously been sequenced through the Cancer Genome Atlas (TCGA) consortium and annotated with cytogenetic or gene-fusion evidence of a somatic translocation (36). We downloaded the reference-aligned, Illumina-generated tumor DNA sequence reads of length 75 and 100 bp and insert size between 250 and 300 bp for these patients from the Cancer Genomics Hub (https://cghub.ucsc.edu). As described previously (36), the reads were aligned using bwa 0.5.5 and duplicate reads were removed used Picard 1.25. Based on this alignment, the mean depths of coverage for these four samples were 28.33, 36.13, 30.21 and 37.69.
RESULTS
BreaKmer detection of known variants in target-captured data
To test the method on real sequencing data, BreaKmer was used on targeted MPS data acquired from a mix of 38 tumor specimens (Table 1), each with one orthogonally validated event and a subset having multiple replicates. Hybrid-capture-based sequencing was performed using two versions of cancer gene-specific bait sets, OPv2.1 and OPv2.2 (the Materials and Methods section), which had mean targeted sequence depths of 215 x and 251 x in target-captured regions, respectively. The genomic positions and translocation partners of the 16 orthogonally validated translocations within 29 of the cancer specimens are displayed in Figure 2A. BreaKmer was highly sensitive in detecting the known translocations. True-positive translocation calls were made for 28 of the 29 (96.5%) translocation-positive samples (Figure 2B). Between the two capture panels, all 21 translocations in samples captured with OPv2.1 were detected, while eight of the nine translocations in OPv2.2 samples were positively detected. Considering all replicate samples in which the tumor-content was not diluted, BreaKmer detected 75 out of the 77 (97.4%) known translocation calls. Only one replicate among the 12 sample-replicate groups was not positively called, resulting in an overall reproducibility rate of 98.3%. High sensitivity was also achieved using the tumor-content ‘dilution’ replicates (the Materials and Methods section), demonstrating BreaKmer's efficacy in tumor samples with purities down to 20%. Overall, BreaKmer was capable of positively identifying all but one of the 20% tumor purity replicate translocations (i.e. ALK-EML4). All eight FLT3-ITDs and the KIT exon-11 deletion were identified. The FLT3-ITDs insertion sizes ranged from 30 to 87 bp with all the insertion breakpoints occurring within a 100-bp range of exon 14 (chr2:28608216–38608308).
Figure 2.
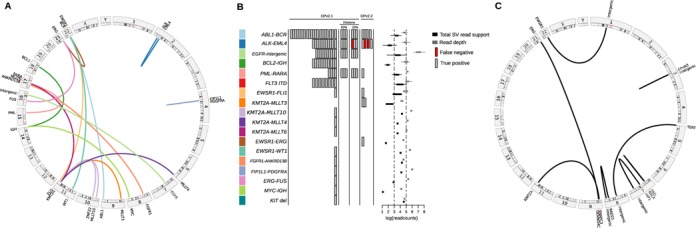
(A) A circos plot displaying links between gene partners and their genomic locations for the known translocations. (B) BreaKmer analysis results for the 38 cancer specimens and 80 ‘normal’ controls. For the 18 known SV events listed in the table rows, the true-positive (gray rectangle) and false-negative (red rectangle) results are shown for each replicate analyzed with the corresponding SV. The rectangles in the center are spaced to indicate separate samples. Boxplots on the right show the distributions of total read support (black boxplots) with the read depth (gray boxplots) at the inferred breakpoints for each of the known variants detected by BreaKmer. (C) A circos plot showing the validated novel translocation partners and their genomic locations identified by BreaKmer.
In addition to the known SVs, BreaKmer identified 21 additional SV events from all the cancer replicates. There were 11 translocations and 10 insertion/deletion events that were previously unidentified in all of the tumor samples. All 11 novel translocations were submitted for confirmation and nine were positively validated using PCR. (Figure 2C and Supplementary Table S5). For the 10 novel insertions/deletions, there were nine with sufficient DNA and that were successfully tested using PCR, eight of which were positively confirmed (Supplementary Table S5). Overall, BreaKmer achieved a sensitivity of 97.4% in detecting the 38 known events and a positive predictive value of 77.3% for the newly predicted events. For the 80 non-cancer samples analyzed as a negative control set, few to no SV involving the cancer-specific-targeted genes were expected to be called. Aside from a set of indels occurring in many of the samples and later identified to be due to alternative reference assembly sequence, BreaKmer called two translocations and three indels. One of the translocations, involving the T-cell receptor beta locus (TRB) and an intergenic region, was validated, while two of the three indels were validated and the third test failed to run. The full list of BreaKmer results can be found in Supplementary Table S6.
BreaKmer SV detection metrics in targeted sequencing
To assess the amount of read support required to detect translocations when one of the genomic partners was not included in the hybrid-capture panel, we examined the evidence for the known events detected by BreaKmer relative to coverage depth. Deep sequence coverage was observed for at least one of the BreaKmer inferred genomic breakpoint locations for each of the detected variants. More specifically, 75% of the breakpoint-containing regions exceed a depth of a 100 reads with a minimum of 34 reads, for each translocation. Only a single translocation ‘partner’ for all but four of the known translocation events were designed to be captured (Supplementary Table S4), resulting in a median read depth of three reads (34 instances of less than two reads) at the BreaKmer inferred genomic breakpoints in the non-targeted translocation partner (Supplementary Figure S3). The number of assembled reads (ARs) that cover the breakpoint location in the translocation contigs had a median of 14 reads (range of 2 to 81 reads). Similarly, the discordantly mapped read pairs (DRs) that supported the known translocation calls ranged from 0 to 78 reads with a median value of seven reads. There were 11 translocations with only two ARs and four translocations had zero DR evidence. As expected, the amount of detected read support and corresponding read depths around the identified breakpoints for all the known SV events are roughly correlated (Spearman rank correlation coefficient = 0.47) (Figure 3A). The values of the two forms of read support (AR and DR) for the translocations also have an expected association (Spearman rank correlation coefficient = 0.75) (Figure 3B).
Figure 3.
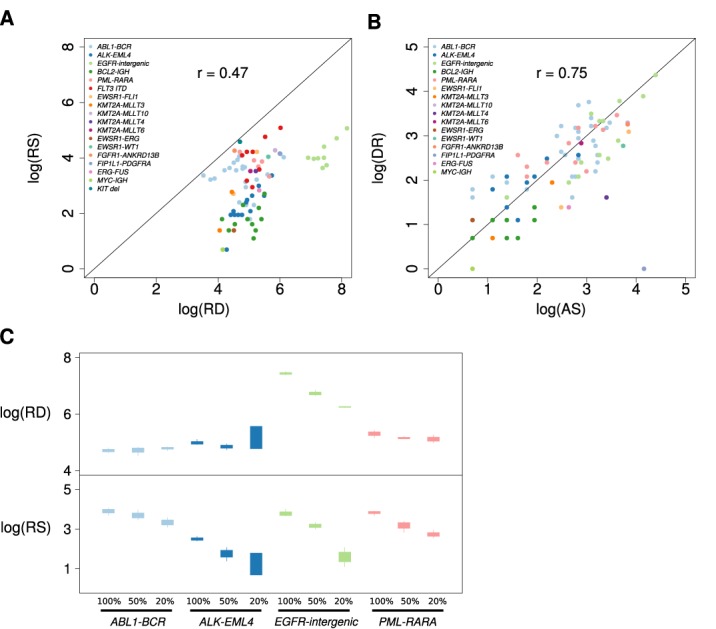
Plots displaying the relations between sequence read evidence and read depths. (A) A scatterplot showing the relation between the total read support (RS) for the known SV events identified from the BreaKmer analysis and the maximum sequence read depth (RD) observed at the inferred SV breakpoints on the log scale. Each point represents a replicate in which a true-positive call was made by BreaKmer, and the point color corresponds to the known SV of the sample replicate. (B) A scatterplot showing the relation between the quantity of the two types of sequence read evidence identified by BreaKmer for translocations. Each point represents a replicate with a known translocation that BreaKmer properly identified with the log transformed number of assembled reads (AS) on the x-axis and the log transformed number of discordantly mapped read pairs (DR) on the y-axis. (C) Boxplots showing the distributions of the BreaKmer inferred breakpoint read depth (RD, top panel) in relation to the amount of total read support (RS, bottom panel) of the identified known translocations for the four samples with tumor purity dilution replicates.
There is an expected lower variation in total read support (RS) and corresponding sequencing read depths (RDs) at BreaKmer inferred breakpoints for within-sample replicates (RS average SD = 10.98; RD average SD = 110.35) compared to between samples (RS SD = 34.72; RD average SD = 264.85). Even for the sample replicate groups with low overall read support (i.e. <15 reads), the amount of AR and DR support across replicates was consistent. For example, the six replicates for sample 20, with an ABL1-BCR translocation, had fairly uniform total read supports of 11, 10, 7, 10, 7 and 6 reads with corresponding read depths in the ABL1 breakpoint location of 115, 146, 117, 194, 86 and 163.
The expected effect of reduced SV evidence due to a reduction in sequenced tumor-content was observed in the dilution replicates from four translocation-positive samples (Figure 3C). The read depths at the breakpoints were constant with the reduction in tumor purity, with an exception for the replicates containing the EGFR-intergenic translocation. This was due to a large somatic EGFR amplification, which observably has a direct effect on the read depth of the EGFR translocation breakpoint identified by BreaKmer.
SV analysis comparisons
To test how BreaKmer performs relatively to widely used, publically available SV detection tools, we analyzed our complete data set with four other methods. CREST (27), Meerkat (28) and BreakDancer-max (35) were applied to the complete data set, while Pindel (25) was only applied to the eight samples with FLT3-ITDs. Meerkat incorporates both soft-clipped and discordantly mapped paired-end reads, while CREST strictly uses soft-clipped reads and BreakDancer-max only uses discordantly mapped paired-end reads. Pindel is designed for detecting breakpoints for large deletions, medium-sized insertions, inversions and tandem duplications. All programs were run with mostly default parameters with minor adjustments and the results were processed in a manner similar to BreaKmer's (the Materials and Methods section).
Comparing sensitivities for identifying the set of 38 known variants in the 38 cancer specimens across the methods, BreaKmer (97.4%) outperformed CREST (78.9%), Meerkat (71.1%) and BreakDancer-max (68.4%) (Table 2). Similarly, BreaKmer identified 84 out of 86 replicate events compared to 66, 70 and 64 for CREST, Meerkat and BreakDancer-max, respectively. Detection of translocations in the reduced tumor-content replicates also demonstrated a marked reduction in sensitivity for these methods. Indeed, CREST missed all three EGFR translocations in the 20% tumor purity replicates and BreakDancer-max only identified one out of the six ALK-EML4 translocations in all the ‘dilution’ replicates. The most difficult event to detect across the three methods was the FLT3-ITD. Meerkat and BreakDancer missed all eight cases, CREST missed six and Pindel was able to detect all eight of the FLT3-ITDs. CREST and BreakDancer-max also had difficulty in detecting the BCL2-IGH translocations; the translocation was identified in one and six out of the 11 sample replicates, respectively.
Table 2. Counts for the number of true-positive results for all the replicates, listed by the known alterations and four SV detection methods.
| True-positive counts | |||||||||||||||
|---|---|---|---|---|---|---|---|---|---|---|---|---|---|---|---|
| Total replicates | BreaKmer | CREST | Meerkat | BreakDancer | |||||||||||
| Known alteration | ND | D50 | D20 | ND | D50 | D20 | ND | D50 | D20 | ND | D50 | D20 | ND | D50 | D20 |
| ABL1-BCR | 24 | 3 | 3 | 24 | 3 | 3 | 24 | 3 | 3 | 22 | 3 | 3 | 24 | 3 | 3 |
| ALK-EML4 | 15 | 3 | 3 | 13 | 3 | 2 | 13 | 2 | 2 | 13 | 3 | 1 | 10 | 0 | 1 |
| EGFR-intergenic | 9 | 3 | 3 | 9 | 3 | 3 | 7 | 2 | 0 | 8 | 3 | 3 | 9 | 3 | 1 |
| BCL2-IGH | 11 | 0 | 0 | 11 | 0 | 0 | 1 | 0 | 0 | 10 | 0 | 0 | 6 | 0 | 0 |
| PML-RARA | 5 | 3 | 3 | 5 | 3 | 3 | 5 | 3 | 3 | 5 | 3 | 3 | 5 | 3 | 3 |
| FLT3-ITD | 8 | 0 | 0 | 8 | 0 | 0 | 2 | 0 | 0 | 0 | 0 | 0 | 0 | 0 | 0 |
| EWSR1-FLI1 | 2 | 0 | 0 | 2 | 0 | 0 | 2 | 0 | 0 | 2 | 0 | 0 | 2 | 0 | 0 |
| KMT2A-MLLT3 | 2 | 0 | 0 | 2 | 0 | 0 | 2 | 0 | 0 | 1 | 0 | 0 | 1 | 0 | 0 |
| KMT2A-MLLT10 | 1 | 0 | 0 | 1 | 0 | 0 | 1 | 0 | 0 | 1 | 0 | 0 | 1 | 0 | 0 |
| KMT2A-MLLT4 | 1 | 0 | 0 | 1 | 0 | 0 | 1 | 0 | 0 | 1 | 0 | 0 | 1 | 0 | 0 |
| KMT2A-MLLT6 | 1 | 0 | 0 | 1 | 0 | 0 | 1 | 0 | 0 | 1 | 0 | 0 | 1 | 0 | 0 |
| ERG-EWSR1 | 1 | 0 | 0 | 1 | 0 | 0 | 1 | 0 | 0 | 1 | 0 | 0 | 0 | 0 | 0 |
| EWSR1-WT1 | 1 | 0 | 0 | 1 | 0 | 0 | 1 | 0 | 0 | 1 | 0 | 0 | 1 | 0 | 0 |
| ANKRD13B-FGFR1 | 1 | 0 | 0 | 1 | 0 | 0 | 1 | 0 | 0 | 1 | 0 | 0 | 1 | 0 | 0 |
| FIP1L1-PDGFRA | 1 | 0 | 0 | 1 | 0 | 0 | 1 | 0 | 0 | 1 | 0 | 0 | 1 | 0 | 0 |
| ERG-FUS | 1 | 0 | 0 | 1 | 0 | 0 | 1 | 0 | 0 | 1 | 0 | 0 | 1 | 0 | 0 |
| IGH-MYC | 1 | 0 | 0 | 1 | 0 | 0 | 1 | 0 | 0 | 1 | 0 | 0 | 0 | 0 | 0 |
| KIT deletion | 1 | 0 | 0 | 1 | 0 | 0 | 1 | 0 | 0 | 0 | 0 | 0 | 0 | 0 | 0 |
| Total replicates | 86 | 12 | 12 | 84 | 12 | 11 | 66 | 10 | 8 | 70 | 12 | 10 | 64 | 9 | 8 |
| Total samples | 38 | 4 | 4 | 37 | 4 | 4 | 30 | 4 | 3 | 27 | 4 | 4 | 26 | 3 | 4 |
ND: non-dilution replicates; D50: dilution replicates with 50% tumor purity; D20: dilution replicates with 20% tumor purity.
There was a strikingly large quantity of previously unidentified SV identified by CREST, Meerkat and BreakDancer-max relative to BreaKmer for the 38 cancer specimens as well for the 80 non-cancer samples (Table 3). The number of additional calls from BreaKmer never exceeded five additional calls per sample, and many of these were identified as indels that were artifacts from alternative reference assemblies. While similar artifacts could be present in the other methods’ results, there were up to a 1000-fold more results output by the other three methods. Even among the non-cancer samples there are a substantial number of events predicted with averages of 46, 28 and 40 for CREST, Meerkat and BreakDancer-max, respectively. Overlap in calls between replicates for the samples with three or more replicates resulted in high percentages of calls that were only identified in a single replicate by CREST, Meerkat and BreakDancer-max, suggesting high false-positive rates. For all three of these tools, at least 90% of the additional calls for virtually all nine replicate groups were not identified by more than a single replicate. The additional calls categorized as indels, tandem duplications, translocations or inversions revealed that translocation was the most commonly called SV type by CREST, while BreakDancer-max called more indels and Meerkat had a consistent number of calls across the four categories (Supplementary Figure S4). The full list of results for CREST, Meerkat and BreakDancer can be found in Supplementary Table S7.
Table 3. A list of the total number of previously unidentified SV calls made by the SV detection methods for the tumor and non-tumor replicates.
| BreaKmer | CREST | Meerkat | BreakDancer | |||||||||||
|---|---|---|---|---|---|---|---|---|---|---|---|---|---|---|
| Sample ID(s) | Known alteration | N | T | M(S%) | MTG-TRL | T | M(S%) | MTG-TRL | T | M(S%) | MTG-TRL | T | M(S%) | MTG-TRL |
| 10 | ALK-EML4 | 10 | 3 | 0.3(0) | 0 | 1797 | 179.7(99.9) | 96.3 | 826 | 82.6(98.3) | 42.8 | 337 | 33.7(95) | 0.6 |
| 22 | EGFR-intergenic | 9 | 9 | 1(30) | 1.22 | 886 | 98.4(99.5) | 62.78 | 420 | 46.7(96.7) | 22.56 | 264 | 29.3(94.3) | 1.78 |
| 31 | BCL2-IGH | 8 | 3 | 0.38(0) | 0 | 699 | 87.38(99.9) | 57.75 | 421 | 52.6(97.4) | 22.13 | 1060 | 132.5 97.3) | 0.63 |
| 19 | ABL1-BCR | 7 | 5 | 0.7(20) | 0 | 991 | 141.6(99.8) | 78 | 542 | 77.4(98.5) | 31 | 589 | 84.1(99) | 0.29 |
| 20 | ABL1-BCR | 6 | 4 | 0.7(50) | 0 | 360 | 60(1) | 44.5 | 121 | 20.2(95) | 10 | 430 | 71.7(98.4) | 0 |
| 18 | ABL1-BCR | 4 | 2 | 0.5(50) | 0 | 822 | 205.5(1) | 111.5 | 259 | 64.8(98.5) | 24.5 | 187 | 46.8(98.4) | 0.25 |
| 38 | PML-RARA | 4 | 2 | 0.5(0) | 0 | 277 | 69.3(1) | 48 | 135 | 33.8(95.6) | 13 | 349 | 87.25(98.6) | 1.25 |
| 15 | ABL1-BCR | 3 | 3 | 1(0) | 0 | 513 | 171(99.8) | 105.3 | 334 | 111.3(97.6) | 51.33 | 1358 | 452.67(97.9) | 3 |
| 30 | BCL2-IGH | 3 | 2 | 0.7(0) | 0 | 296 | 98.7(1) | 61 | 173 | 57.7(98.8) | 20 | 416 | 138.7(98) | 0 |
| 12 | ALK-EML4 | 2 | 6 | 3 | 0 | 207 | 103.5 | 72.5 | 156 | 78 | 36.5 | 437 | 218.5 | 5.5 |
| 16 | ABL1-BCR | 2 | 2 | 1 | 0 | 161 | 80.5 | 54 | 104 | 52 | 17 | 555 | 277.5 | 1.5 |
| 35 | KMT2A-MLLT3 | 2 | 5 | 3 | 1 | 538 | 269 | 142.5 | 336 | 168 | 75.5 | 1601 | 800.5 | 6.5 |
| 1 | FLT3-ITD | 1 | 2 | 2 | 0 | 86 | 86 | 70 | 27 | 27 | 8 | 31 | 31.0 | 1 |
| 2 | FLT3-ITD | 1 | 2 | 2 | 0 | 74 | 74 | 45 | 32 | 32 | 10 | 118 | 118.0 | 0 |
| 3 | FLT3-ITD | 1 | 2 | 2 | 0 | 93 | 93 | 58 | 30 | 30 | 12 | 25 | 25.0 | 0 |
| 4 | FLT3-ITD | 1 | 2 | 2 | 0 | 275 | 275 | 129 | 79 | 79 | 30 | 81 | 81.0 | 0 |
| 5 | FLT3-ITD | 1 | 2 | 2 | 0 | 83 | 83 | 58 | 30 | 30 | 13 | 45 | 45.0 | 1 |
| 6 | FLT3-ITD | 1 | 2 | 2 | 0 | 79 | 79 | 53 | 26 | 26 | 11 | 27 | 27.0 | 1 |
| 7 | FLT3-ITD | 1 | 3 | 3 | 0 | 160 | 160 | 101 | 38 | 38 | 15 | 100 | 100.0 | 0 |
| 8 | FLT3-ITD | 1 | 1 | 1 | 0 | 87 | 87 | 65 | 44 | 44 | 16 | 17 | 17.0 | 0 |
| 9 | KIT deletion | 1 | 1 | 1 | 0 | 59 | 59 | 43 | 19 | 19 | 5 | 10 | 10.0 | 0 |
| 11 | ALK-EML4 | 1 | 3 | 3 | 0 | 132 | 132 | 75 | 99 | 99 | 28 | 128 | 128.0 | 1 |
| 13 | ALK-EML4 | 1 | 4 | 4 | 0 | 220 | 220 | 138 | 151 | 151 | 70 | 1558 | 1558.0 | 5 |
| 14 | ALK-EML4 | 1 | 5 | 5 | 0 | 758 | 758 | 266 | 429 | 429 | 142 | 104 | 104.0 | 3 |
| 17 | ABL1-BCR | 1 | 3 | 3 | 0 | 86 | 86 | 58 | 66 | 66 | 27 | 135 | 135.0 | 0 |
| 21 | ABL1-BCR | 1 | 3 | 3 | 0 | 134 | 134 | 92 | 32 | 32 | 5 | 61 | 61.0 | 3 |
| 23 | ERG-EWSR1 | 1 | 3 | 3 | 0 | 1034 | 1034 | 155 | 2733 | 2733 | 287 | 373 | 373.0 | 1 |
| 24 | EWSR1-FLI1 | 1 | 2 | 2 | 1 | 1583 | 1583 | 208 | 884 | 884 | 127 | 99 | 99.0 | 3 |
| 25 | EWSR1-WT1 | 1 | 2 | 2 | 0 | 481 | 481 | 161 | 186 | 186 | 70 | 192 | 192.0 | 0 |
| 26 | EWSR1-FLI1 | 1 | 3 | 3 | 1 | 3506 | 3506 | 407 | 2140 | 2140 | 346 | 266 | 266.0 | 6 |
| 27 | ANKRD13B-FGFR1 | 1 | 2 | 2 | 0 | 1973 | 1973 | 249 | 1006 | 1006 | 185 | 137 | 137.0 | 10 |
| 28 | FIP1L1-PDGFRA | 1 | 3 | 3 | 0 | 207 | 207 | 108 | 107 | 107 | 39 | 14 | 14.0 | 1 |
| 29 | ERG-FUS | 1 | 2 | 2 | 0 | 38 | 38 | 33 | 17 | 17 | 4 | 29 | 29.0 | 0 |
| 32 | KMT2A-MLLT10 | 1 | 5 | 5 | 1 | 280 | 280 | 138 | 110 | 110 | 43 | 36 | 36.0 | 1 |
| 33 | KMT2A-MLLT6 | 1 | 2 | 2 | 0 | 409 | 409 | 159 | 85 | 85 | 42 | 11 | 11.0 | 1 |
| 34 | KMT2A-MLLT4 | 1 | 2 | 2 | 0 | 72 | 72 | 51 | 45 | 45 | 11 | 16 | 16.0 | 1 |
| 36 | IGH-MYC | 1 | 3 | 3 | 0 | 70 | 70 | 37 | 50 | 50 | 14 | 15 | 15.0 | 0 |
| 37 | PML-RARA | 1 | 4 | 4 | 0 | 137 | 137 | 99 | 99 | 99 | 49 | 73 | 73.0 | 3 |
| 39–118 | - | 80 | 151 | 1.9 | 0.025 | 3706 | 46.33 | 32.69 | 2204 | 27.55 | 8.9875 | 3217 | 40.21 | 0.44 |
N: number of replicates/samples; T: total number of ‘additional calls’; M: average number of ‘additional’ calls made per replicate/sample; S: percentage of ‘additional’ calls made that were uniquely called by a single replicate; MTG-TRL: average number of target genes involved in ‘additional’ translocation calls made per replicate/sample.
For samples with more than three replicates, the average per replicate/sample is calculated as well as the percentage of unique calls amonge the sample replicates.
Analysis of the outputs from BreaKmer, CREST, Meerkat and BreakDancer-max indicated a lack of reproducibility for the additional calls made from the individual methods (Supplementary Table S8). The largest overlap in calls occured between CREST and Meerkat with 2237 calls. In contrast, BreaKmer and Meerkat had the minimum overlap with 9 overlapping calls. The set of 88 calls identified by CREST, Meerkat and BreakDancer was comprised of 71 indels, two translocations and 15 inversions. The two translocations had also been identified by BreaKmer in sample 12 and validated (t(5;8)TERT-intergenic, t(3;12) EPHA3-intergenic).
Targeted SV analysis using WGS data
To test BreaKmer on WGS data, four adult de novo AML patients annotated with KMT2A (i.e. MLL) (n = 2) and PML-RARA (n = 2) translocations were used. These cases were previously analyzed and published with cytogenetic confirmation of the PML-RARA cases and RNA-sequencing gene fusions supporting all four translocations (36). To recapitulate these translocations findings and demonstrate targeted SV analysis in WGS data, we used BreaKmer to analyze the superset of 579 targeted regions from OPv2.1 and OPv2.2, which included the genic regions of KMT2A, PML and RARA.
BreaKmer positively detected both of the PML-RARA translocations and identified KMT2A rearrangements in the other two cases (Supplementary Table S9). For one patient with a published gene fusion between KMT2A and MLLT10, BreaKmer identified a different partner gene, DNAJC1, translocated with KMT2A. Previous studies have identified DNAJC1 as a KMT2A translocation partner in AML (37), and there were multiple contigs identified by BreaKmer that supported the KMT2A-DNAJC1 translocation and indicated a balanced event. The second patient with a KMT2A rearrangement had multiple KMT2A fusions with MLLT10 and CEP164, both of which were identified in our analysis. Considering mean depth of coverage for these data were between 28 and 37 x, there were expectedly few reads (two to nine) assembled at the inferred breakpoints for all of the assembled PML-RARA and KMT2A contigs. There was a greater abundance of discordantly mapped read pairs than ARs for three of the four variants. By comparison, the published SV detection results for these data generated by BreakDancer show that both PML-RARA translocations were detected while the KMT2A rearrangements were not.
BreaKmer detected nine other translocations in the four samples. Only two of these translocations had discordantly mapped read-pair evidence, and one (TCF7L1-NAV2) of which has been observed in colorectal cancers (38). A handful of indels were detected for the four samples; however, manual inspection indicated that these are all the result of alternative reference assemblies rather than true somatic mutations.
DISCUSSION
Comprehensively screening the cancer genome at high resolution for a large spectrum of alterations is costly, slow and challenging using traditional cytogenetic and molecular techniques. Optimally, WGS of tumor DNA would be most sensitive for detecting SV; however, the current cost, analysis and storage of these data are inhibitory in the clinical setting. Alternatively, the clinical application of targeted MPS provides a high-throughput, economical, multi-application assay to compliment current tests and reduces the cost and time for detecting actionable alterations, such as SV. Therefore, targeted sequencing panels are becoming more frequently used to detect genetic abnormalities, yet the tools to analyze SV in these data are not optimized and current algorithms, which were created for WGS data, lack the necessary sensitivity and specificity on targeted data sets to translate these tools to the clinical setting.
Here we described BreaKmer, a novel SV detection method specifically designed for target-captured MPS data. BreaKmer analyzes defined target regions of the genome independently by assembling all soft-clipped and unmapped (with mapped mate) read sequences in a region and realigning the assembled sequences to identify structural variants with their nucleotide-level breakpoints. The BreaKmer methodology shares similarities to a recent SV detection method, CREST, in using assembly and realignment of assembled sequences as the primary techniques for SV calling and breakpoint identification, unlike previously implemented breakpoint identification methods that have used assembly and realignment techniques solely as a secondary analysis after SV identification. Our approach provides the ability to specify and analyze targeted regions without a first pass analysis to first indicate candidate regions. Yet, BreaKmer has a similar assembly procedure as the aforementioned breakpoint identification methods, particularly in using all the pertinent misaligned sequences, both soft-clipped and unmapped, within a specified region for a single assembly. This significantly contrasts from the CREST assembly method that performs separate assemblies for each genomic position with a set of co-aligned SR sequences.
Beyond a unique SV detection workflow specifically for targeted sequencing, BreaKmer provides a novel implementation of a greedy-based assembler designed for SV detection using kmers. In this assembly process, the kmer strategy quickly selects and frequency ranks kmer sequences that differ from the targeted reference sequence, indicating involvement in SV. These variant kmer sequences are then used to group the reads to assemble. An additional feature of BreaKmer that is unlike other SR methods is the extraction and use of discordantly mapped paired-end reads. While discordantly mapped paired-end reads are typically used alone or prior to SRs, BreaKmer uses them as non-requisite evidence to aid in filtering candidate variants.
Our approach for analyzing SV in targeted sequencing efforts is immediately compatible with ongoing clinical and research efforts. BreaKmer provides an efficient means to analyze all or subsets of targeted regions that were captured and sequenced. Analyzing target-aligned reads can be trivially done with other current SV detection methods, but unlike BreaKmer, the targeted design is not used to enhance SV calling within these tools.
We demonstrated BreaKmer's performance to predict translocations, insertion/deletions, inversions and tandem duplications on regions using targeted and whole-genome MPS data generated from a variety of cancer specimens with orthogonally validated, clinically relevant genomic variations. BreaKmer's high sensitivity (97.4%) and reproducibility (98.3%) for detecting known variants in the targeted MPS data demonstrated the effectiveness of our method, which uses kmers to assemble ‘variant genomes’ from abnormally aligned reads in a region and call SV from these. Moreover, BreaKmer sensitively detected numerous translocations even when only one gene of the translocation was deeply sequenced. Analysis of the 80 non-cancer samples, expected to have limited SV calls in the cancer-specific targets, resulted in a small set of germline events. Lastly, BreaKmer analysis of WGS data using target regions identified previously published rearrangements and further highlighted BreaKmer's flexibility and sensitivity.
While all four methods identified a majority of the known SV events, BreaKmer achieved the highest sensitivity. Further assessing the causes of the missed events by the other three tools indicated limitations at various stages in the methods or implementations thereof. Considering the amount of discordantly mapped read pair support for the known variants is noticeably lower than the amount of SR support or non-existent, BreakDancer-max's exclusive use of this information resulted in the expected limitation in sensitivity. For CREST, failures to initially build assemblies from the soft-clipped sequences (six EGFR-intergenic translocations) and produce calls from realignments (10 BCL2-IGH translocations) were sources for missed calls. The lack of logging was unhelpful in determining the exact logic for these missed calls, and adjustment of parameters to increase sensitivity yielded no change. In these particular instances, BreaKmer's process for assembling reads, realignment and calling is more robust than CREST's process. Additionally, CREST failed to call six of the eight FLT3-ITDs due to ‘mapping quality’ and ‘type distance’ filters despite setting the proper tandem repeat parameters (see the Materials and Methods section). These filters are not well documented nor was it clear how to adjust the parameters for these particular filters. The complexity of inferring these FLT3-ITDs using the CREST method highlights an advantage and key difference in the BreaKmer approach. Specifically, CREST assembly-mapping-searching-assembly-alignment procedure must perform two assemblies and two alignments and determine the structural variant based on information from the combination of these steps. BreaKmer simplifies this procedure by building the full contig sequence containing the insertion sequence by using all the SRs and unmapped reads with mapped mates in the gene region and then performs a realignment to directly observe an insertion event as compared to the reference sequence. Lastly, examination of Meerkat's missed calls revealed the limitation in remapping soft-clipped sequences prior to identifying discordant read pair clusters. For the eight missed FLT3-ITDs and three of the EML4-ALK translocation events the remapping step failed to map, or uniquely map, the sequences to the proper breakpoint locations preventing the ability to identify clusters at these positions. As illustrated in these cases, failure to properly remap individual soft-clipped sequences can easily eliminate read support for a variant. BreaKmer's approach to assemble the soft-clipped and unmapped reads into a consensus sequence first is a more robust way to group the supporting reads and provide a longer sequence with improved ability to properly realign. There were also three instances where Meerkat missed calls in which the proper discordant read pair cluster was identified but the cluster was not carried forward as a candidate variant.
Beyond detecting the known events, all four methods output numerous other SV calls that were not previously known or validated. By aiming to maximize the sensitivity of these methods with appropriate adjustment of various parameters, such as read support thresholds, the total number of calls expectedly increased, likely due to more false-positive results. This is supported by the reported lack of reproducibility of many of the additional calls between the sample replicates and the four methods as well as a high number of calls in the non-cancer samples. Yet, the differences in methodologies between the four programs may explain some unique, and possibly real findings, as has been suggested in previous comparisons using other SV calling programs (22). Also, features and variations in parameters of the different programs can make a substantial difference in the number of additional calls that are made. For example, allowing CREST to make calls with SRs only at one of the variant's breakpoints dramatically increases the total number of calls. In further examining the CREST output, a majority of the additional calls were using duplicated reads for read support despite the flagging their removal. We estimated that ∼98% of the additional calls were of this nature because their contigs were of equal length to a single read. Systematic removal of these was not done, as it would have removed true-positive calls as well. The exclusive use of SRs (CREST) or discordant read pairs (BreakDancer) also limits the information used by the methods to determine whether a call appears real or not. BreaKmer makes use of the discordant read pair information to aid in the filtering of rearrangement calls with low read support. Despite aiming to appropriately adjust each program's parameters to fairly compare results and maximize results, we recognize that each program may require optimization for targeted sequencing data to yield improved results.
In short, BreaKmer provides a novel method to sensitively interrogate MPS data for SV. The application of BreaKmer on clinical MPS data in combination with traditional pathological techniques will enhance the ability to quickly and accurately aid in determining appropriate diagnosis and treatment regimens.
AVAILABILITY
BreaKmer is implemented in python programming language and can be run on standard research-computing hardware with ∼4 Gb of memory. An analysis of 300 genes/regions with an average of 150-fold sequence coverage for a single sample would range between 30 and 120 min to complete. A binary alignment/map (BAM) formatted file containing sequence alignments to the reference genome by a ‘soft-clipping’ aligner, such as bwa (32) or Bowtie (39), is required as input. BreaKmer is available to download at https://github.com/a-bioinformatician/BreaKmer.
ACCESSION NUMBER
All the sequencing data analyzed in this study have been submitted to the NCBI Short Read Archive databank (SRA, http://www.ncbi.nlm.nih.gov/sra) under accession number SRP042598 (SRA).
SUPPLEMENTARY DATA
Supplementary Data are available at NAR Online.
Disclaimer: The funders had no role in study design, data collection and analysis, decision to publish or preparation of the manuscript.
FUNDING
Funding for open access charge: This work is supported by the Dana-Farber Cancer Institute and Brigham and Women's Hospital.
Conflict of interest statement. Matthew Meyerson is a founder and equity holder of Foundation Medicine, a for-profit company that provides next-generation sequencing diagnostic services.
REFERENCES
- 1.Vogelstein B., Papadopoulos N., Velculescu V.E., Zhou S., Diaz L.A., Kinzler K.W. Cancer genome landscapes. Science. 2013;339:1546–1558. doi: 10.1126/science.1235122. [DOI] [PMC free article] [PubMed] [Google Scholar]
- 2.Bunting S.F., Nussenzweig A. End-joining, translocations and cancer. Nat. Rev. Cancer. 2013;13:443–454. doi: 10.1038/nrc3537. [DOI] [PMC free article] [PubMed] [Google Scholar]
- 3.Mitelman F., Johansson B., Mertens F. The impact of translocations and gene fusions on cancer causation. Nat. Rev. Cancer. 2007;7:233–245. doi: 10.1038/nrc2091. [DOI] [PubMed] [Google Scholar]
- 4.Rowley J.D. Chromosome translocations: dangerous liaisons revisited. Nat. Rev. Cancer. 2001;1:245–250. doi: 10.1038/35106108. [DOI] [PubMed] [Google Scholar]
- 5.Rowley J.D. Chromosomal translocations: revisited yet again. Blood. 2008;112:2183–2189. doi: 10.1182/blood-2008-04-097931. [DOI] [PubMed] [Google Scholar]
- 6.Vardiman J.W., Harris N.L., Brunning R.D. The World Health Organization (WHO) classification of the myeloid neoplasms. Blood. 2002;100:2292–2302. doi: 10.1182/blood-2002-04-1199. [DOI] [PubMed] [Google Scholar]
- 7.Moen M.D., McKeage K., Plosker G.L., Siddiqui M.A.A. Imatinib: a review of its use in chronic myeloid leukaemia. Drugs. 2007;67:299–320. doi: 10.2165/00003495-200767020-00010. [DOI] [PubMed] [Google Scholar]
- 8.Soda M., Choi Y.L., Enomoto M., Takada S., Yamashita Y., Ishikawa S., Fujiwara S., Watanabe H., Kurashina K., Hatanaka H., et al. Identification of the transforming EML4–ALK fusion gene in non-small-cell lung cancer. Nature. 2007;448:561–566. doi: 10.1038/nature05945. [DOI] [PubMed] [Google Scholar]
- 9.Nakao M., Yokota S., Iwai T., Kaneko H., Horiike S., Kashima K., Sonoda Y., Fujimoto T., Misawa S. Internal tandem duplication of the flt3 gene found in acute myeloid leukemia. Leukemia. 1996;10:1911–1918. [PubMed] [Google Scholar]
- 10.Patel J.P., Gönen M., Figueroa M.E., Fernandez H., Sun Z., Racevskis J., Van Vlierberghe P., Dolgalev I., Thomas S., Aminova O., et al. Prognostic relevance of integrated genetic profiling in acute myeloid leukemia. N. Engl. J. Med. 2012;366:1079–1089. doi: 10.1056/NEJMoa1112304. [DOI] [PMC free article] [PubMed] [Google Scholar]
- 11.Feuk L., Carson A.R., Scherer S.W. Structural variation in the human genome. Nat. Rev. Genet. 2006;7:85–97. doi: 10.1038/nrg1767. [DOI] [PubMed] [Google Scholar]
- 12.Bauman J.G., Wiegant J., Borst P., van Duijn P. A new method for fluorescence microscopical localization of specific DNA sequences by in situ hybridization of fluorochromelabelled RNA. Exp. Cell Res. 1980;128:485–490. doi: 10.1016/0014-4827(80)90087-7. [DOI] [PubMed] [Google Scholar]
- 13.Netto G.J., Saad R.D., Dysert P.A. Diagnostic molecular pathology: current techniques and clinical applications, part I. Proc. Bayl. Univ. Med. Cent. 2003;16:379–383. doi: 10.1080/08998280.2003.11927931. [DOI] [PMC free article] [PubMed] [Google Scholar]
- 14.Belaud-Rotureau M.-A., Parrens M., Dubus P., Garroste J.-C., de Mascarel A., Merlio J.-P. A comparative analysis of FISH, RT-PCR, PCR, and immunohistochemistry for the diagnosis of mantle cell lymphomas. Mod. Pathol. 2002;15:517–525. doi: 10.1038/modpathol.3880556. [DOI] [PubMed] [Google Scholar]
- 15.MacConaill L.E. Existing and emerging technologies for tumor genomic profiling. J. Clin. Oncol. 2013;31:1815–1824. doi: 10.1200/JCO.2012.46.5948. [DOI] [PMC free article] [PubMed] [Google Scholar]
- 16.MacConaill L.E., Garraway L.A. Clinical implications of the cancer genome. J. Clin. Oncol. 2010;28:5219–5228. doi: 10.1200/JCO.2009.27.4944. [DOI] [PMC free article] [PubMed] [Google Scholar]
- 17.Brastianos P.K., Horowitz P.M., Santagata S., Jones R.T., McKenna A., Getz G., Ligon K.L., Palescandolo E., Van Hummelen P., Ducar M.D., et al. Genomic sequencing of meningiomas identifies oncogenic SMO and AKT1 mutations. Nat. Genet. 2013;45:285–289. doi: 10.1038/ng.2526. [DOI] [PMC free article] [PubMed] [Google Scholar]
- 18.Chmielecki J., Meyerson M. DNA sequencing of cancer: what have we learned. Annu. Rev. Med. 2014;65:63–79. doi: 10.1146/annurev-med-060712-200152. [DOI] [PubMed] [Google Scholar]
- 19.Rao A.V., Smith B.D. Are results of targeted gene sequencing ready to be used for clinical decision making for patients with acute myelogenous leukemia. Curr. Hematol. Malig. Rep. 2013;8:149–155. doi: 10.1007/s11899-013-0161-6. [DOI] [PMC free article] [PubMed] [Google Scholar]
- 20.Wagle N., Berger M.F., Davis M.J., Blumenstiel B., DeFelice M., Pochanard P., Ducar M., Hummelen P.V., MacConaill L.E., Hahn W.C., et al. High-throughput detection of actionable genomic alterations in clinical tumor samples by targeted, massively parallel sequencing. Cancer Discov. 2012;2:82–93. doi: 10.1158/2159-8290.CD-11-0184. [DOI] [PMC free article] [PubMed] [Google Scholar]
- 21.Medvedev P., Stanciu M., Brudno M. Computational methods for discovering structural variation with next-generation sequencing. Nat. Methods. 2009;6:S13–S20. doi: 10.1038/nmeth.1374. [DOI] [PubMed] [Google Scholar]
- 22.Alkan C., Coe B.P., Eichler E.E. Genome structural variation discovery and genotyping. Nat. Rev. Genet. 2011;12:363–376. doi: 10.1038/nrg2958. [DOI] [PMC free article] [PubMed] [Google Scholar]
- 23.Raphael B.J. Chapter 6: structural variation and medical genomics. PLoS Comput. Biol. 2012;8:e1002821. doi: 10.1371/journal.pcbi.1002821. [DOI] [PMC free article] [PubMed] [Google Scholar]
- 24.Li S., Li R., Li H., Lu J., Li Y., Bolund L., Schierup M.H., Wang J. SOAPindel: efficient identification of indels from short paired reads. Genome Res. 2013;23:195–200. doi: 10.1101/gr.132480.111. [DOI] [PMC free article] [PubMed] [Google Scholar]
- 25.Ye K., Schulz M.H., Long Q., Apweiler R., Ning Z. Pindel: a pattern growth approach to detect break points of large deletions and medium sized insertions from paired-end short reads. Bioinformatics. 2009;25:2865–2871. doi: 10.1093/bioinformatics/btp394. [DOI] [PMC free article] [PubMed] [Google Scholar]
- 26.Neuman J.A., Isakov O., Shomron N. Analysis of insertion-deletion from deep-sequencing data: software evaluation for optimal detection. Brief. Bioinform. 2013;14:46–55. doi: 10.1093/bib/bbs013. [DOI] [PubMed] [Google Scholar]
- 27.Wang J., Mullighan C.G., Easton J., Roberts S., Heatley S.L., Ma J., Rusch M.C., Chen K., Harris C.C., Ding L., et al. CREST maps somatic structural variation in cancer genomes with base-pair resolution. Nat. Methods. 2011;8:652–654. doi: 10.1038/nmeth.1628. [DOI] [PMC free article] [PubMed] [Google Scholar]
- 28.Yang L., Luquette L.J., Gehlenborg N., Xi R., Haseley P.S., Hsieh C.-H., Zhang C., Ren X., Protopopov A., Chin L., et al. Diverse mechanisms of somatic structural variations in human cancer genomes. Cell. 2013;153:919–929. doi: 10.1016/j.cell.2013.04.010. [DOI] [PMC free article] [PubMed] [Google Scholar]
- 29.Layer R.M., Chiang C., Quinlan A.R., Hall I.M. LUMPY: a probabilistic framework for structural variant discovery. Genome Biol. 2014;15:R84. doi: 10.1186/gb-2014-15-6-r84. [DOI] [PMC free article] [PubMed] [Google Scholar]
- 30.Hart S.N., Sarangi V., Moore R., Baheti S., Bhavsar J.D., Couch F.J., Kocher J.-P.A. SoftSearch: integration of multiple sequence features to identify breakpoints of structural variations. PLoS ONE. 2013;8:e83356. doi: 10.1371/journal.pone.0083356. [DOI] [PMC free article] [PubMed] [Google Scholar]
- 31.Kent W.J. BLAT—the BLAST-like alignment tool. Genome Res. 2002;12:656–664. doi: 10.1101/gr.229202. [DOI] [PMC free article] [PubMed] [Google Scholar]
- 32.Li H., Durbin R. Fast and accurate long-read alignment with Burrows-Wheeler transform. Bioinformatics. 2010;26:589–595. doi: 10.1093/bioinformatics/btp698. [DOI] [PMC free article] [PubMed] [Google Scholar]
- 33.Sos M.L., Michel K., Zander T., Weiss J., Frommolt P., Peifer M., Li D., Ullrich R., Koker M., Fischer F., et al. Predicting drug susceptibility of non-small cell lung cancers based on genetic lesions. J. Clin. Invest. 2009;119:1727–1740. doi: 10.1172/JCI37127. [DOI] [PMC free article] [PubMed] [Google Scholar]
- 34.Odero M.D., Zeleznik-Le N.J., Chinwalla V., Rowley J.D. Cytogenetic and molecular analysis of the acute monocytic leukemia cell line THP-1 with an MLL-AF9 translocation. Genes Chromosomes Cancer. 2000;29:333–338. [PubMed] [Google Scholar]
- 35.Chen K., Wallis J.W., McLellan M.D., Larson D.E., Kalicki J.M., Pohl C.S., McGrath S.D., Wendl M.C., Zhang Q., Locke D.P., et al. BreakDancer: an algorithm for high-resolution mapping of genomic structural variation. Nat. Methods. 2009;6:677–681. doi: 10.1038/nmeth.1363. [DOI] [PMC free article] [PubMed] [Google Scholar]
- 36.The Cancer Genome Atlas Research Network. Genomic and epigenomic landscapes of adult de novo acute myeloid leukemia. N. Engl. J. Med. 2013;368:2059–2074. doi: 10.1056/NEJMoa1301689. [DOI] [PMC free article] [PubMed] [Google Scholar]
- 37.Meyer C., Hofmann J., Burmeister T., Gröger D., Park T.S., Emerenciano M., Pombo de Oliveira M., Renneville A., Villarese P., Macintyre E., et al. The MLL recombinome of acute leukemias in 2013. Leukemia. 2013;27:2165–2176. doi: 10.1038/leu.2013.135. [DOI] [PMC free article] [PubMed] [Google Scholar]
- 38.Network T.C.G.A. Comprehensive molecular characterization of human colon and rectal cancer. Nature. 2012;487:330–337. doi: 10.1038/nature11252. [DOI] [PMC free article] [PubMed] [Google Scholar]
- 39.Langmead B., Salzberg S.L. Fast gapped-read alignment with Bowtie 2. Nat. Methods. 2012;9:357–359. doi: 10.1038/nmeth.1923. [DOI] [PMC free article] [PubMed] [Google Scholar]
Associated Data
This section collects any data citations, data availability statements, or supplementary materials included in this article.