


Abstract
We define a new category of candidate tumor drivers in cancer genome evolution: ‘selected expression regulators’ (SERs)—genes driving dysregulated transcriptional programs in cancer evolution. The SERs are identified from genome-wide tumor expression data with a novel method, namely SPARROW (SPARse selected expRessiOn regulators identified With penalized regression). SPARROW uncovers a previously unknown connection between cancer expression variation and driver events, by using a novel sparse regression technique. Our results indicate that SPARROW is a powerful complementary approach to identify candidate genes containing driver events that are hard to detect from sequence data, due to a large number of passenger mutations and lack of comprehensive sequence information from a sufficiently large number of samples. SERs identified by SPARROW reveal known driver mutations in multiple human cancers, along with known cancer-associated processes and survival-associated genes, better than popular methods for inferring gene expression networks. We demonstrate that when applied to acute myeloid leukemia expression data, SPARROW identifies an apoptotic biomarker (PYCARD) for an investigational drug obatoclax. The PYCARD and obatoclax association is validated in 30 AML patient samples.
INTRODUCTION
Cancer genome evolution is characterized by the emergence of driver mutational events, successful mutations that are swept to high frequencies within the tumor cell population (1). Selection often favors driver events that alter expression levels of entire pathways, such as inhibition of apoptosis (2), increased cell proliferation (3), acquisition of stem-cell phenotypes (4), evolved resistance to therapy (5) and adaptation to local microenvironments (6), among others. Tumors that evolve under similar selective pressures in different patients can experience similar changes in transcriptomic output (7). These selective events induce across patient dependencies between recurrent driver events shared across patients and selected changes in gene expression (Figure 1a). One can classify driver events into a variety of molecular aberrations, including mutation drivers (m-drivers), copy number aberrant drivers (c-drivers), fusion drivers (f-drivers), epigenetic drivers (epi-drivers), among others (8). We define selected expression regulators (SERs) as genes with an underlying molecular aberration which affect transcriptomic activity, where the change in transcription has a marked effect on the fitness of the tumor cell population. However, shared expression profiles across patients do not indicate which gene's expression is driving the cancer's transcriptomic state because the expression of the genes in a pathway and their driver gene(s) may all be mutually correlated (Figure 1a). We propose a method to deconvolve this mutual correlation and prioritize the genes most likely to contain the underlying driver events. To do this, we take advantage of a statistical property shared by SERs as shown in Figure 1a. If the expression of a gene is driving the expression of other genes under selection, then the correlation among those genes should be explained away once one conditions on the expression of the true driver gene. These genes under selection become ‘conditionally independent’ with respect to one another, given the SER (Figure 1a).
Figure 1.
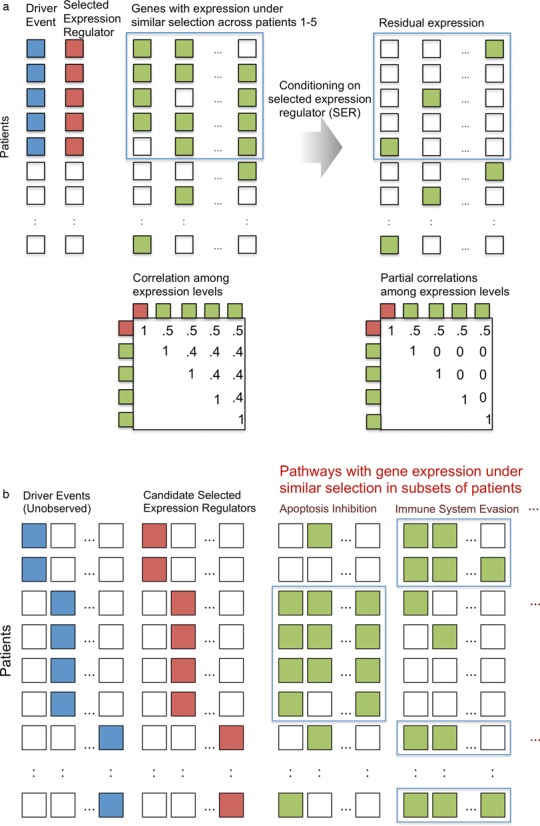
(a) Driver mutational event in a subset of patients caused by selection, with a selected expression regulator (SER) mediating the effect of the driver mutant. The SER is correlated with genes under similar selection across patients. After conditioning on the SER, the correlation among the genes disappears. (b) There are many driver events across patients that target different pathways, depending on the selection pressure in different patients. The goal is to identify which SER best explains these patterns of expression.
In this paper, we present a novel computational method, called SPARROW (SPARse selected expRessiOn regulators identified With penalized regression), to identify these SERs based purely on expression data from multiple tumor samples. Cancer genomes contain multiple pathways under selection across patients with many possible driver events (Figure 1b). To address this, we model the multifactorial nature of the transcriptomic response to selection. We assume that driver events that lead to similar outcomes in transcriptomic response for a subset of patients can be compactly represented in terms of a combined effect of a small subset of SERs (Figure 2). To identify these SERs, we use a sparse statistical model in which each gene's expression level is modeled as a linear combination of a small set of SERs. Due to high dimensionality, we consider a set of SERs consisting of expression levels of ∼3000 genes that can regulate other genes, including transcription factors, chromatin remodelers and signal transduction genes (Figure 2a). Even if the driver event is not in the same genomic location, if it has a similar effect on the expression of the SER(s) then the sparse basis will capture its transcriptomic effect. We fit a sparse basis for every gene with the SERs and determine how often an SER is chosen in the sparse basis for each gene (Figure 2b). If an SER is chosen for many genes, this increases our confidence that this SER contains (or is closely linked to) a driver event, such as a DNA mutation or epigenetic modification that is under selective pressure.
Figure 2.
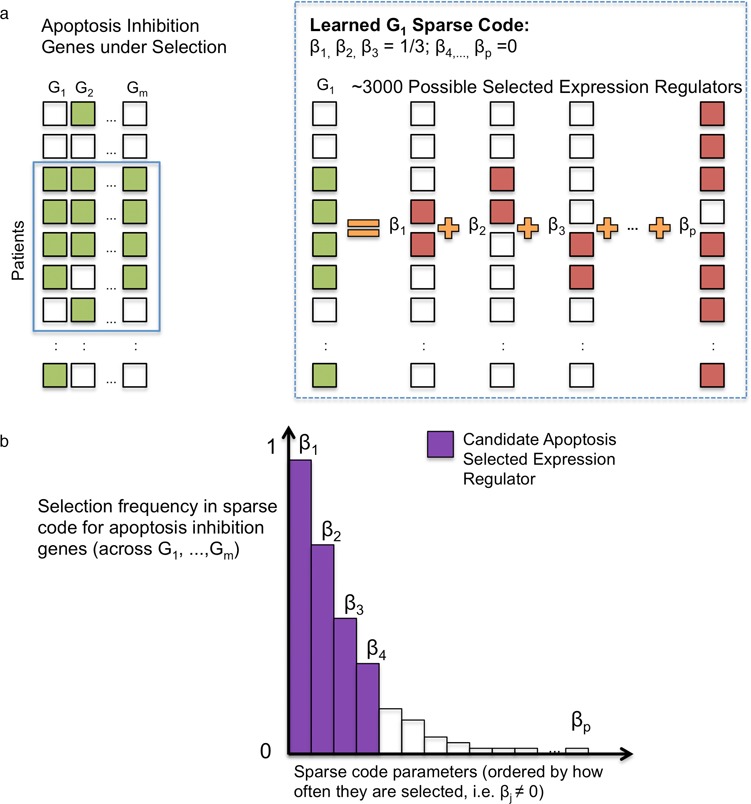
(a) We model each gene's expression as a sparse combination of a set of selected expression regulators. (b) We then identify which selected expression regulator is most frequently chosen, and prioritize those to explain the pattern of selection for the pathway or gene in question.
To fit these basis models, SPARROW uses a novel sparse regression technique. The most widely used sparse regression method is the least absolute shrinkage and selection operator (LASSO) (9). A number of authors applied LASSO to gene expression data to identify association among gene expression levels, genetic variation or complex traits (10–13). SPARROW uses a non-convex penalty with important advantages when compared to the popular convex LASSO penalty for analysis of cancer expression data. Specifically the LASSO penalty is known to choose false positives if there exist pathological correlations among variables (the irrepresentability condition (14)), whereas non-convex penalties can produce cleaner solutions, even in the presence of pathological correlations (15). We compare SPARROW with the LASSO and other methods that identify dependencies among expression variables, including two methods based on correlation, and popular network building approaches such as the algorithm for the reconstruction of accurate cellular networks (ARACNE (16)) and weighted graph correlation network analysis (WGCNA) algorithms (17).
We show that SPARROW identifies SERs with known tumor-specific cancer driver mutations in acute myeloid leukemia (AML) and glioblastoma multiforme (GBM), as compared to alternative methods to identify SERs. Attempts to identify driver genes have been extensively focused on analyzing DNA sequence data (18–22). These approaches have several major limitations: (i) there are a large number of passenger mutations; (ii) driver events may be caused by epigenetic modifications, which are not captured by DNA sequencing; and (iii) due to a large number of passenger mutations, large sample sizes are required to have sufficient power to detect driver events. SPARROW provides a complementary criterion for revealing tumor regulators under selection, which takes downstream effects of drivers on genome-wide expression into account. We also show in AML that SERs are enriched for association with survival, apoptotic regulation and myeloid differentiation regulators. Finally, we determine that the gene PYCARD is the most highly ranked apoptotic SER in AML, and show that PYCARD expression is predictive of response to obatoclax, a pan-inhibitor of antiapoptotic BCL2 family, in tissue cultured from patients.
The resulting SERs for each gene in AML and GBM, the implementation of SPARROW and the data used in the study are freely available on our website http://sparrow-leelab.cs.washington.edu/.
MATERIALS AND METHODS
Microarray data processing
Raw cell intensity files (CEL) for Affymetrix U133 Plus 2.0 and U133A arrays (Affymetrix, Santa Clara, CA, USA) for gene expression data collected from patient bone marrow were retrieved from Gene Expression Omnibus (23) for accessions: GSE12417 (24) (AML), GSE14468 (25) (AML), GSE10358 (26) (AML) and GSE13159 (27) (AML, chronic lymphoblastic leukemia (CLL), childhood acute lymphoblastic leukemia (cALL), myelodysplastic syndrome (MDS)). Expression data were then processed using MAS5.0 normalization with the ‘Affy’ bioconductor package (28) and mapped to Entrez gene annotations (29) using custom chip definition files (CDF) (30). After the initial normalization and mapping to gene level expression levels, arrays were organized into groups based on the date the array was processed, which is encoded within the raw CEL data file for each sample. This temporal grouping was treated as a proxy for possible systematic biases in expression variation driven by batch effects. The ComBat batch effect correction algorithm (31) was then applied to each data set treating each grouping as a batch to correct for these possible batch effects. Dates where there was only one array processed were dropped from all data sets. MAS5.0 normalized intensities were natural log transformed prior to batch effect correction. For the GBM data from The Cancer Genome Atlas, Agilent g4502a gene expression data were accessed from Firehose for the 02–15 run (http://gdac.broadinstitute.org/runs/stddata__2014_02_15/data/GBM/20140215/). All normal samples were removed, and plate level batch effects were corrected with ComBat.
Learning SERs
Prior to combining the data across studies, all genes in each individual data set were scaled to have mean zero and variance one. After combining all patients with normal karyotype AML there were 682 patients with gene expression data for 17778 genes on the Affymetrix U133 Plus 2.0 platform (Affymetrix, Santa Clara, CA, USA). Similarly, there are 447, 235 and 206 patients for CLL, cALL and MDS, respectively. For the GBM data there are 502 patients and 17814 gene expression variables. We focused on a set of 3460 SERs, out of which 3052 are present in the Affymetrix U133 Plus 2.0 data. These SERs included transcription factors, chromatin modifiers and other regulatory factors similar to the list proposed by Gentles et al. (32), 2993 of which are in the GBM data set. The full lists of SERs are provided in Supplementary Note 1.
SPARROW SERs
Cancer expression data contain complex correlation patterns due to the effect of selection on many different pathways in many different patients (1) (Figure 1b). In order to identify SERs, we developed a new method to filter out false positives in a sparse linear regression model. Specifically, we used the variational Bayesian spike regression (VBSR) model (33) as a baseline model and developed new methods to filter out false positives, by incorporating a data adaptive method for choosing the penalty parameter that does not require cross validation. The spike regression model is a Bayesian approximation of best subset selection. In this case, the best subset selection would be the choice of a subset of a fixed number of SERs, out of all possible SERs, that best explain the observed gene expression pattern of a given gene across patients. This is a difficult combinatorial problem, therefore we approach it with a variational Bayes approximation that treats the inclusion of any given SER in the regression model probabilistically. The variational Bayes approximation introduces additional probabilistic constraints that make inference extremely efficient (34).
The main novelty of our approach is the choice of the size of the subset of SERs to be used in the model. Previous work on the spike regression model suggested not only a posterior probability of inclusion in the model for each SER but also a statistic that measures the significance of a given SER in a given subset regression model (33). Yet the previous work also required a computationally expensive path search to determine an optimal best subset size to ensure that the null distribution of the test statistic for each feature was well calibrated (i.e. normally distributed). If the best subset size is too large, then there are too many features in the model given the sample size, and the test-statistics becomes inflated. Alternatively if the best subset size is too small, then there is the possibility of missing out on true associations. In this new version, we derive a fast analytical method to determine the best subset size to ensure that the test statistic is well calibrated without losing too many associations. This is a non-trivial problem, where many previous authors use ad hoc methods such as cross validation to choose the analog of this model complexity parameter (35).
For each of the 17 788 genes we fit the following model  , where
  is the expression level of the kth gene for the ith patient for
  patients and
  genes,
  is a normally distributed error term (assuming independent and identically distributed errors),
  is the expression level of the jth SER for the ith patient and
  is the additive effect of the expression of the jth SER on the expression of the kth gene.
In addition, we implement the spike regression algorithm proposed by Logsdon et al. (33), where  . The spike penalty is an improper prior, with a hyper-parameter,
  , determining the prior probability that each
  is non-zero. We define an alternative parametrization of
  with support
  ,
,  , This alternative parametrization motivates a new method for choosing
  as a function of the number of SERs (m) and patients (n).
We propose to choose the penalty parameter for a given data set that is computationally efficient,  . This corresponds to
  . The speed up of the algorithm is significant, with a single run taking 10–100 times faster than the approach of Logsdon et al. (29). This makes the algorithm very computationally efficient, and scales approximately as O(nm). The most computationally expensive step is the choice of the number of restarts, but empirically there did not seem to be much gained by looking at more than 12 restarts. This choice of penalty parameter has F as the cumulative distribution function of a
  random variable, with n patients, m SERs and
  . In the variational Bayes spike regression model each
  coefficient has both a posterior probability of association and a Z-statistic. The posterior probability of a coefficient bounds the influence of the variable within the model, e.g. if the posterior probability is zero, then the SER will have no effect on the gene in question, and if the posterior probability is one, then the SER will have a full un-penalized effect. The Z-statistic is a measure of the significance of the
  parameter given the rest of the fitted model. The above choice of prior probability
  corresponds to calibrating the posterior probability for any given
  to be 0.95 when its Z-statistic passes a Bonferroni correction for the total number of features—in this case a family-wise error rate of 0.05. This choice of penalty parameter allows us to still use the feature level Z-statistic proposed by Logsdon et al. (29), but without the computationally expensive path search over
  , by having SERs whose association passes a Bonferroni correction contribute at least 95% of their maximal possible effect to the model. We found empirically that this choice of penalty parameter led to maximum power in the model with little to none inflation of the test statistic.
Accordingly, we define the sparse basis for each gene given the SERs in each individual regression model with  , with
  being the Z-statistic for the effect of the jth SER on the kth target gene from the fitted spike model. For the SPARROW method, the driver sets are constructed after applying a Bonferroni correction across the driver genes of all models (0.05/(3052 × 17788) = 9.2 × 10⁻¹⁰) to fix the family-wise error rate to 0.05 across every SER basis. The SPARROW and VBSR algorithms are freely available from CRAN (http://cran.r-project.org), and our project website (http://leelab-data.cs.washington.edu/sparrow.R).
LASSO SERs
As with SPARROW, for the LASSO we use a penalized regression methodology that identifies SERs for each gene. We solve the following lasso optimization (8) problem  with two different strategies for the choice of the penalty parameter
  for each gene's SER basis. The first strategy chooses the
  that minimizes the 10-fold cross validation mean-squared error. The second strategy chooses the
  that produces a cross validation mean-squared error one standard deviation from the minimum mean-squared error, where the standard deviation is estimated across cross validation folds. All models are fit using the glmnet R-package (36). The lasso bases are defined as
  , where the SER scores computed based on how often each SER has a non-zero coefficient.
Correlation and WGCNA SERs
Correlation SERs are inferred using a correlation network approach. In general, we use the number of edges an SER has in an inferred network as its SER score. A correlation network is constructed similarly to the hard thresholding WGCNA method of Langfelder and Hovarth (16), where we test for the marginal dependence between each SER and each target gene using an additive linear model assuming independent and identically normally distributed errors  ,
,  . The additive effect
  is estimated using the maximum likelihood estimator,
  , and the null hypothesis
  is tested using the standard Wald test to produce a t-statistic
  for each
  . We then construct the network using two different strategies. For the Correlation1 strategy, we construct a network by applying a Bonferroni correction for
  tests to each pairwise test. The Correlation1 SERs for the kth gene are defined as
  , with G being the cumulative density function of a
  distributed random variable. For the second method of building the network (Correlation2), we choose a threshold for
  such that the sparsity of the entire correlation network is equivalent to the sparsity identified by the SPARROW bases across all genes. All estimates and test statistics are produced using the ‘lm’ function in R. We also construct a soft thresholded network similar to WGCNA with the scale free rule (16), where the absolute value of the correlation coefficients between SERs and each gene are raised to a power. The power is chosen to make the network as scale free as possible.
ARACNE SERs
We estimated a network using the ARACNE algorithm to generate ARACNE SER scores (16). The ARACNE network first estimates a non-parametric joint probability density using a Gaussian kernel between each pair of genes in the data set,  , where
  indicates a standard bivariate normal density function. The mutual information defined by this estimated density is
  . The ARACNE algorithm then tests whether each pairwise mutual information is significant, and defines an edge between two genes when the mutual information is significant. Finally, for all triplets of genes with significant pairwise mutual information, the data processing inequality is used to prune away edges where a gene d-separates two other genes. The network that is produced after applying the data processing inequality to all triplets of genes is then the final ARACNE network. We used the adaptive partitioning option to speed up the run-time of the algorithm, and we set a significance cutoff based on a Bonferroni correction as with the SPARROW and correlation methods for
  . We treated the SERs as transcription factors in the ARACNE method, where edges between two non-transcription factor genes will not be removed by the data processing inequality unless the third gene is a transcription factor. This allows a fair comparison to the regression methods that focus only on the edges for SERs.
SER definitions
For the ith SER, the SER score  was computed as
  , where
  is a parameter indicating whether the ith SER is used in the bases for the jth gene, for k (SPARROW, LASSO1, LASSO2, Correlation1, Correlation2, ARACNE). For the soft thresholding WGCNA method, the SER score was defined as
  with
with  being the ith SER,
  the jth gene and
  the soft-thresholding parameter chosen to make the network as scale free as possible. SER scores define a ranking of SERs, where there is no absolute cutoff.
Sparse SER simulation
To test the performance of the SPARROW methods compared to the LASSO methods we simulated genes under selection using the expression data from 682 patients for the 3052 SERs in AML. Genes were simulated by independently selecting SERs with either a probability 3.9 × 10⁻³ or 1.6 × 10⁻², such that the expected number of SERs (p) was either E[p] = 12 or E[p] = 50. The effects of the selected drivers were sampled from an independent and identically distributed (i.i.d.) standard normal distribution. The expected pattern of expression for the simulated gene was computed as the linear combination of sampled drivers weighted by the sampled effects, with an i.i.d. error standard normal error term added. This process was replicated 100 times. Additionally, for the result shown in Figure 3 we also simulated a model with E[p] = 50, and the percentage variation explained by the regression model constrained to 80% to compare the performance of SPARROW and LASSO.
Figure 3.
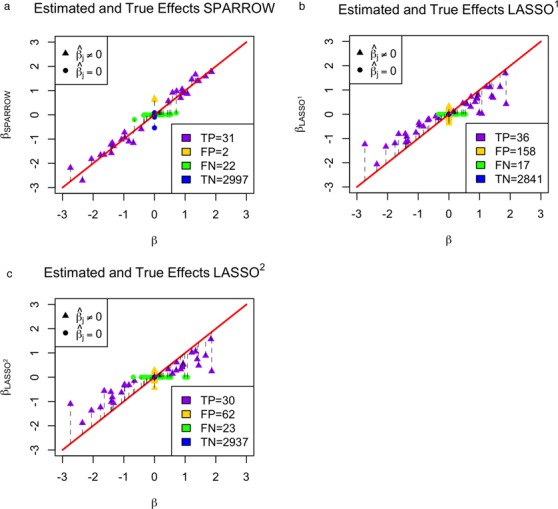
Using the 3052 candidate SERs, we ran a simulation where 53 of the 3052 SERs had true effects sampled from a standard normal distribution. (a) True regression coefficients plotted against estimated regression coefficients with the SPARROW algorithm. True positives (TP), false positives (FP), false negatives (FN) and true negatives (TN) are also shown. (b) True regression coefficients plotted against the estimated coefficients with the LASSO1 algorithm. (c) True regression coefficients plotted against the estimated coefficients with the LASSO2 algorithm.
Survival analyses
We ran all survival analyses by fitting a Cox proportional hazards model (37). The log partial likelihood for a Cox proportional hazards function is defined as  , where Yi is the observed time for observation i,
  indicates that an event occurred at time
  ,
,  indicates censoring at time Y,
  is the vector of covariates for observation
  , and
, and  as the log hazard ratios for the vector of covariates. The log partial likelihood is maximized using the ‘coxph’ function from the survival package in R (38). The reported test statistic for each covariate's log hazard ratio
  is generated using a Wald test based on the fitted model.
Random effects model
We tested the aggregate association between the variation in the top 100 SERs and the expression of each gene with the following probabilistic model  , where
  indicates that SER j is in the top 100 SERs for all methods. The null hypothesis
  is tested using a random effects score test as implemented in the Sequence Kernel Association Test R package (39) using uniform weights and a linear kernel matrix.
Enrichment tests
All enrichments for gene sets are computed with Fisher's exact test. The enrichments are calculated relative to the entire set of SERs. All receiver operating characteristic (ROC) curves and area under the curves (AUCs) are calculated using the ROCR R-package (40). We used the Malacards and Genecards database (41) to generate disease-specific gene lists for AML, cALL, CLL and MDS (see Supplementary Note 1). The Malacards and Genecards database contains aggregated gene annotations from 59 sources (41). For the cancer driver gene list we used the genes annotated by the Cancer Gene Census (CGC) (42), which are identified as having evidence from multiple independent sources as being cancer drivers. For the tumor-specific drivers, we use the 23 genes identified as AML drivers (43) and 67 genes identified as GBM drivers (8). For SERS from AML (43) we also looked at the 260 genes with tier 1 mutations in at least two patients, 68 genes with tier 1 mutations in at least three patients and 37 genes with tier 1 mutations in at least four patients. Apoptosis and myeloid regulator gene sets are shown in the Supplementary Note 1. For the survival enrichments we calculated a one-sided Kolmogorov–Smirnov (KS) test for the top  SERs for each method based on the distribution of marginal P-values from a survival analysis compared to the distribution of survival P-values of all SERs. To correct for the inflation in the KS test due to correlation between genes we generated an empirical null distribution of P-values for all 17 788 genes for 10 000 permutations of survival time and censoring. We then re-computed the KS test statistic using the null permutations to determine the corrected survival enrichment for the hubs from each network reconstruction method. Additionally, for the ROC curve for the survival enrichment, the set of genes nominally associated with survival based on a Cox proportional hazards model (P-value <0.01) was used among all 3052 candidate SERs.
Leukemic stem cell score
We computed the leukemic stem cell (LSC) score using the weights provided by Gentles et al. (44), for 28 of the 31 genes. These weights were applied to the training data after each gene was standardized to have mean zero and variance one.
Expression and drug sensitivity profiling of 30 AML patient samples
We profiled drug-induced cytotoxicity of an initial sample set of 30 viably cryopreserved primary AML specimens for which detailed clinical information on patients was available, including age, gender, cytogenetics, mutation status, antecedent hematologic disorder, initial blast count, initial platelet count, treatment regimen, response and survival. Screens of the drug sensitivity of primary AML samples was performed after thawing samples in the presence of DNAase followed by short-term culture (48 h) in media containing horse serum and fetal calf serum and low level hSCF (10 ng/ml), followed by density gradient centrifugation to prepare blast-enriched fractions with high (80–90%) viability and high blast fraction, ≥80–90. Blast-enriched cell fractions were plated in 384 well plates coated with matrix peptide at a density of 5000 cells/well. Once plated cells were treated with obatoclax at eight different concentrations ranging from the nanomolar to low micromolar range (3.3 × 10⁻⁹, 1.0 × 10⁻⁸, 3.3 × 10⁻⁸, 1.0 × 10⁻⁷, 3.3 × 10⁻⁷, 1.0 × 10⁻⁶, 3.3 × 10⁻⁶, 1.0 × 10⁻⁵). Viability was assessed after 4 days in culture using CellTiterGlo. These screens were performed, at the Quellos HTS Core (http://depts.washington.edu/uwhts/) at the UW's Institute for Stem Cell and Regenerative Medicine (ISCRM). RNA expression profiles of primary AML samples were performed in parallel at the UW Center for Ecogenetics and Environmental Health using the Affymetrix HU133 Plus 2.0 platform.
Microarray data processing for AML patients with drug sensitivity
Gene expression data were collected on the Affymetrix U133 Plus 2.0 platform (Affymetrix, Santa Clara, CA, USA) for bone marrow samples from these 30 patients. As with the public AML data, expression data were first processed using a MAS5.0 normalization (28), and then probes were mapped to Entrez gene annotations (25) with the help of custom CDF (30). Potential batch effects were corrected using the ComBat algorithm (31) based on the three batches the arrays were run in. Signal intensities were natural log transformed prior to batch effect correction.
Curve fitting to estimate drug sensitivity profiles
Nonlinear curve fitting was performed using MATLAB's ‘nlinfit’ function. After curve fitting, summary statistics were extracted based on the curve fits similar to the Cancer Cell Line Encyclopedia (CCLE) (45), including the activity area (AA), AUC, IC50, EC50 and Amax. Batch effects were corrected using ComBat (31) for each drug sensitivity summary based on the five batches that experiments were run in for the 30 patients. Curve fits for 30 patients are shown in Supplementary Figure S1.
PYCARD and obatoclax association tests
Associations between PYCARD expression and obatoclax sensitivity in patients were tested with either a standard linear regression model (with the ‘lm’ function in R) or a robust regression model (using the ‘rlm’ function from the MASS package in R (46)) for the five drug sensitivity summaries. Both expression data and drug sensitivity data were Winsorized at the 95% percentiles of the distributions. The robust regression method uses an M-estimator to decrease the influence of outliers on the test-statistic for the additive effect in a regression model (46). To control for a possible confounding factor, whether or not a patient achieved a complete response (CR) from the therapy they were given (not obatoclax) was included in the model.
RESULTS
Methods overview
To identify SERs, we fit our sparse learning algorithm (SPARROW) using ∼3000 SERs in expression data from AML, GBM, cALL, CLL and MDS patients. Candidate SERs were chosen from transcription factors, chromatin modifiers or regulators and signal transduction genes (32), since regulatory genes are attractive targets of selection for modulating expression of entire pathways (32,47). We prioritize SERs that are most frequently chosen in the sparse representations across all genes as more likely to drive tumor-specific evolution. To test the performance of our method, we compare highly ranked SERs of SPARROW with those of alternative statistical models that fall into four categories. These categories include models that leverage sparse conditional dependence relationships (SPARROW, LASSO1,2), conditional dependence (ARACNE), marginal dependence (Correlation1) and sparse marginal dependence (WGCNA, Correlation2). For the LASSO we implement two versions where the second version is sparser than the first. Details are presented in the Materials and Methods section.
Superior sparse estimation from SPARROW algorithm compared to LASSO
Similar to previous work (33,48,49), the SPARROW algorithm outperforms the LASSO algorithm with two different metrics for choosing the sparsity of the LASSO regression model. The two tuning parameter selection approaches for the LASSO include minimum 10-fold cross validation error and the 1 standard deviation rule (36). We see in Figure 3a that the SPARROW estimates for a simulated test case with 53 true SERs among 3052 candidates using the gene expression data from AML show improved performance compared to the LASSO estimates (Figure 3b and c), in terms of both the number of false positives (2 versus 158 and 62) and the bias in the regression coefficients. The LASSO method is known to produce biased estimates of the non-zero coefficients, especially those with large effects (14). Hence why the slope of the line is less than unity for the LASSO (where a slope of unity is the expectation in the case of an unbiased estimator).
AML mutation drivers
Recently, 23 genes with driver mutations were identified in AML within The Cancer Genome Atlas (43) (Supplementary Note 1). Driver mutations were defined as genes with a mutation frequency that was greater than the background mutation rate, as determined with the MuSiC suite of tools (50). Sixteen of these 23 genes were in our candidate SERs of 3052 genes in AML, and we see significant enrichment of these 16 AML drivers among the top 500 ranked SERs from the SPARROW method (P-value: 4.1 × 10⁻⁶, enrichment fold: 3.8) (Figure 4a), as well as the best classification performance (AUC = 0.82). The only other method with comparable performance is LASSO2 (P-value: 8.9 × 10⁻³, enrichment fold: 2.3) while the other approaches performed poorly at prioritizing genes with driver mutations. To test a larger gene set of candidate SERs in AML, we also tested for enrichment of genes mutated in at least two, three or four patients in the TCGA data set (Figure 4b–d). The enrichments and significance of the tests increase with the frequency of recurrent mutation. This supports our hypothesis that SERs are more likely to be genes that are under similar shared selection across patients, and therefore more likely to be recurrently mutated in their DNA.
Figure 4.
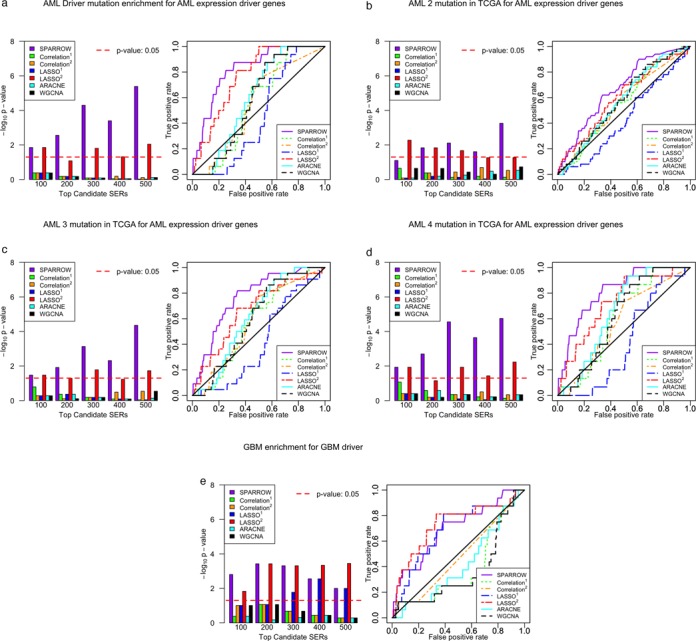
(a) Enrichment of 23 genes with driver mutation in AML in SERs estimated with seven different methods, along with receiver operating characteristic (ROC) curves. (b) Enrichment of 260 genes mutated in at least two patients in TCGA AML study. (c) Enrichment of 68 genes mutated in at least three patients in TCGA AML study. (d) Enrichment of 37 genes mutated in at least four patients in TCGA AML study. (e) Enrichment of 67 genes with driver mutation in TCGA GBM study for SERs inferred in TCGA GBM.
GBM mutation drivers
To verify the enrichment for driver genes in another cancer, we investigated the TCGA GBM expression data. Over 65 genes with driver mutations were identified in GBM by Frattini et al., with the MutComFocal algorithm (8). Of these genes, 16 were in the candidate SER list (Supplementary Note 1). We similarly tested for enrichment of these 16 known drivers among the inferred SERs, and found significant enrichment for SPARROW in the top 100 (P-value: 1.6 × 10⁻³, enrichment fold: 5.6) (Figure 4e). In this scenario, LASSO2 was more competitive with SPARROW, though only the sparse conditional methods (LASSO, SPARROW) were able to efficiently identify SERs enriched for known driver mutations.
Leukemic SERs
To further investigate the SERs in leukemia, we applied SPARROW to two other leukemias (cALL, CLL) and MDS (which frequently progresses to AML) using data from the Microarray Innovations in LEukemia (MILE) study (27). Leukemias and lymphomas are aggressive malignancies, characterized by the accumulation of immature blasts that fail to differentiate into the appropriate effector cells of erythropoiesis, lymphopoiesis and myelopoiesis. Many leukemia driver genes are also known regulators of normal hematopoiesis or myeloid regulators (43). To test the hypothesis that leukemia SERs were more likely to be myeloid regulators, we tested for enrichment of 17 myeloid regulators in the top SERs (Supplementary Note 1). There is significant enrichment across AML, cALL, CLL and MDS for these myeloid regulators, especially for the SPARROW methods. For example, the SPARROW enrichments for the top 500 SERs in AML, cALL, CLL and MDS had P-values of 1.4 × 10⁻¹⁰, 9.3 × 10⁻⁷, 3 × 10⁻³, 1.4 × 10⁻¹⁰ and enrichment folds: 5, 3.9, 2.5 and 5, respectively (Supplementary Figure S2A–D). We tested for enrichment of gene sets specific to each leukemia based on Malacards and Genecards (41), and also saw statistically significant but modest enrichments, especially with SPARROW SERs (Supplementary Figure S3A–D), with P-values: 3.1 × 10⁻¹⁰, 2.3 × 10⁻², 4 × 10⁻⁵, 6.2 × 10⁻³ and enrichment folds: 1.7, 1.4, 1.5 and 1.4 for AML, cALL, CLL and MDS, respectively, among top 500 SPARROW SERs. Finally there is a nominal association for enrichment of genes identified in the CGC (42,51), a gold standard of general cancer driver genes, though these genes are not necessarily specific to the leukemias in question (Supplementary Figure S4A–D), P-values: 3.4 × 10⁻⁴, 3.4 × 10⁻³, 3.4 × 10⁻³, 6.3 × 10⁻⁴ enrichment folds: 1.5, 1.4, 1.4 and 1.5 for AML, cALL, CLL and MDS, respectively, among top 500 SPARROW SERs.
Comparison of methods for identifying SERs in AML
We have shown that the SERs identified by SPARROW outperform standard correlation or convex penalized regression (LASSO) approaches in identifying genes with known or potential driver roles (Figure 4 and Supplementary Figures S2–S4). In addition we also show the AUC for all of these results in Supplementary Table S1. All methods have different orderings of SERs, as shown in pairwise plots of SER scores (Supplementary Figure S5). We predict that genes whose expression is driving the underlying tumor disease processes will be highly associated with the entire cancer transcriptome. To test this hypothesis, we took the top 100 SERs for each method in AML and tested whether their joint variation was significantly associated with variation for all genes (see the Materials and Methods section for further details). The distribution of P-values across all genes from this test is shown in Supplementary Figure S6. The SPARROW methods produce the most significant associations between top SERs and genome-wide gene expression (paired Mann–Whitney test P-value <2.2 × 10⁻¹⁶ for all pairwise comparisons between SPARROW and other methods).
We predict that selection will favor fundamentally sparse bases. The summary statistics for the SER inference are shown in Supplementary Table S2. The SPARROW methods have both the sparsest median bases size (4) and median frequency that a given SER is used in a basis (24). To test whether SPARROW is under-powered or the data support sparse SER bases, we simulated 100 replicates of gene expression data using 12 or 50 randomly SERs in the AML data (Supplementary Table S3). We find that the SPARROW method is well powered to identify denser bases given the data (power 86% and 82%, respectively). This suggests that the number of SERs for any given gene is quite sparse and that the sparsity assumption leveraged by SPARROW is the key to identifying the SERs. The other sparsity methods (LASSO) have similar power to SPARROW but with higher false discovery rates (0.65–0.86) as compared to SPARROW (0.005–0.03). The genes downstream of each SER identified by SPARROW were tested for enrichment among canonical signaling pathways (52), and a diverse range of processes was identified (Supplementary Note 2). Enriched processes were not shared across SERs, suggesting that each SER is a unique indicator of sets of genes under selection in a subset of patients.
AML SERs are associated with patient prognosis
Next, we tested whether the expression levels of the identified SERs were more likely to be significantly associated with overall survival using Cox proportional hazards regression. For the GBM data we did not observe a significant enrichment for association with survival (results not shown), though the variation in survival for the TCGA GBM is much smaller (with patients doing uniformly poorly) than in AML, so there may be less signal to detect. In AML we modeled overall survival in several independent patient cohorts (24,26,53) using expression of each SERs as predictors with age, NPM1 mutation status and FLT3 mutation status as covariates. We then computed a KS test statistic to test for an inflation in the top univariate P-values from the top ranked SERs with respect to the empirical distribution of P-values (see the Materials and Methods section for further details). This method of testing for survival enrichment was performed to test if there was still enrichment for association with survival after correcting for correlation among the top ranked SERs for each method. Figure 5a shows the permutation P-values from this KS enrichment test as a function of the SER ranking for the alternative methods. Only the SPARROW method passes the empirical P-value threshold of 0.05. In Figure 5b the ROC curves are shown for the prediction of survival associated genes (P-value <0.01) based on the SER scores, where the highly ranked SPARROW SERs are most likely to be associated with survival. This method shows that even when not correcting for correlation among genes, SPARROW still outperforms the other methods for survival enrichment. The AUC for these ROC curves along with the AUC excluding known m-drivers and candidate c-drivers in AML is shown in Supplementary Figure S7. We see that the SPARROW method has the best AUC, and none of the methods are greatly affected by the exclusion of genes with known AML driver mutations or copy number aberrations. This result implies that SERs selected by SPARROW tend to be important in determining the aggressiveness of tumor.
Figure 5.
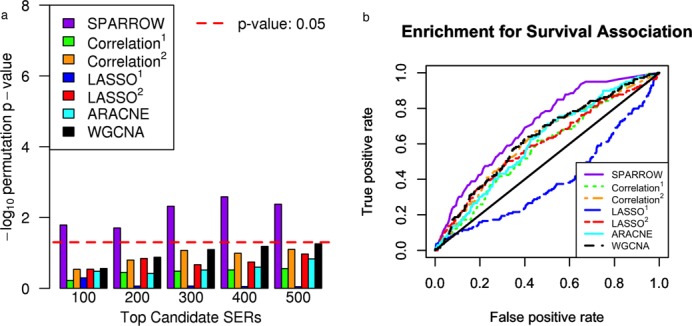
(a) Association with overall survival in AML for top SERs across the seven methods. Permutation P-value computed over 10 000 permutations. (b) Receiver operating characteristic (ROC) curves for survival associated genes (Cox proportional hazards P-value <0.01) and SER scores.
Gentles et al. (44) identified a strongly prognostic LSC gene expression signature in patients with AML. Out of the top 400 SPARROW SERs, 36% (143) were significantly positively correlated with the LSC signature (after a Bonferroni correction for 400 tests). In contrast, genome-wide only 21% of genes were positively associated with the LSC signature at the same significance threshold. The correlation with the LSC signature was also significantly correlated with the Z-scores from the Cox proportional hazards models (P-value: 1.1 × 10⁻⁵). In addition, the mean –log10(P-value) from the Cox proportional hazards model for the top 400 SPARROW SERs is 0.87 ± 0.086, whereas genome-wide the mean –log10(P-value) is 0.62 ± 9.6 × 10⁻³, also indicating that the top SERs are enriched for genes associated with processes relevant to survival, including leukemic stemness. Out of the top 400 SPARROW SERs, 31 were significantly marginally associated with overall survival at an False Discovery Rate (FDR) of 0.05, as shown in Supplementary Table S4. This is a 21.5-fold increase over the proportion of significant associations among all 3052 candidate SERs (11 at an FDR of 0.05).
Top scoring AML SERs
The list of top scoring SERs included several genes with known regulatory roles in AML. These included FLT3 (Fms-like tyrosine kinase 3), activating mutations of which a significant fraction of AMLs, usually by internal tandem duplications. It is believed to play a key role in early hematopoiesis. IRF8, PTPN22, CEBPA and RUNX3 have been identified as targets of the AML-ETO fusion protein generated by the common t (8;21) (q22;q22) translocation (54), and CEBPA has recently been used to define a clinically relevant subgroup of AML wherein double mutations in CEBPA confer better patient survival (53). Five genes (IRF8, ELF4, RUNX3, FLT3, RAB37) are bound by the PML-RARA (55) t(15;17) translocation that characterizes the M3 subtype of AML (acute promyelocytic leukemia), and fuses the retinoic acid receptor (RARA) to the promyelocytic leukemia gene PML.
Notably, the first and third highest scoring SERs (RAB37 and RAB27A) are both Rab GTPases and members of the Ras superfamily. Their specific role in the context of AML is unknown. However Rab GTPases regulate nitric oxide signaling through their effect on soluble guanylate cyclase (56). The gene GUCY1A3 (encoding Guanylate cyclase soluble subunit alpha-3) is one of the most highly expressed on LSC versus LPC, and high expression is significantly associated with poor outcomes. The selection of RAB37 and RAB27A as drivers together with the apparent importance of GUCY1A3 to LSC biology suggests further study. The fourth and fifth most highly scoring genes encode for zinc finger proteins. ZNF521 (also known as early hematopoietic zinc finger protein, EZHF) is highly expressed in early hematopoietic cell types and is significantly expressed in many AMLs (57). Its deregulation has been postulated to play a role in hematopoietic cancers. Less is known about ZNF185, but roles have been suggested for it in cellular differentiation and regulation of proliferation of chronic myelogenous leukemia cells.
Apoptotic SERs in AML
Dysregulation and inhibition of apoptosis is a critical feature of cancer, and in leukemias in particular. BCL-2 family genes with anti-apoptotic functions are commonly mutated or overexpressed in leukemias (58). Of 84 known apoptosis genes (59), 30 were SERs. We found that these 30 apoptosis regulators were more likely to be SERs in AML by SPARROW than those identified by other methods, especially in the top 500 SPARROW SERs (P-value: 5.7 × 10⁻³, enrichment fold: 2) (Supplementary Figure S8). The gene-set sizes and enrichments for this result and for the other main gene-sets tested in AML are shown in Supplementary Table S5. The top three ranked apoptosis SERs based on SPARROW are PYCARD, CASP1 and DAPK1. Since PYCARD is relatively poorly characterized, particularly in the context of AML, we focused on it in further analyses.
The apoptotic SER PYCARD is a potential biomarker for obatoclax
PYCARD is known to play an important role in multiple cellular processes, including inflammation through the formation of the inflammasome (60), and mitochondrial driven apoptosis (61). We functionally analyzed the genes that selected PYCARD in their sparse SER basis. There were four distinct clusters after clustering these genes based on expression (Mclust R package (62); Supplementary Figure S9). We tested the clusters for enrichment with Gene Ontology (63) and found that the two largest clusters were enriched for immune response (q-value: 2.5 × 10⁻¹⁵) and mitochondria genes (q-value: 4.8 × 10⁻²⁹), respectively; see Supplementary Note S3.
The PYCARD protein is known to directly activate CASP9 and BAX. In addition, BCL-2 genes are known anti-apoptotic factors that inhibit normal BAX function (58) (Supplementary Figure S10). We hypothesize that if BCL-2 activity is reduced, PYCARD expression could be a marker for apoptosis induced by BAX. Because of its high ranking as an apoptotic SER in AML among the apoptotic regulators, along with PYCARD's role in BAX regulation, we hypothesized that PYCARD expression is associated with response to therapy for the anti-apoptosis BCL-2 inhibitor obatoclax in patients with AML. To test this hypothesis, we assayed both genome-wide gene expression levels of 30 patients with AML on the Affymetrix U133 Plus 2.0 platform (Affymetrix, Santa Clara, CA, USA) along with in vitro drug sensitivity to obatoclax in leukemic tissue cultured from these 30 patients. The AA (area above the dosage response curve), AUC (area below the dosage response curve), Amax (maximum inhibition response observed), IC50 (concentration that gives 50% inhibition) and EC50 (concentration that gives 50% inhibition between maximum and minimum response) were estimated using a curve-fitting algorithm for blast counts at varying concentrations of obatoclax (see the Materials and Methods section).
We tested for association between response to obatoclax and PYCARD expression across 30 patients with both OLS (ordinary least squares) and robust regression models (see the Materials and Methods section). The drug sensitivity measure of IC50 had the strongest evidence for an association (Table 1 and Figure 6) with a negative effect −0.37 (95% CI: [−0.7,−0.032], P-value: 0.04) for the association with PYCARD for the robust regression model. The negative effect suggests higher expression of PYCARD is indicative of increased sensitivity to obatoclax. To control for possible confounding in terms of patients who were good responders to the therapy they were given (not the in vitro response) versus poor responders, we controlled for CR in the regression model and found that it increased the evidence of association between PYCARD and obatoclax with a conditional effect of −0.43 (95% CI: [−0.7,−0.16], P-value: 0.0029). The good responders (CR = 1) tended to have higher in vitro resistance to obatoclax with an effect 0.59 (95% CI: [0.33, 0.85], P-value: 0.000077) in the robust regression model (Table 1 and Figure 6). While Amax has little evidence of association (Supplementary Table S6 and Supplementary Figure S11), the other drug sensitivity measures EC50, AA and AUC do have consistent evidence of association (Supplementary Tables S7–S9 and Supplementary Figures S12–S14). Additionally, to further test the robustness of PYCARD as a good biomarker and SER, we performed a joint test of association with survival and association with Obatoclax, and meta-analyzed the results (Supplementary Table S10) for the top 400 SPARROW SERs. We can see that PYCARD has by far the strongest association with both survival and response to Obatoclax therapy. Among the set of 3052 candidate SERs, only 17 had more significant associations with Obatoclax than PYCARD, but none of them showed as significant association with survival. Additionally, PYCARD had the highest SER score among those genes as well. Finally, among all 17 788 genes, 70 had more significant associations with Obatoclax than PYCARD, but none of these genes were as associated with survival and PYCARD.
Table 1. Association between expression of PYCARD and response to obatoclax therapy for the log10 IC50 estimated from obatoclax dosage response curves.
| log10 IC50 | Patients (n = 30) | ||
|---|---|---|---|
| Model | Variable | β (95% CI) | P-value |
| Univariate OLS | PYCARD | −0.37 (−0.71, −0.032) | 0.033 |
| Bivariate OLS | PYCARD | −0.45 (−0.73, −0.17) | 0.0025 |
| CR | 0.52 (0.25, 0.79) | 0.00051 | |
| Univariate robust | PYCARD | −0.38 (−0.74, −0.019) | 0.04 |
| Bivariate robust | PYCARD | −0.43 (−0.7, −0.16) | 0.0029 |
| CR | 0.59 (0.33,0.85) | 0.000077 | |
We used two regression methods, ordinary least squares (OLS) and robust regression, to test for an association between PYCARD expression and obatoclax sensitivity. To control for potential, a potential confounder in terms of good versus poor responders, whether or not the patient experienced a complete response (CR) from the therapy they were given (in this case not obatoclax) was also included in the model.
Figure 6.
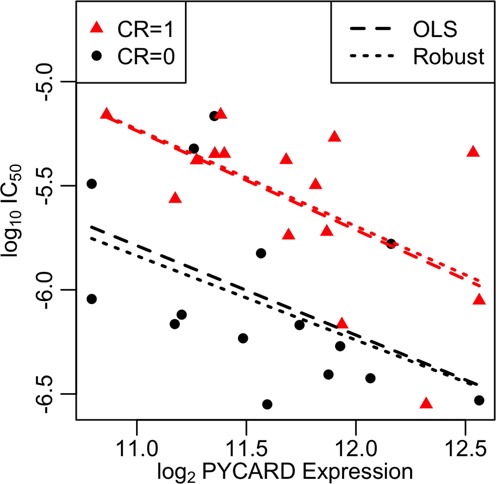
Association between expression of PYCARD and response to obatoclax therapy in terms of log10 IC50 estimated from obatoclax dosage response curves. The linear best fit lines are shown for the good responders (CR = 1) and the poor responders (CR = 0).
DISCUSSION
As the main contribution of this paper we provide new criteria based on expression patterns to identify transcriptional regulators under selection and driving tumor progression. We define the genes under selective pressure that drive genome-wide expression changes as SERs, and propose a new statistical method, called SPARROW, to identify SERs based on gene expression data. SPARROW can identify genes with known driver mutations more accurately than similar methods based on the LASSO, and other popular approaches to learn gene association relationships from expression data. These results are driven by a new sparse regression technique we developed, which dramatically reduces false discovery rates compared to the LASSO.
The SPARROW method is designed to reveal vastly fewer false positives when considering sparse regression models across multiple genes as compared to methods like the LASSO, as shown in Figure 3. This reduction in the number of false positive edges will illuminate which genes are truly more conditionally dependent across all genes (i.e. the genes that have high SPARROW SER scores). We posit that dependencies among genes are generated by disease relevant processes, such as the effect of driver events on gene expression (Figures 1 and 2). This makes SPARROW SERs much more sensitive to genes that are driving some aspect of the disease process, and therefore may be more important when considering patient outcomes, such as overall survival.
Selective pressure is an important criterion for understanding gene function, evolutionary processes and the basis of complex traits (64). There are many methods to estimate selection from DNA sequences in the field of evolutionary biology, population genetics and cancer biology (65). SPARROW is the first method to identify genes that are enriched for driver mutations purely from expression data. Existing approaches focus on the DNA sequence data, where SPARROW improves on these approaches in multiple ways. First, the majority of somatic mutations identified in tumor genomes are passenger mutations. Second, SPARROW can estimate the importance of a given gene on genome-wide expression levels, which may be more functionally relevant to the tumor biology (7). Finally, driver events in cancer may occur at different levels such as with epigenetic modifications, which are not detected by DNA sequencing.
Based on the SPARROW analysis, we propose that PYCARD expression is a potential biomarker for in vitro response to obatoclax. Obatoclax is a pan-inhibitor of antiapoptotic members of the BCL2 family of proteins, which control the intrinsic or mitochondrial pathway of apoptosis (66). It is a BH3 mimetic with activity against all of the antiapoptotic BCL2 family members (67), thus it is a ‘pan’ BCL2 antagonist. Obatoclax demonstrated activity against AML cell lines and primary cells, causing cell cycle blockade at S-G2 at lower concentrations, and inducing apoptosis at higher concentrations (68). In contrast to other BCL2 inhibitors, it has activity against MCL1, and maintained activity in the absence of BAK/BAX, implying other mechanisms of action (68). Given we predict PYCARD is an SER of overall apoptosis in AML, we expect that it would be applicable to a broadly acting anti-apoptotic drug like obatoclax. Furthermore, obatoclax synergized with other agents, including the BCL-2 inhibitor ABT737, the FLT3 inhibitor sorafenib and the chemotherapy drug cytarabine to induce apoptosis (69). In combination with sorafenib, it reduced tumor formation in a xenograft mouse model with demonstrated downregulation of MCL1 (68). Given obatoclax's potency in combination with orthogonal therapies, having a biomarker for obatoclax efficacy could potentially improve patient prognosis by informing patient selection for combination therapy involving obatoclax.
SUPPLEMENTARY DATA
Supplementary Data are available at NAR Online.
Acknowledgments
We would like to acknowledge James Annis, Timothy Martins and Sylvia Chien for their contributions to the gene expression and in vitro drug sensitivity data generation. We would also like to thank two anonymous reviewers for their comments that significantly improved the quality of the manuscript. The results shown here are in part based upon data generated by the TCGA Research Network: http://cancergenome.nih.gov/.
FUNDING
National Institutes of Health [T32 HL 007312 to B.L.; U54 CA1149145 to A.G.]; National Science Foundation [DBI-1355899 to S.L.]; Life Sciences Discovery Fund [2070888-01]; Philanthropic funding from Norman Metcalfe. Funding for open access charge: University of Washington.
Conflict of interest statement. None declared.
REFERENCES
- 1.Greaves M., Maley C.C. Clonal evolution in cancer. Nature. 2012;481:306–313. doi: 10.1038/nature10762. [DOI] [PMC free article] [PubMed] [Google Scholar]
- 2.Evan G.I., Vousden K.H. Proliferation, cell cycle and apoptosis in cancer. Nature. 2001;411:342–348. doi: 10.1038/35077213. [DOI] [PubMed] [Google Scholar]
- 3.Wood L.D., Parsons D.W., Jones S., Lin J., Sjöblom T., Leary R.J., Shen D., Boca S.M., Barber T., Ptak J., et al. The genomic landscapes of human breast and colorectal cancers. Science. 2007;318:1108–1113. doi: 10.1126/science.1145720. [DOI] [PubMed] [Google Scholar]
- 4.Clevers H. The cancer stem cell: premises, promises and challenges. Nat. Med. 2011;17:313–319. doi: 10.1038/nm.2304. [DOI] [PubMed] [Google Scholar]
- 5.Ding L., Ley T.J., Larson D.E., Miller C.A., Koboldt D.C., Welch J.S., Ritchey J.K., Young M.A., Lamprecht T., McLellan M.D., et al. Clonal evolution in relapsed acute myeloid leukaemia revealed by whole-genome sequencing. Nature. 2012;481:506–510. doi: 10.1038/nature10738. [DOI] [PMC free article] [PubMed] [Google Scholar]
- 6.Anderson A.R.A., Weaver A.M., Cummings P.T., Quaranta V. Tumor morphology and phenotypic evolution driven by selective pressure from the microenvironment. Cell. 2006;127:905–915. doi: 10.1016/j.cell.2006.09.042. [DOI] [PubMed] [Google Scholar]
- 7.Guinney J., Ferté C., Dry J., McEwen R., Manceau G., Kao K.J., Chang K.-M., Bendtsen C., Hudson K., Huang E., et al. Modeling RAS phenotype in colorectal cancer uncovers novel molecular traits of RAS dependency and improves prediction of response to targeted agents in patients. Clin. Cancer Res. 2014;20:265–272. doi: 10.1158/1078-0432.CCR-13-1943. [DOI] [PMC free article] [PubMed] [Google Scholar]
- 8.Frattini V., Trifonov V., Chan J.M., Castano A., Lia M., Abate F., Keir S.T., Ji A.X., Zoppoli P., Niola F., et al. The integrated landscape of driver genomic alterations in glioblastoma. Nat. Genet. 2013;45:1141–1149. doi: 10.1038/ng.2734. [DOI] [PMC free article] [PubMed] [Google Scholar]
- 9.Tibshirani R. Regression shrinkage and selection via the lasso. J. R. Stat. Soc. Ser. B. 1996;58:267–288. [Google Scholar]
- 10.Lee S.-I., Dudley A.M., Drubin D., Silver P.A., Krogan N.J., Pe'er D., Koller D. Learning a prior on regulatory potential from eQTL data. PLoS Genet. 2009;5:e1000358. doi: 10.1371/journal.pgen.1000358. [DOI] [PMC free article] [PubMed] [Google Scholar]
- 11.Lee S., Chatalbashev V., Vickrey D., Koller D. Learning a meta-level prior for feature relevance from multiple related tasks; Proceedings of the 24th Annual International Conference on Machine Learning (ICML 2007); NY: ACM; 2007. pp. 489–496. [Google Scholar]
- 12.Kim S., Xing E.P. Tree-guided group lasso for multi-response regression with structured sparsity, with an application to eQTL mapping. Ann. Appl. Stat. 2012;6:1095–1117. [Google Scholar]
- 13.Jojic V., Shay T., Sylvia K., Zuk O., Sun X., Kang J., Regev A., Koller D., Best A.J., Knell J., et al. Identification of transcriptional regulators in the mouse immune system. Nat. Immunol. 2013;14:633–643. doi: 10.1038/ni.2587. [DOI] [PMC free article] [PubMed] [Google Scholar]
- 14.Yu B. On model selection consistency of lasso. J. Mach. Learn. Res. 2006;7:2541–2563. [Google Scholar]
- 15.Zhang C.-H. Nearly unbiased variable selection under minimax concave penalty. Ann. Stat. 2010;38:894–942. [Google Scholar]
- 16.Margolin A.A., Nemenman I., Basso K., Wiggins C., Stolovitzky G., Dalla Favera R., Califano A. ARACNE: an algorithm for the reconstruction of gene regulatory networks in a mammalian cellular context. BMC Bioinformatics. 2006;7(Suppl. 1):S7. doi: 10.1186/1471-2105-7-S1-S7. [DOI] [PMC free article] [PubMed] [Google Scholar]
- 17.Langfelder P., Horvath S. WGCNA: an R package for weighted correlation network analysis. BMC Bioinformatics. 2008;9:559. doi: 10.1186/1471-2105-9-559. [DOI] [PMC free article] [PubMed] [Google Scholar]
- 18.Gonzalez-Perez A., Lopez-Bigas N. Functional impact bias reveals cancer drivers. Nucleic Acids Res. 2012;40:e169. doi: 10.1093/nar/gks743. [DOI] [PMC free article] [PubMed] [Google Scholar]
- 19.Getz G., Höfling H., Mesirov J.P., Golub T.R., Meyerson M., Tibshirani R., Lander E.S. Comment on ‘The consensus coding sequences of human breast and colorectal cancers’. Science. 2007;317:1500. doi: 10.1126/science.1138764. [DOI] [PubMed] [Google Scholar]
- 20.Tan H., Bao J., Zhou X. A novel missense-mutation-related feature extraction scheme for ‘driver’ mutation identification. Bioinformatics. 2012;28:2948–2955. doi: 10.1093/bioinformatics/bts558. [DOI] [PMC free article] [PubMed] [Google Scholar]
- 21.Hou J.P., Ma J. DawnRank: discovering personalized driver genes in cancer. Genome Med. 2014;6:56. doi: 10.1186/s13073-014-0056-8. [DOI] [PMC free article] [PubMed] [Google Scholar]
- 22.Carter H., Chen S., Isik L., Tyekucheva S., Velculescu V.E., Kinzler K.W., Vogelstein B., Karchin R. Cancer-specific high-throughput annotation of somatic mutations: computational prediction of driver missense mutations. Cancer Res. 2009;69:6660–6667. doi: 10.1158/0008-5472.CAN-09-1133. [DOI] [PMC free article] [PubMed] [Google Scholar]
- 23.Barrett T., Wilhite S.E., Ledoux P., Evangelista C., Kim I.F., Tomashevsky M., Marshall K.A., Phillippy K.H., Sherman P.M., Holko M., et al. NCBI GEO: archive for functional genomics data sets–update. Nucleic Acids Res. 2013;41:D991–D995. doi: 10.1093/nar/gks1193. [DOI] [PMC free article] [PubMed] [Google Scholar]
- 24.Metzeler K.H., Hummel M., Bloomfield C.D., Spiekermann K., Braess J., Sauerland M.-C., Heinecke A., Radmacher M., Marcucci G., Whitman S.P., et al. An 86-probe-set gene-expression signature predicts survival in cytogenetically normal acute myeloid leukemia. Blood. 2008;112:4193–4201. doi: 10.1182/blood-2008-02-134411. [DOI] [PMC free article] [PubMed] [Google Scholar]
- 25.Noordermeer S.M., Sanders M.A., Gilissen C., Tönnissen E., van der Heijden A., Döhner K., Bullinger L., Jansen J.H., Valk P.J.M., van der Reijden B.A. High BRE expression predicts favorable outcome in adult acute myeloid leukemia, in particular among MLL-AF9-positive patients. Blood. 2011;118:5613–5621. doi: 10.1182/blood-2011-06-359182. [DOI] [PubMed] [Google Scholar]
- 26.Tomasson M.H., Xiang Z., Walgren R., Zhao Y., Kasai Y., Miner T., Ries R.E., Lubman O., Fremont D.H., McLellan M.D., et al. Somatic mutations and germline sequence variants in the expressed tyrosine kinase genes of patients with de novo acute myeloid leukemia. Blood. 2008;111:4797–4808. doi: 10.1182/blood-2007-09-113027. [DOI] [PMC free article] [PubMed] [Google Scholar]
- 27.Kohlmann A., Kipps T.J., Rassenti L.Z., Downing J.R., Shurtleff S.A., Mills K.I., Gilkes A.F., Hofmann W.-K., Basso G., Dell'orto M.C., et al. An international standardization programme towards the application of gene expression profiling in routine leukaemia diagnostics: the Microarray Innovations in LEukemia study prephase. Br. J. Haematol. 2008;142:802–807. doi: 10.1111/j.1365-2141.2008.07261.x. [DOI] [PMC free article] [PubMed] [Google Scholar]
- 28.Gautier L., Cope L., Bolstad B.M., Irizarry R.A. affy–analysis of Affymetrix GeneChip data at the probe level. Bioinformatics. 2004;20:307–315. doi: 10.1093/bioinformatics/btg405. [DOI] [PubMed] [Google Scholar]
- 29.Maglott D., Ostell J., Pruitt K.D., Tatusova T. Entrez Gene: gene-centered information at NCBI. Nucleic Acids Res. 2011;39:D52–D57. doi: 10.1093/nar/gkq1237. [DOI] [PMC free article] [PubMed] [Google Scholar]
- 30.Dai M., Wang P., Boyd A.D., Kostov G., Athey B., Jones E.G., Bunney W.E., Myers R.M., Speed T.P., Akil H., et al. Evolving gene/transcript definitions significantly alter the interpretation of GeneChip data. Nucleic Acids Res. 2005;33:e175. doi: 10.1093/nar/gni179. [DOI] [PMC free article] [PubMed] [Google Scholar]
- 31.Johnson W.E., Li C., Rabinovic A. Adjusting batch effects in microarray expression data using empirical Bayes methods. Biostatistics. 2007;8:118–127. doi: 10.1093/biostatistics/kxj037. [DOI] [PubMed] [Google Scholar]
- 32.Gentles A.J., Alizadeh A.A., Lee S.-I., Myklebust J.H., Shachaf C.M., Shahbaba B., Levy R., Koller D., Plevritis S.K. A pluripotency signature predicts histologic transformation and influences survival in follicular lymphoma patients. Blood. 2009;114:3158–3166. doi: 10.1182/blood-2009-02-202465. [DOI] [PMC free article] [PubMed] [Google Scholar]
- 33.Logsdon B.A., Carty C.L., Reiner A.P., Dai J.Y., Kooperberg C. A novel variational Bayes multiple locus Z-statistic for genome-wide association studies with Bayesian model averaging. Bioinformatics. 2012;28:1–7. doi: 10.1093/bioinformatics/bts261. [DOI] [PMC free article] [PubMed] [Google Scholar]
- 34.Carbonetto P., Stephens M. Scalable variational inference for Bayesian variable selection in regression, and its accuracy in genetic association studies. Bayesian Anal. 2012;7:73–108. [Google Scholar]
- 35.Usai M.G., Goddard M.E., Hayes B.J. LASSO with cross-validation for genomic selection. Genet. Res. (Camb.) 2009;91:427–436. doi: 10.1017/S0016672309990334. [DOI] [PubMed] [Google Scholar]
- 36.Friedman J., Hastie T., Tibshirani R. Regularization paths for generalized linear models via coordinate descent. J. Stat. Softw. 2010;33:1–22. [PMC free article] [PubMed] [Google Scholar]
- 37.Cox D.R. Regression models and life-tables. J. R. Stat. Soc. Ser. B Methodol. 1972;34:187–220. [Google Scholar]
- 38.Therneau T.M., Grambsch P.M. Modeling survival data: extending the Cox model. NY: Springer; 2000. [Google Scholar]
- 39.Wu M.C., Lee S., Cai T., Li Y., Boehnke M., Lin X. Rare-variant association testing for sequencing data with the sequence kernel association test. Am. J. Hum. Genet. 2011;89:82–93. doi: 10.1016/j.ajhg.2011.05.029. [DOI] [PMC free article] [PubMed] [Google Scholar]
- 40.Sing T., Sander O., Beerenwinkel N., Lengauer T. ROCR: visualizing classifier performance in R. Bioinformatics. 2005;21:3940–3941. doi: 10.1093/bioinformatics/bti623. [DOI] [PubMed] [Google Scholar]
- 41.Rappaport N., Nativ N., Stelzer G., Twik M., Guan-Golan Y., Stein T.I., Bahir I., Belinky F., Morrey C.P., Safran M., et al. MalaCards: an integrated compendium for diseases and their annotation. Database. 2013:bat018. doi: 10.1093/database/bat018. [DOI] [PMC free article] [PubMed] [Google Scholar]
- 42.Futreal P.A., Coin L., Marshall M., Down T., Hubbard T., Wooster R., Rahman N., Stratton M.R. A census of human cancer genes. Nat. Rev. Cancer. 2004;4:177–183. doi: 10.1038/nrc1299. [DOI] [PMC free article] [PubMed] [Google Scholar]
- 43.The Cancer Genome Atlas Research Network. Genomic and epigenomic landscapes of adult de novo acute myeloid leukemia. N. Engl. J. Med. 2013;368:2059–2074. doi: 10.1056/NEJMoa1301689. [DOI] [PMC free article] [PubMed] [Google Scholar]
- 44.Gentles A.J., Plevritis S.K., Majeti R., Alizadeh A.A. Association of a leukemic stem cell gene expression signature with clinical outcomes in acute myeloid leukemia. JAMA. 2010;304:2706–2715. doi: 10.1001/jama.2010.1862. [DOI] [PMC free article] [PubMed] [Google Scholar]
- 45.Barretina J., Caponigro G., Stransky N., Venkatesan K., Margolin A.A., Kim S., Wilson C.J., Lehár J., Kryukov G. V., Sonkin D., et al. The Cancer Cell Line Encyclopedia enables predictive modelling of anticancer drug sensitivity. Nature. 2012;483:603–607. doi: 10.1038/nature11003. [DOI] [PMC free article] [PubMed] [Google Scholar]
- 46.Huber P.J. Robust statistics. Statistics. 2004;60:1–11. [Google Scholar]
- 47.Segal E., Shapira M., Regev A., Pe'er D., Botstein D., Koller D., Friedman N. Module networks: identifying regulatory modules and their condition-specific regulators from gene expression data. Nat. Genet. 2003;34:166–176. doi: 10.1038/ng1165. [DOI] [PubMed] [Google Scholar]
- 48.Logsdon B.A., Hoffman G.E., Mezey J.G. A variational Bayes algorithm for fast and accurate multiple locus genome-wide association analysis. BMC Bioinformatics. 2010;11:58. doi: 10.1186/1471-2105-11-58. [DOI] [PMC free article] [PubMed] [Google Scholar]
- 49.Logsdon B.A., Hoffman G.E., Mezey J.G. Mouse obesity network reconstruction with a variational Bayes algorithm to employ aggressive false positive control. BMC Bioinformatics. 2012;13:53. doi: 10.1186/1471-2105-13-53. [DOI] [PMC free article] [PubMed] [Google Scholar]
- 50.Dees N.D., Zhang Q., Kandoth C., Wendl M.C., Schierding W., Koboldt D.C., Mooney T.B., Callaway M.B., Dooling D., Mardis E.R., et al. MuSiC: identifying mutational significance in cancer genomes. Genome Res. 2012;22:1589–1598. doi: 10.1101/gr.134635.111. [DOI] [PMC free article] [PubMed] [Google Scholar]
- 51.Forbes S.A., Bindal N., Bamford S., Cole C., Kok C.Y., Beare D., Jia M., Shepherd R., Leung K., Menzies A., et al. COSMIC: mining complete cancer genomes in the Catalogue of Somatic Mutations in Cancer. Nucleic Acids Res. 2011;39:D945–D950. doi: 10.1093/nar/gkq929. [DOI] [PMC free article] [PubMed] [Google Scholar]
- 52.Liberzon A., Subramanian A., Pinchback R., Thorvaldsdóttir H., Tamayo P., Mesirov J.P. Molecular signatures database (MSigDB) 3.0. Bioinformatics. 2011;27:1739–1740. doi: 10.1093/bioinformatics/btr260. [DOI] [PMC free article] [PubMed] [Google Scholar]
- 53.Wouters B.J., Löwenberg B., Erpelinck-Verschueren C.A.J., van Putten W.L.J., Valk P.J.M., Delwel R. Double CEBPA mutations, but not single CEBPA mutations, define a subgroup of acute myeloid leukemia with a distinctive gene expression profile that is uniquely associated with a favorable outcome. Blood. 2009;113:3088–3091. doi: 10.1182/blood-2008-09-179895. [DOI] [PMC free article] [PubMed] [Google Scholar]
- 54.Tonks A., Pearn L., Musson M., Gilkes A., Mills K.I., Burnett A.K., Darley R.L. Transcriptional dysregulation mediated by RUNX1-RUNX1T1 in normal human progenitor cells and in acute myeloid leukaemia. Leukemia. 2007;21:2495–2505. doi: 10.1038/sj.leu.2404961. [DOI] [PubMed] [Google Scholar]
- 55.Martens J.H.A., Brinkman A.B., Simmer F., Francoijs K.-J., Nebbioso A., Ferrara F., Altucci L., Stunnenberg H.G. PML-RARalpha/RXR alters the epigenetic landscape in acute promyelocytic leukemia. Cancer Cell. 2010;17:173–185. doi: 10.1016/j.ccr.2009.12.042. [DOI] [PubMed] [Google Scholar]
- 56.Raines K.W., Bonini M.G., Campbell S.L. Nitric oxide cell signaling: S-nitrosation of Ras superfamily GTPases. Cardiovasc. Res. 2007;75:229–239. doi: 10.1016/j.cardiores.2007.04.013. [DOI] [PubMed] [Google Scholar]
- 57.Bond H.M., Mesuraca M., Carbone E., Bonelli P., Agosti V., Amodio N., De Rosa G., Di Nicola M., Gianni A.M., Moore M.A.S., et al. Early hematopoietic zinc finger protein (EHZF), the human homolog to mouse Evi3, is highly expressed in primitive human hematopoietic cells. Blood. 2004;103:2062–2070. doi: 10.1182/blood-2003-07-2388. [DOI] [PubMed] [Google Scholar]
- 58.Youle R.J., Strasser A. The BCL-2 protein family: opposing activities that mediate cell death. Nat. Rev. Mol. Cell Biol. 2008;9:47–59. doi: 10.1038/nrm2308. [DOI] [PubMed] [Google Scholar]
- 59.Le X.-F., Mao W., He G., Claret F.-X., Xia W., Ahmed A.A., Hung M.-C., Siddik Z.H., Bast R.C. The role of p27(Kip1) in dasatinib-enhanced paclitaxel cytotoxicity in human ovarian cancer cells. J. Natl. Cancer Inst. 2011;103:1403–1422. doi: 10.1093/jnci/djr280. [DOI] [PMC free article] [PubMed] [Google Scholar]
- 60.Proell M., Gerlic M., Mace P.D., Reed J.C., Riedl S.J. The CARD plays a critical role in ASC foci formation and inflammasome signalling. Biochem. J. 2013;449:613–621. doi: 10.1042/BJ20121198. [DOI] [PMC free article] [PubMed] [Google Scholar]
- 61.Motani K., Kawase K., Imamura R., Kinoshita T., Kushiyama H., Suda T. Activation of ASC induces apoptosis or necrosis, depending on the cell type, and causes tumor eradication. Cancer Sci. 2010;101:1822–1827. doi: 10.1111/j.1349-7006.2010.01610.x. [DOI] [PMC free article] [PubMed] [Google Scholar]
- 62.Fraley C., Raftery A.E., Murphy T.B., Scrucca L. Technical report no. 597. University of Washington, Department of Statistics; 2012. mclust version 4 for R: normal mixture modeling for model-based clustering, classification, and density estimation; pp. 1–57. [Google Scholar]
- 63.Ashburner M., Ball C.A., Blake J.A., Botstein D., Butler H., Cherry J.M., Davis A.P., Dolinski K., Dwight S.S., Eppig J.T., et al. Gene ontology: tool for the unification of biology. The Gene Ontology Consortium. Nat. Genet. 2000;25:25–29. doi: 10.1038/75556. [DOI] [PMC free article] [PubMed] [Google Scholar]
- 64.Nielsen R. Molecular signatures of natural selection. Annu. Rev. Genet. 2005;39:197–218. doi: 10.1146/annurev.genet.39.073003.112420. [DOI] [PubMed] [Google Scholar]
- 65.Siepel A., Bejerano G., Pedersen J.S., Hinrichs A.S., Hou M., Rosenbloom K., Clawson H., Spieth J., Hillier L.D.W., Richards S., et al. Evolutionarily conserved elements in vertebrate, insect, worm, and yeast genomes. Genome Res. 2005;15:1034–1050. doi: 10.1101/gr.3715005. [DOI] [PMC free article] [PubMed] [Google Scholar]
- 66.Basit F., Cristofanon S., Fulda S. Obatoclax (GX15–070) triggers necroptosis by promoting the assembly of the necrosome on autophagosomal membranes. Cell Death Differ. 2013;20:1161–1173. doi: 10.1038/cdd.2013.45. [DOI] [PMC free article] [PubMed] [Google Scholar]
- 67.Zhai D., Jin C., Satterthwait A.C., Reed J.C. Comparison of chemical inhibitors of antiapoptotic Bcl-2-family proteins. Cell Death Differ. 2006;13:1419–1421. doi: 10.1038/sj.cdd.4401937. [DOI] [PubMed] [Google Scholar]
- 68.Konopleva M., Watt J., Contractor R., Tsao T., Harris D., Estrov Z., Bornmann W., Kantarjian H., Viallet J., Samudio I., et al. Mechanisms of antileukemic activity of the novel Bcl-2 homology domain-3 mimetic GX15–070 (obatoclax) Cancer Res. 2008;68:3413–3420. doi: 10.1158/0008-5472.CAN-07-1919. [DOI] [PMC free article] [PubMed] [Google Scholar]
- 69.Rahmani M., Aust M.M., Attkisson E., Williams D.C., Ferreira-Gonzalez A., Grant S. Inhibition of Bcl-2 antiapoptotic members by obatoclax potently enhances sorafenib-induced apoptosis in human myeloid leukemia cells through a Bim-dependent process. Blood. 2012;119:6089–6098. doi: 10.1182/blood-2011-09-378141. [DOI] [PMC free article] [PubMed] [Google Scholar]
Associated Data
This section collects any data citations, data availability statements, or supplementary materials included in this article.