


Abstract
Activated naive CD4+ T cells are highly plastic cells that can differentiate into various T helper (Th) cell fates characterized by the expression of effector cytokines like IFN-γ (Th1), IL-4 (Th2) or IL-17A (Th17). Although previous studies have demonstrated that epigenetic mechanisms including DNA demethylation can stabilize effector cytokine expression, a comprehensive analysis of the changes in the DNA methylation pattern during differentiation of naive T cells into Th cell subsets is lacking. Hence, we here performed a genome-wide methylome analysis of ex vivo isolated naive CD4+ T cells, Th1 and Th17 cells. We could demonstrate that naive CD4+ T cells share more demethylated regions with Th17 cells when compared to Th1 cells, and that overall Th17 cells display the highest number of demethylated regions, findings which are in line with the previously reported plasticity of Th17 cells. We could identify seven regions located in Il17a, Zfp362, Ccr6, Acsbg1, Dpp4, Rora and Dclk1 showing pronounced demethylation selectively in ex vivo isolated Th17 cells when compared to other ex vivo isolated Th cell subsets and in vitro generated Th17 cells, suggesting that this unique epigenetic signature allows identifying and functionally characterizing in vivo generated Th17 cells.
INTRODUCTION
After egress from the thymus, naive CD4+ T cells circulate through secondary lymphoid organs via the blood stream and lymphatics. Unless being stimulated, these cells remain in a naive state. However, activation by antigen-presenting cells (APC) offering their cognate antigen plus appropriate co-stimulatory signals initiates a differentiation program, leading to the development of highly specialized T helper (Th) cell lineages (1). Initially, two subsets named Th1 and Th2 were identified (2,3), which are involved in the induction of cellular and humoral immune responses to eliminate intracellular and extracellular pathogens, respectively. Th1 cells are generated in a microenvironment containing the cytokines interleukin (IL)-12 and interferon-γ (IFN-γ), which causes the upregulation of the lineage specification factor T-bet and finally results in the expression of high levels of the effector cytokine IFN-γ at the end of the differentiation process (4). In contrast, Th2 differentiation is initiated via triggering of the IL-4 receptor or via Notch-driven signals (5). After upregulation of the lineage specification factor GATA3, Th2 cells start to produce the effector cytokines IL-4, IL-5 and IL-13. More recently, Th17 cells were identified as a novel Th cell subset (6,7) that is regulated by the transcription factors, RORγt and RORα (8). Th17 cells secrete several cytokines, including IL-17A, IL-17F and granulocyte-macrophage colony-stimulating factor (GM-CSF), are involved in the defence of extracellular bacterial infections and together with Th1 cells can cause autoimmune disorders (9,10).
Fully differentiated Th1 and Th2 cells show a remarkable memory of their cytokine expression patterns (11). Detailed studies of the corresponding cytokine and lineage specification factor loci revealed that this stability is achieved by epigenetic processes (12). In Th1 cells, IFN-γ expression is promoted by permissive histone modifications and DNA demethylation of Ifng and Tbx21 (13–18), whereas expression of the Th2-specific gene cluster (Il4, Il5, Il13 and Rad50) is suppressed by repressive histone modifications as well as DNA methylation (16,19). In contrast, Th2 cells display permissive histone modifications and DNA demethylation at the Th2-specific gene cluster as well as repressive histone modifications and DNA methylation of Ifng and Tbx21 (16,20–22). Similarly, in Th17 cells the promoter regions of Il17a, Il17f and Rorc are associated with permissive histone modifications and show signs of pronounced DNA demethylation (16,17,23–25), which is in line with the reported stability of IL-17A expression in ex vivo isolated Th17 cells (26). However, in contrast to Th1 and Th2 cells, where the differentiation from naive T cells is considered to be an irreversible event, accumulating evidence suggests that Th17 cells have a greater degree of flexibility in their differentiation options and are more plastic (27). Particularly under inflammatory conditions, Th17 cells can further differentiate and switch toward Th1-and Th2-like cells (co)expressing IFN-γ and IL-4, respectively (28–33).
Although genome-wide histone modification maps of naive CD4+ T cells and in vitro generated Th cell subsets were previously generated to better understand the complexity of T cell differentiation (16), a global analysis of epigenetic changes at the DNA methylation level during these processes is still missing. Thus, we here performed a genome-wide methylome analysis of naive CD4+ T cells, Th1 and Th17 cells. Since previous studies have revealed significant differences between the methylomes of ex vivo isolated Foxp3+ regulatory T cells (Tregs) and in vitro generated, TGF-β-induced Tregs (34,35), we solely used ex vivo isolated Th cell subsets for the epigenetic profiling. While we could demonstrate that the methylome of naive CD4+ T cells shows closer similarity with Th17 cells when compared to Th1 cells, we also observed that Th17 cells display an even increased number of demethylated regions when compared to naive CD4+ T cells, suggesting that epigenetic processes at the DNA methylation level control the high plasticity of Th17 cells. Seven Th17-specific epigenetic signature genes could be identified, showing pronounced demethylation only in ex vivo isolated Th17 cells, but neither in other ex vivo isolated Th cell subsets nor in in vitro generated Th17 cells, suggesting that these genes play an important role for the functional properties of in vivo generated Th17 cells.
MATERIALS AND METHODS
Mice
Aged female Balb/c mice (>6 months) or female C57Bl/6 mice (6–8 weeks old) were purchased from Charles River and Janvier, respectively. Foxp3-IRES-mRFP (FIR) mice (36) (6–12 weeks old) were bred in-house (Helmholtz Centre for Infection Research, Braunschweig, Germany). All animal experiments were performed under specific pathogen-free conditions and in accordance with institutional, state and federal guidelines.
Flow cytometry
Flow cytometric analyses were performed on a LSR II or LSR Fortessa (BD Biosciences). Dead cells were excluded from analyses by using LIVE/DEAD fixable Blue dead cell stain kit (Invitrogen) according to the manufacturer's instructions. Data were analyzed using the FlowJo software (Tree Star, Inc.).
Ex vivo isolation of naive T cells, cytokine-producing Th cell subsets and Tregs
CD4+ T cells were enriched from spleen and lymph nodes of aged female Balb/c mice by magnetic-activated cell sorting (MACS) using anti-CD4 MicroBeads and the autoMACS magnetic separation system (Miltenyi Biotec). Enriched CD4+ T cells were stimulated for 3 h with phorbol 12-myristate 13-acetate (PMA; 10 ng/ml, Sigma-Aldrich) and ionomycin (500 ng/ml, Sigma-Aldrich), followed by the labeling of IL-17A and/or IFN-γ-secreting cells using the IL-17A and IFN-γ secretion assay kit (Miltenyi Biotec) according to the manufacturer's instructions. Subsequently, the cells were stained with fluorochrome-conjugated anti-CD3 (145-2C11), CD4 (RM4-5) and CD45RB (C363.16A) antibodies. Th17 cells (CD3+CD4+CD45RBlowIL-17A+IFN-γ−), Th1 cells (CD3+CD4+CD45RBlowIL-17A−IFN-γ+), Th-mem cells (CD3+CD4+CD45RBlowIL-17A−IFN-γ−) and naive CD4+ T cells (CD3+CD4+CD45RBhighIL-17A−IFN-γ−) were sorted by fluorescence-activated cell sorting (FACS) on a FACSAria II (BD Biosciences). Purities of sorted populations ranged between 97% and 99%. Tregs were sorted from the same source as CD3+CD4+CD25high cells (anti-CD25 antibody PC61.5) and subsequently stimulated with the same concentration of PMA/ionomycin for 3 h. Treg purity was confirmed by intracellular staining for Foxp3 (FJK-16S), IL-17A (eBio17B7) and IFN-γ (XMG1.2) using the Foxp3 transcription factor staining buffer set (eBioscience).
Ex vivo isolation of immune cell subsets
CD11b+ or CD11b− cells were separated from spleen and lymph nodes of aged female Balb/c mice using APC-conjugated anti-CD11b (M1/70), anti-APC MicroBeads and the autoMACS magnetic separation system (Miltenyi Biotec). MACS-separated CD11b− cells were labeled with antibodies against CD3 (145–2C11), CD4 (RM4–5), CD8 (53–6.7), B220 (RA3–6B2), γδTCR (eBioGL3) and sorted into B cells (CD3−B220+), CD8+ T cells (CD3+B220−CD4−CD8+), CD4+ T cells (CD3+CD4+CD8−) and γδ T cells (CD3+CD4−CD8−γδTCR+). MACS-separated CD11b+ cells were stained with antibodies against CD11b, CD11c (N418), CD49b (DX5), Ly6C (HK1.4), Ly6G (1A8), F4/80 (BM8), CD3, CD19 (MB19–1) and sorted into conventional dendritic cells (cDCs) (CD3−CD19−CD11bdimCD11c+), neutrophils (CD3−CD19−CD11b+CD11c−Ly6G+), monocytes (CD3−CD19−CD11b+CD11c−Ly6G−Ly6C+), macrophages (CD3−CD19−CD11b+CD11c−Ly6G−Ly6C− F4/80+) and natural killer (NK) cells (CD3−CD19−CD11b+CD11c−Ly6G−Ly6C− F4/80−CD49b+).
In vitro generation of Th cell subsets
Naive CD4+ T cells (CD4+CD25−CD62L+) were isolated from spleen and lymph nodes of female C57Bl/6 mice. Briefly, CD25+ cells, labeled with anti-CD25-APC (PC61.5) and anti-APC MicroBeads (Miltenyi Biotec), were magnetically removed from cell suspension by using the autoMACS magnetic separation system (Miltenyi Biotec). CD4+ cells were isolated from the CD25− population by magnetic sorting, using anti-CD4-FITC (RM4-5) and anti-FITC MultiSort MicroBeads (Miltenyi Biotec). After release of the MicroBeads from the positive population, addition of anti-CD62L MicroBeads and sorting via the autoMACS magnetic separation system resulted in CD4+CD25−CD62L+ naive T cells. Differentiation of naive CD4+ T cells into Th1 or Th17 cells was performed as recently described (37). For the in vitro differentiation into induced Tregs (iTregs), sorted naive CD4+ T cells were stimulated with plate-bound anti-CD3 (145-2C11; 5 μg/ml) antibody in the presence of soluble anti-CD28 antibody (37.51; 1 μg/ml), recombinant human IL-2 (200 U/ml; Roche) and recombinant TGF-β (1 ng/ml; Peprotech). IL-2 (200 U/ml) was added every second day to the culture. On day 4, cells were harvested and dead cells were removed as described (37). An aliquot of Th1 and Th17 cells was stimulated for 4 h in the presence of PMA (10 ng/ml) and ionomycin (500 ng/ml) with addition of Brefeldin A (10 μg/ml; Sigma-Aldrich) after 2 h. Th1, Th17 cells and an aliquot of iTregs were fixed and permeabilized as described above and analyzed for IL-17A, IFN-γ and Foxp3 expression by flow cytometry. The phenotype of in vitro generated Th1 cells, Th17 cells and iTregs is shown in Supplementary Figure S1.
Preparation of genomic DNA
Genomic DNA was isolated from ex vivo sorted or in vitro cultivated T cells, as well as other ex vivo isolated immune cell subsets by using the NucleoSpin® Tissue XS kit (Macherey-Nagel) or DNA/RNA AllPrep Kit (Qiagen) according to the manufacturer's protocols.
Methyl-CpG binding domain protein sequencing (MBD-seq)
Genomic DNA for MBD-seq was obtained from 168 mice and several independently performed FACS experiments. Material from the individual sort was pooled and the MBD-seq was performed once at NXT-DX (Gent, Belgium). Genomic DNA (3 μg) was fragmented by using a Covaris S2 system (130 μl volume, duty cycle 10%, intensity 5, 200 cycles per burst during 190 s) to obtain fragments with an average length of 200 base pairs (bp). The size of the fragments was controlled with an Agilent 2100 system (Agilent Technologies). Methylated DNA was enriched by using a MethylCap kit (Diagenode) according to the manufacturer's protocol. The concentration of fragmented and captured DNA was determined on a Fluostar Optima plate reader (BMG Labtech) with the Quant-iTTM Picogreen® dsDNA assay kit (Invitrogen). We used a modified ‘multiplexed paired end ChIP protocol’ (Illumina) to generate a library for next-generation sequencing from 250 ng precipitated DNA. Briefly, we used the DNA Sample Prep Master Mix Set (New England Biolabs) in combination with the Multiplexing Sample Preparation Oligo Kit (Illumina). The preparation was performed on an Apollo 324 (IntegenX) with PrepX DNA or PrepX-32-DNA Library Kit according to the manufacturer's protocol. Small DNA fragments were removed from the samples by separation on an agarose gel. Fragments between 250 and 350 bp were excised and purified by using a Gel Extraction Kit (Qiagen). Samples were adjusted to 10 nM, pooled according to the index and sequenced with an Illumina HiSeq 2000. The FASTQ sequence reads were generated using the Illumina Casava pipeline version 1.8.0. Reads containing adaptors and/or Phix control signals were removed. The paired end 51 bp sequence reads were mapped using the bowtie (v0.12.7) software (38). The bowtie parameters were set to 0 mismatches in the seed (first 28 nucleotides). Differences in sequencing depth and mapping efficiency among the MBD-seq samples were compensated by using the library size normalization (39). Every value is normalized on the total amount of mapped reads. Only uniquely mapped reads were retained and both paired end-sequencing reads must be located within 400 bp from each other on the mouse reference genome build NCBI37/mm9. DNA fragments were constructed as a genomic DNA sequence bounded by a read pair. Identical fragments, i.e. those starting and ending at the same positions, were classified as polymerase chain reaction (PCR) artifacts and removed. Overlapping fragments were joined into a larger fragment, called region and the maximum ‘height’ of overlapping fragments represent the activity value for the region. For example, fragments within the Xist gene in naive T cells shown in Figure 4A have maximum activity of two, but in Th17 cells it is four. The activity value was used to rank the identified regions according to their DNA methylation.
Figure 4.
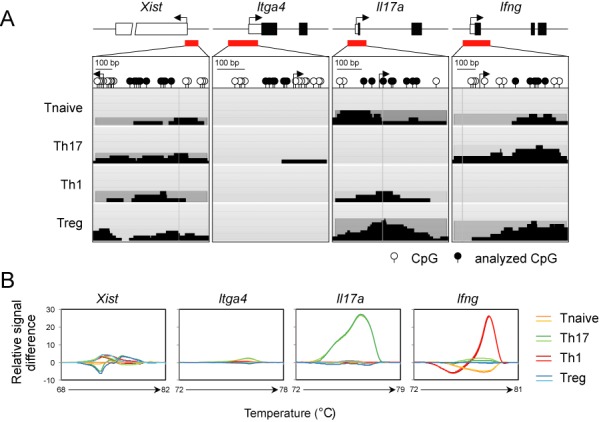
Differential methylation of control regions within Th cell subsets. (A) Locus organization and CpG motif distribution are shown for the loci Xist, Itga4, Il17a and Ifng. Pyramidal-arranged black bars display precipitated DNA-fragments that were combined into a DNA region. The maximum height of the overlapping fragments represents the MBD-seq activity. (B) Difference plots derived from high resolution melting analysis of regions described in (A). Analyzed CpG motifs are marked in black. Relative signal difference at each temperature was calculated and plotted by comparing differences between the melting curves of each subset. The experiment was performed twice. Representative plots are shown.
In silico analyses
Classification of DNA regions by methylation status was performed as follows. Let ai,j be an activity value that is equal the count of overlapped fragments for a DNA region j in ith cell population (i = 1, 2, 3, 4) and NjCpG be a number of CpG motifs contained in that region. Throughout this work, the numbering of cell populations will be: 1 – Th17, 2 – Th1, 3 – Th-mem and 4 – Tnaive. Thus, a methylation status of any DNA region in these cell subsets can be described by a quadruple (a1,j, a2,j, a3,j, a4,j). We denote as C(i,NCpG,a) the number of regions in the cell subset i that have NCpG CpG motifs and showed an activity value equal to a:
 |
Then the empirical point probability (probability density function) of activity values is given by
 |
The empirical probability distribution function (cumulative distribution) is given by
 |
Several example distributions are presented in Figure 2A. We define that a DNA fragment is in a demethylated state in cell population i if the probability P(i,NjCpG,ai,j) is below a threshold PThr. If this probability is above 1-PThr, the fragment is supposed to be in methylated state. In other cases (PThr<P(i,NjCpG,ai,j)<1-PThr) a DNA fragment will have an undefined state.
Figure 2.
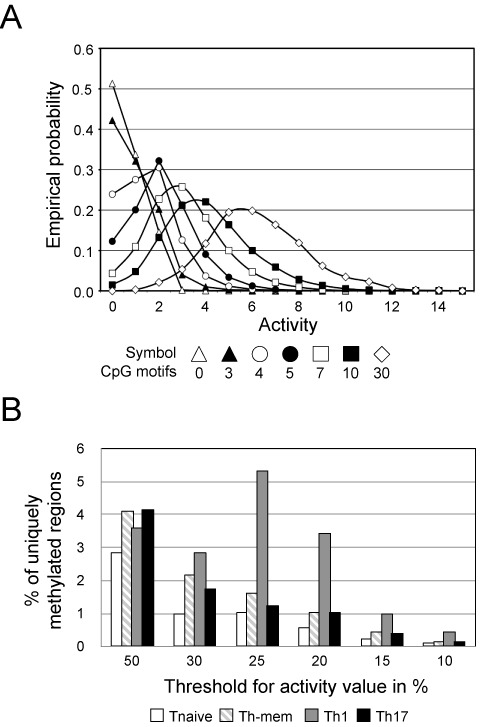
Distribution of methylated regions in Th cell subsets. Methylated genomic DNA fragments from Th cell subsets were enriched by precipitation with the human MBD2 protein and subjected to next-generation sequencing. The quantity of sequences that were mapped to the same chromosomal location was translated into an activity value. This experiment was performed once. (A) The plot depicts the distribution of activity values (empirical probability density function) with a specified number of CpG motifs in Th17 cells. (B) Pre-defined probability thresholds for activity values were used to compare the methylation status in different Th cell subsets. The plot depicts the frequencies of uniquely methylated DNA regions out of all methylated regions for naive T cells, Th-mem, Th1 or Th17 cells.
Methylation sensitive high-resolution melting (MS-HRM) analysis
Genomic DNA from ex vivo isolated T cell subsets was bisulfite converted by using the EZ DNA Methylation Kit (Zymo Research). Candidate regions showing a high activity from MBD-seq in naive T cells, Th1 cells and Tregs, but not in Th17 cells were chosen and primers were designed (Supplementary Table S1). In a subsequent qPCR on a LightCycler®480 System (Roche), 10 ng of converted DNA was mixed with 12.5 μl of 2× EpiTect HRM PCR Master Mix (Qiagen), 1 μl of 25 mM MgCl2, 9.5 pmol each of forward and reverse primers in a final volume of 25 μl. After the amplification phase (95°C for 15 min; 45 cycles: 95°C for 30 s, 55°C–60°C for 1 min, 72°C for 1 min), the HRM analysis was performed between 65°C and 95°C with a final cooling step at 40°C for 1 s. Melting curves were analyzed by the Gene Scanning Analysis Software Module (Roche). According to the manufacturer's recommendations, the relative signal differences between various samples were plotted after normalizing the raw melting curve data and shifting the normalized curves along a temperature axis.
Pyrosequencing
Genomic DNA from ex vivo isolated or in vitro cultivated T cells, as well as other ex vivo isolated immune cell subsets was bisulfite converted by using the EZ DNA Methylation Kit (Zymo Research). Validated candidate regions from MS-HRM analysis were amplified by PCR containing 10 ng of bisulfite-converted genomic DNA, HotStar Taq PCR buffer (Qiagen), 1 U HotStar Taq DNA polymerase, 2.5 mM MgCl2 and 0.38 μM each of forward and reverse primers (Supplementary Table S1) in a final volume of 50 μl (95°C for 15 min; 50 cycles: 95°C for 30 s, 57°C for 1 min, 72°C for 1 min; 72°C for 7 min). The PCR product was analyzed by gel electrophoresis. 20–40 μl of the PCR product, Pyromark Gold Q96 reagents (Qiagen), Pyromark buffers (Qiagen), Streptavidin Sepharose (GE Healthcare) and sequencing primers (Supplementary Table S1) were used for pyrosequencing on a PSQ96MA (Qiagen) according to the manufacturer's protocol. Significance of methylation rate differences between compared subsets was calculated using Prism (GraphPad Software) and a two-way ANOVA with Bonferroni's multiple comparisons test. Locations of analyzed CpG motifs in mouse genome GRC38m are listed in Supplementary Table S2.
RNA microarray hybridization and analysis
RNA was isolated using the DNA/RNA AllPrep Kit (Qiagen). Quality and integrity of total RNA was controlled on an Agilent 2100 system (Agilent Technologies). Note that 100 ng of total RNA was applied for Cy3-labeling reaction using the one color Quick Amp Labeling protocol (Agilent Technologies). Labeled cRNA was hybridized to Agilent's mouse 4 × 44k microarrays for 16 h at 68°C and scanned using the Agilent Microarray Scanner. Expression values were calculated by the software package Feature Extraction 10.5.1.1 (Agilent Technologies). Statistical analysis of the expression data was performed using the Gene Spring Software package (Agilent Technologies).
Accession codes
Data sets generated for this study are available from GEO under accession numbers GSE45911 and GSE58152.
RESULTS
DNA methylation pattern of ex vivo isolated naive T cells, Th1 cells and Th17 cells
To obtain a complete overview of the epigenetic changes during Th cell differentiation, we first sought to generate comprehensive profiles of genome-wide DNA methylation patterns of naive CD4+ T cells, Th1 cells and Th17 cells by methyl-CpG binding domain protein (MBD) sequencing (MBD-seq). For this study, solely ex vivo isolated CD4+ T cell subsets were analyzed since previously published data on Foxp3+ Tregs have revealed significant differences between the methylomes of ex vivo and in vitro generated Tregs (34,35). The CD4+ T cell subsets were isolated from secondary lymphoid organs of aged BALB/c mice, harboring a reasonable high frequency of CD45RBlow memory CD4+ T cells that contain around 1% IL-17A-producing Th17 cells and around 16% IFN-γ-producing Th1 cells (Figure 1A). We did not observe any IL-17A/IFN-γ-double producing cells in the secondary lymphoid organs of the healthy donor mice. Th1 cells, Th17 cells, naive CD4+ T cells (CD45RBhigh) and IFN-γ−IL-17A− CD45RBlowCD4+ T cells consisting of a mixture of non-Th1/Th17 memory CD4+ T cells (Th-mem) were sorted to high purity (Figure 1B). Genomic DNA from sorted T cell subsets was fragmented and regions containing methylated CpG motifs were enriched by precipitation using MBD. The resulting DNA fragments were used to generate a library that was subjected to next-generation sequencing. In total 1 497 870 DNA regions (combined overlapping DNA fragments) were identified covering 358 Mb or 10.3% of the genome. Counts of overlapping fragments represented the methylation of a DNA region and were designated as activity (ai,j). As expected, the mean activity in all T cell subsets increased with an accumulation of CpG motifs (Supplementary Figure S2). However, we did not observe a strict linear relationship, but rather logarithmic shaped curves with a similar course. For further analyses, the identified regions for each T cell population were grouped according to their CpG numbers. Plotting the distribution of activity values in these groups revealed a bell-shaped curve for fragments containing more than three CpG motifs (exemplified for Th17 cells in Figure 2A). Most of the fragments with up to three CpG motifs did not show any activity. Therefore, fragments with CpG counts up to three were excluded from the analysis.
Figure 1.
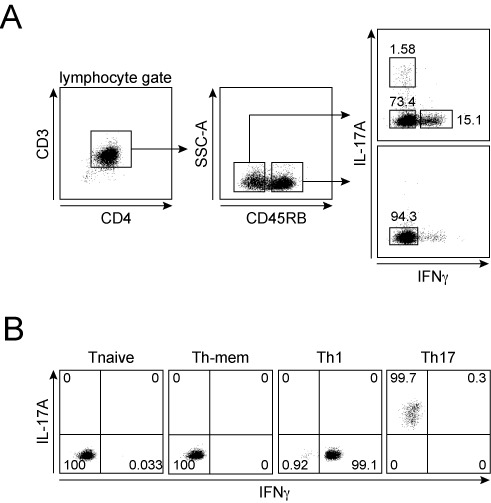
Frequency of IL-17A- and IFN-γ-producing cells among memory T cells from female aged Balb/c mice. (A) CD4+ enriched cells from lymph nodes and spleen of aged Balb/c mice were stimulated with PMA/ionomycin, labeled with the IL-17A- and IFN-γ-cytokine secretion kit, analyzed and sorted by flow cytometry. Rectangles in the plots indicate the sorting gates. Frequencies of IFN-γ−IL-17A+ Th17 cells, IFN-γ+IL-17A− Th1 cells, IFN-γ−IL-17A− Th-mem cells and IFN-γ−IL-17A− naive T (Tnaive) cells are depicted. (B) Analysis of sorted naive T cells, Th-mem, Th1 and Th17 cells. Numbers indicate the frequency of cells within quadrants. Representative dot plots of 23 independently performed sorts are shown.
Due to the wide range of activity values of sequenced DNA fragments and its dependence from the number of CpG motifs contained within, we decided to associate a probability with each DNA region that will represent its methylated or demethylated state. As such probability, we took the empirical probability distribution function P(i,NCpG,ai,j). By setting a threshold value for the probability PThr, we classified the regions as demethylated, methylated or undefined, depending on whether P(i,NCpG,ai,j) was below PThr, above 1-PThr or between these values. Thus, the probability P(i,NCpG,ai,j) served to rank DNA regions, where top and bottom ranking were then considered as methylated or demethylated, respectively. Thereby, the differences introduced by CpG counts and experimental settings between T cell subsets were taken into account and absolute values of activity were of no importance for further analysis. We calculated the number of differentially methylated regions (DMRs) among the T cell populations for several PThr. The bars in Figure 2B indicate the percentage of all regions that are methylated in one T cell population, and demethylated in the other three. A non-stringent probability threshold of 50% led to similar frequencies of uniquely methylated DNA fragments. In contrast, a stringent probability threshold of 10% drastically minimized the frequencies of uniquely methylated regions within all subsets. By setting the probability threshold to 25% we obtained the largest differences in frequencies and numbers between naive T cells with 1%, Th-mem cells with 1.6%, Th1 cells with 5.3% and Th17 cells with 1.2%. In summary, methylated regions from ex vivo isolated Th subsets displayed a different activity depending on the number of CpG motifs. Therefore, we classified the sequenced DNA fragments into groups, ranked the fragments within groups and identified the largest differences between cell lines when 25% top and bottom ranking were considered.
Number of demethylated regions increases upon Th17 cell differentiation
A mapping of all demethylated regions being identified in the T cell subsets analyzed revealed that only very small fractions were found within promoter and 3′ regions and within exons. The vast majority of demethylated regions was found in introns and intergenic regions (Supplementary Figure S3). An initial global inspection of the methylomes already revealed striking differences between Th1 and Th17 cells. Whereas Th1 cells showed a decreased number of demethylated regions (6862) compared to naive T cells (12 710), an increased number of demethylated regions was observed for Th17 cells (17 384) (Figure 3A). Only a rather low number of demethylated regions was found to overlap between naive T cells and Th1 cells (2054), and the lower number of ‘uniquely’ demethylated regions in Th1 cells (4808) compared to naive T cells (10 656) is indicative of a strong methylation of the genome during Th1 differentiation, paralleled by an only moderate demethylation. The opposite was observed for Th17 cells, which shared a higher number of demethylated regions with naive T cells (6138), suggesting a higher degree of similarity between naive T cells and Th17 cells (Figure 3A). However, Th17 cells also displayed a higher number of ‘uniquely’ demethylated regions (11 246) compared to naive T cells (6572), indicating a strong demethylation of the genome during Th17 differentiation, paralleled by an only moderate methylation. A similar picture was observed when IFN-γ−IL-17A− CD45RBlowCD4+ T cells (Th-mem) were included into the comparison (Figure 3B). Here, Th17 cells harbored the highest number of ‘uniquely’ demethylated regions (9251), followed by Th-mem cells (6272) and Th1 cells (2591). Interestingly, the three memory Th cell populations shared only 556 demethylated regions, which are in parts located in genes like Cdk6, Cass4, Nek7, Tiam1 or Lag3 being involved in differentiation processes (40–45) (data not shown).
Figure 3.
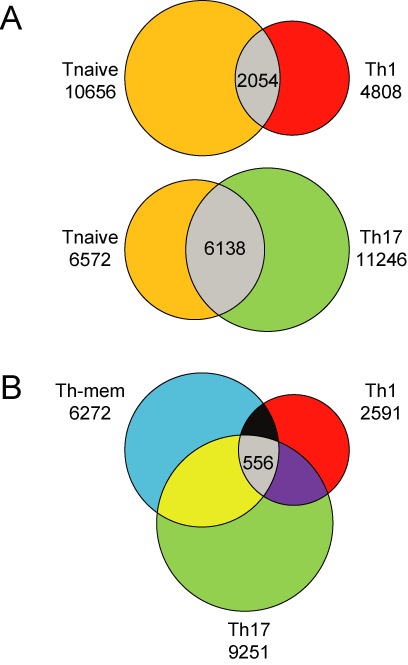
Shared and uniquely demethylated regions within Th cell subsets. (A) The two-way Venn diagrams display the distribution of demethylated regions between naive T cells (orange) and Th1 (red) or Th17 (green) cells. (B) The three-way Venn diagram compares the distribution of those regions between Th-mem (blue), Th1 (red) and Th17 (green) cells. Numbers indicate the uniquely or shared (gray) demethylated regions at a probability threshold of 25%.
In summary, the global comparison of demethylated CpG motifs between T cell subsets revealed unique epigenetic features of Th17 cells. At the same time, they show a high degree of similarity with naive T cells, but also harbor the highest number of ‘uniquely’ demethylated regions, suggesting the simultaneous appearance of high plasticity and advanced lineage development.
Identification of a Th17-specific epigenetic signature
After having obtained a global overview of the epigenetic changes during Th cell differentiation and having demonstrated that Th17 cells harbor a unique methylome, we next sought to describe the epigenome of Th17 cells in more detail with the aim to identify Th17-specific epigenetic signature genes. In light of the recently reported developmental and functional links between the Treg and Th17 cell lineages (46), we sought to exclude methylation patterns also present in Foxp3+ Tregs. Thus, MBD-seq data from ex vivo isolated Tregs (Supplementary Figure S4) generated as described above were included into the search for Th17-specific demethylated regions.
We first inspected control regions to confirm the validity of the generated MBD-seq data sets. The 5′ end of the Xist allele on the active X chromosome is known to be fully methylated in any somatic tissue (47), and a CpG island in the promoter of integrin alpha 4 (Itga4), although being inactivated by methylation in gastric cancer cells (48), is not regulated in T cells by methylation (unpublished observation). Accordingly, valid signals for Xist and no valid signals for Itga4 were detected in all T cell subsets (Figure 4A). Next, we analyzed the methylation status of the Ifng and Il17a promoter known to be selectively demethylated in Th1 and Th17 cells, respectively (12,14,17,18,23,24,49). Here, we observed T cell subset-specific methylation patterns with valid MBD-seq signals for the Ifng and Il17a promoter being present in all samples except Th1 and Th17 cells, respectively (Figure 4A). By performing MS-HRM analyses (50), the methylation patterns of the control regions Xist, Itga4, Il17a and Ifng in the different T cell subsets could be validated (Figure 4B). Thus, the inspection of the control regions confirmed the validity of the generated MBD-seq data sets.
Next, we screened the MBD-seq data for regions showing valid signals in all samples except Th17 cells to identify Th17-specific demethylated regions. Note that 195 candidate regions were tested by MS-HRM analyses (data not shown). Highest melting-curve differences between Th17 cells and all other T cell subsets were observed for regions within Zfp362, Ccr6, Acsbg1, Dpp4, Rora and Dclk1 (Figure 5). Most of these regions are located in introns, except for the region from Acsbg1, which covers transcribed exons, and from Ccr6 that spans promoter, start site and the first non-translated exon. To get more detailed information on the methylation status of individual CpG motifs, we performed pyrosequencing for the regions within Il17a, Zfp362, Ccr6, Acsbg1, Dpp4, Rora and Dclk1 and could observe a more pronounced demethylation in Th17 cells when compared to naive T cells, Th1 cells and Tregs (Figure 6A, Supplementary Figures S5 and Supplementary Table S3). Interestingly, the regions within Il17a, Zfp362, Ccr6, Dpp4 and Rora showed a more or less homogeneous demethylation of the majority of CpG motifs analyzed, whereas the demethylation within Acsbg1 and Dclk1 is restricted to a subpart of the region or even to a single CpG motif, respectively. It is worth mentioning that also ex vivo isolated Th1 cells and Tregs showed signs of demethylation in some of the regions analyzed, but less pronounced when compared to Th17 cells and restricted to individual CpG motifs only (Figure 6A, Supplementary Figure S5 and Supplementary Table S3). Interestingly, in vitro generated Th17 cells did not show any demethylation within Ccr6, Acsbg1, Dpp4, Rora and Dclk1 when compared to naive T cells (Figure 6A and B and Supplementary Table S3). Only Il17a and Zfp362 showed some signs of demethylation albeit less pronounced when compared to ex vivo isolated Th17 cells (Il17a) or restricted to only subparts of the region (Zfp362). In vitro generated Th1 cells and Tregs, which were analyzed as controls, showed a methylation pattern comparable to naive T cells in any of the regions being analyzed (Figure 6A and B and Supplementary Table S3). Together, these data suggest that ex vivo isolated and in vitro generated Th17 cells represent different developmental states.
Figure 5.
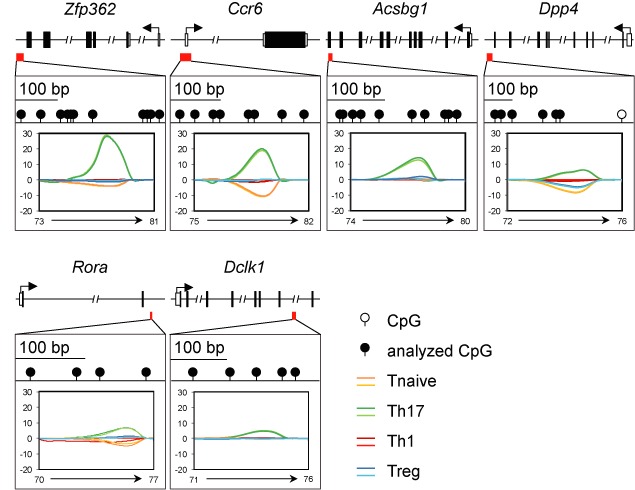
Candidate regions Zfp362, Ccr6, Acsbg1, Dpp4, Rora and Dclk1 are differentially methylated. Locus organization and CpG motif distribution are shown for six candidate regions. The methylation status of marked CpG motifs (black) was studied by MS-HRM analyses. Relative signal difference at each temperature was calculated and plotted by comparing differences between the melting curves of each subset. Data from one out of two independently performed experiments are depicted.
Figure 6.
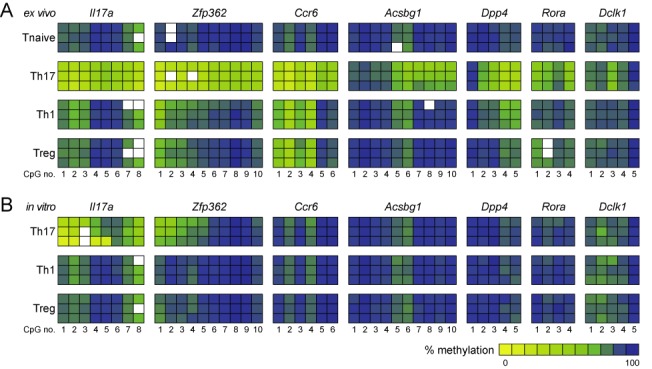
Detailed methylation analysis of Th17-specific epigenetic signature genes in ex vivo isolated and in vitro generated T cell subsets by pyrosequencing. Detailed analysis of the methylation status of the candidate DMRs was performed by pyrosequencing using genomic DNA from the indicated (A) ex vivo isolated and (B) in vitro generated T cell subsets. The methylation rates were translated into a color code from yellow (0%) via green (50%) up to blue (100%). Each rectangle represents the methylation of one CpG motif. Data from three independently performed cell sorts and cultures are depicted.
To unravel whether the demethylation of regions within Il17a, Zfp362, Ccr6, Acsbg1, Dpp4, Rora and Dclk1 in ex vivo isolated Th17 cells results in an increased expression of the corresponding genes, we performed mRNA microarray studies with ex vivo isolated naive T cells, Th1 and Th17 cells. Indeed, ex vivo isolated Th17 cells not only displayed an increased expression of Th17-specific signature genes (e.g. Rorc, Il23r), but also showed an increased expression of most Th17-specific epigenetic signature genes (Il17a, Zfp362, Ccr6, Acsbg1, Dpp4 and Rora) when compared to naive T cells and Th1 cells, while unexpectedly, Dclk1 showed a higher expression in Th1 cells (Supplementary Figure S6). Together our data suggest that Il17a, Zfp362, Ccr6, Acsbg1, Dpp4, Rora and Dclk1 represent Th17-specific epigenetic signature genes presumably playing a functional role for the unique Th17 cell phenotype.
Th17-specific epigenetic signature in peripheral immune cell subsets
Finally, we aimed to study the specificity of the Th17-specific epigenetic signature for Th17 cells. Thereto, we isolated major immune cell subsets including γδ T cells, total CD4+ T cells, total CD8+ T cells, B cell, neutrophils, monocytes, macrophages, cDCs and NK cells from secondary lymphoid organs (Supplementary Figure S7) and analyzed the methylation status of the Th17-specific epigenetic signature genes Il17a, Zfp362, Ccr6, Acsbg1, Dpp4, Rora and Dclk1 by pyrosequencing (Figure 7 and Supplementary Table S4). Interestingly, γδ T cells revealed a similar albeit less pronounced demethylation in Il17a, Zfp362, Ccr6, Acsbg1, Rora and Dclk1, but not in Dpp4, when compared to ex vivo isolated Th17 cells (Figure 6A). All other immune cell subsets showed only limited similarity to Th17 cells. Interestingly, monocytes and macrophages contain several demethylated CpG motifs within Il17a, and the Ccr6 region around the transcriptional start site is partially demethylated in NK cells and fully demethylated in B cells. Viewed as a whole our results demonstrate that the Th17-specific epigenetic signature despite some similarities with γδ T cells is specific to ex vivo isolated Th17 cells.
Figure 7.
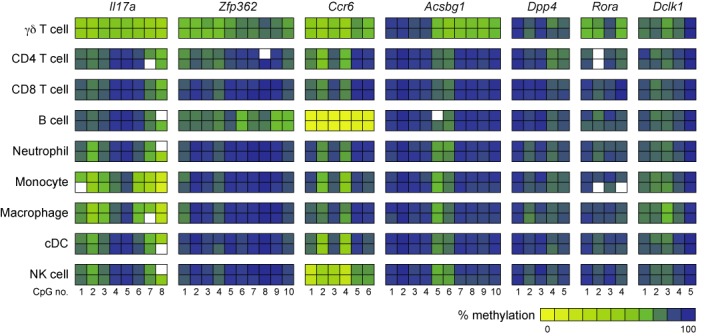
Detailed methylation analysis of the Th17-specific epigenetic signature genes in major immune cell subsets. Detailed analysis of the methylation status of the candidate DMRs was performed by pyrosequencing using genomic DNA from the indicated immune cell subsets. The methylation rates were translated into a color code from yellow (0%) via green (50%) up to blue (100%). Each rectangle represents the methylation of one CpG motif. Data from two independently performed cell sorts are depicted.
DISCUSSION
Differentiation of naive T cells into Th cell subsets results in the acquisition of highly specialized functional properties characterized by the expression of unique effector cytokines. It is well known that epigenetic modifications of the corresponding effector cytokine gene loci ensure long-term stability of the respective Th cell phenotypes, however, a comprehensive picture of the epigenetic modifications occurring during Th cell differentiation was by and large lacking. Therefore, we here performed a global analysis of changes at the DNA methylation level upon differentiation of naive CD4+ T cells into IFN-γ-secreting Th1 cells and IL-17A-secreting Th17 cells. Genome-wide MBD-seq data were generated from ex vivo isolated T cell subsets and revealed a unique phenotype of Th17 cells harboring the highest number of demethylated regions and showing a larger overlap with naive T cells when compared to Th1 cells. A detailed inspection of the MBD-seq data resulted in the identification of seven CpG-rich regions located in Il17a, Zfp362, Ccr6, Acsbg1, Dpp4, Rora and Dclk1 that show more pronounced demethylation in ex vivo isolated Th17 cells when compared to any other T cell subset. This Th17-specific epigenetic signature allows identifying and functionally characterizing in vivo generated Th17 cells.
Interestingly, an initial global assessment of the MBD-seq data revealed that the vast majority of demethylated regions across all T cell subsets mapped to introns and intergenic regions, whereas only a low number was found in promoters. These findings are in line with results from a recent study, in which global changes at the DNA methylation level during differentiation of TCR-transgenic naive T cells into memory T cells were analyzed using a methyl-sensitive cut counting method (51). Also in that study, the majority of DMRs were found to be located in introns, suggesting that epigenetic modifications occurring during Th cell differentiation more frequently affect enhancer rather than promoter activity of immunologically relevant genes. Despite these similarities the study by Hashimoto et al. and the present study also exhibit some controversies: Although the authors did not subdivide the memory T cell compartment into different Th cell subsets according to their cytokine expression pattern, but rather analyzed the bulk CD25−CD69−CD127highCD44high memory T cell pool (51), this cell population was largely dominated by cells harboring a Th1 phenotype (92% TNF-α+ and 43% IFN-γ+ cells). Nevertheless, they observed an overall increase in the number of demethylated regions upon differentiation of naive T cells into memory T cells (51), whereas in the present study ex vivo isolated Th1 cells showed exactly the opposite picture with a substantial decrease in the number of demethylated regions when compared to naive T cells. These somewhat contradicting results might be explained by the different sources of memory T cells used for the global DNA methylation analyses in these two studies. In the present study, cytokine-producing memory T cells were isolated directly ex vivo. In contrast, Hashimoto et al. first stimulated naive T cells for 5 days in vitro, followed by an adoptive transfer into recipient mice, from which memory T cells were isolated 4 weeks later (51). It is tempting to speculate that the initial in vitro stimulation step might have resulted in the formation of a methylome that differs from the DNA methylation pattern found in ex vivo isolated Th cell subsets.
This assumption is also supported by our finding that in vitro generated Th17 cells strongly differ in their DNA methylation pattern when compared to ex vivo isolated Th17 cells. Indeed, a lower degree of demethylation at Il17a was identified in in vitro cultivated Th17 cells, and particularly the other Th17-specific epigenetic signature genes showed hardly any signs of demethylation in the cultivated cells. These data suggest that essential signals, e.g. provided by highly specialized APCs or by unique cytokine milieus (52), were lacking under the in vitro culture conditions, thereby leading to the generation of Th17 cells with an unstable phenotype (28,29,53,54). Similar differences were observed for Foxp3+ Tregs, where only ex vivo isolated or in vivo induced, but not in vitro generated cells showed pronounced demethylation of the Treg-specific epigenetic signature, consisting of regions within Foxp3, Tnfrsf18, Ctla4, Ikzf4 and Il2ra, which finally resulted in a stably imprinted Treg phenotype (34,35). It has been suggested that several rounds of in vitro restimulation under Th1-polarizing conditions can lead to some stabilization of the Th1 phenotype (55), and that ‘chronic’ TCR-triggering can result in mild demethylation of part of the Treg-specific epigenetic signature (35). However, even repetitive rounds of in vitro restimulation in the presence of TGF-β do neither cause demethylation of the Foxp3 locus nor stabilization of Foxp3 expression (56), further supporting the assumption that unique signals being solely present in vivo are critical for the epigenetic imprinting of Th cell phenotypes.
Recent studies on Foxp3+ Tregs by others and us have demonstrated that it is possible to identify and quantify stable Tregs by methylation analysis of a single region within the Foxp3 locus (34,57–59). In the present study, however, we could show that none of the individual regions of the Th17-specific epigenetic signature were sufficient to unequivocally identify Th17 cells on its own. In particular, Ccr6 was found to be fully demethylated in B cells and to a lesser extent in NK cells and γδ T cells, which is in line with the previously reported expression profile of CCR6 on these cell subsets (60–62). Furthermore, γδ T cells showed a high degree of similarity with ex vivo isolated Th17 cells on the DNA methylation level. Although demethylation of Il17a, Zfp362, Ccr6, Acsbg1, Rora and Dclk1 was slightly less pronounced in γδ T cells when compared to ex vivo isolated Th17 cells, the overall pattern was very similar except for Dpp4 which did not show overt signs of demethylation in γδ T cells. This pattern similarity might be explained by the fact that a significant fraction of γδ T cells express the transcription factor RORγt and can produce IL-17A (62–64). From these results we hypothesize that some of the epigenetic changes in Th17 cells and γδ T cells are linked to RORγt-dependent transcriptional regulation.
Despite the fact that none of the individual regions of the Th17-specific epigenetic signature genes was sufficient to unequivocally identify Th17 cells on its own, the whole signature was unique to ex vivo isolated Th17 cells and one might speculate that these genes are of functional importance for Th17 cells and contribute to their unique phenotype. Indeed, transcriptomic profiling of ex vivo isolated Th cells revealed an increased expression of Il17a, Zfp362, Ccr6, Acsbg1, Dpp4 and Rora in Th17 cells when compared to Th1 cells, in line with previously published data showing a high expression of Ccr6, Dpp4 and Rora in Th17 cells (8,65,66). Only Dclk1 displayed an increased expression in Th1 cells when compared to Th17 cells, suggesting that the demethylation of the single CpG motif within Dclk1 does not foster expression of the kinase under these experimental conditions. In contrast, the region within Ccr6 is known to control stable Ccr6 expression via epigenetic mechanisms (67). It is selectively demethylated in CCR6+ T cells and was reported to display transcriptional activity in CCR6+ T cells in a methylation-sensitive manner. Similar mechanisms were also shown for Il17a, where the region around the transcriptional start site was described to be selectively demethylated in Th17 cells when compared to other Th cell subsets (17,23,24). This demethylation of the Il17a promoter is of utmost importance for the induction of Il17a expression since methylation of STAT3 consensus elements within the promoter were reported to directly inhibit STAT3 binding as well as transcriptional activity (17), suggesting that Il17a expression is under direct epigenetic control.
According to the MBD-seq analysis from the present study, the Th17-associated genes Rorc, Il17f, Il21, Il22, Il1r1, Il23r and Ahr did not show a specific methylation pattern in ex vivo isolated murine Th17 cells. However, in a previously published study, a selective demethylation of several CpG motifs downstream of the transcriptional start site of the human RORγt promoter were observed in RORγt+ cells (25). This discrepancy can be either explained by a low degree of homology for this region between mice and men or by a too low number of CpG motifs within this region. Similarly, the specific demethylation of two CpG motifs within the Il17f promoter in Th17 cells (17) was not detected by our MBD-seq approach, suggesting that the resolution of this technique is insufficient to detect minor differences. In contrast, the recently described demethylation of a CpG-rich region at the transcriptional start site of Il17a and at promoter position −166/−144 (17) could be confirmed by our study (see Figures 4 and 6 and data not shown). Studies on 5-azacytidine treated tumor cells revealed a possible epigenetic regulation of Il21, Il23R and Ahr (68–70). So far, we did not detect any differential methylation within these loci in immune cells.
Although in vivo generated Th17 cells are engraved with unique epigenetic marks that partially enable stable expression of key genes of the Th17 phenotype, recent reports about the plasticity and flexibility of Th17 cells particularly under inflammatory conditions raised the question about stability of the lineage itself (32,71). Th17 cells can easily convert into T cells expressing effector cytokines different from the Th17 phenotype (10,27,72,73). While it has to be clarified whether the converted T cells derive from effector or memory cells, adaptation to an inflammatory environment seems to be a key feature of Th17 cells. The higher number of demethylated regions found in ex vivo isolated Th17 cells when compared to naive T cells might be the molecular basis for the high plasticity and flexibility of Th17 cells.
In conclusion, the genome-wide DNA methylation analyses of ex vivo isolated Th cell subsets reinforced the finding that Th cell differentiation is associated with massive epigenetic changes at the DNA methylation level. Subset-specific methylation patterns like the Th17-specific epigenetic signature can be used to identify and functionally characterize the highly diverse Th cell subsets.
SUPPLEMENTARY DATA
Supplementary Data are available at NAR Online.
Acknowledgments
We thank Beate Pietzsch, Kirsten Löhr and Maria Ebel for technical assistance and Robert Geffers for the generation of the microarray data.
Footnotes
These authors contributed equally to the paper as first authors.
FUNDING
German Research Foundation [KFO 250]. Funding for open access charge: German Research Foundation.
Conflict of interest statement. None declared.
REFERENCES
- 1.Luckheeram R.V., Zhou R., Verma A.D., Xia B. CD4+ T cells: differentiation and functions. Clin. Dev. Immunol. 2012;2012:1–12. doi: 10.1155/2012/925135. [DOI] [PMC free article] [PubMed] [Google Scholar]
- 2.Mosmann T.R., Cherwinski H., Bond M.W., Giedlin M.A., Coffman R.L. Two types of murine helper T cell clone. I. Definition according to profiles of lymphokine activities and secreted proteins. J. Immunol. 1986;136:2348–2357. [PubMed] [Google Scholar]
- 3.Mosmann T.R., Coffman R.L. TH1 and TH2 cells: different patterns of lymphokine secretion lead to different functional properties. Annu. Rev. Immunol. 1989;7:145–173. doi: 10.1146/annurev.iy.07.040189.001045. [DOI] [PubMed] [Google Scholar]
- 4.Amsen D., Spilianakis C.G., Flavell R.A. How are T(H)1 and T(H)2 effector cells made. Curr. Opin. Immunol. 2009;21:153–160. doi: 10.1016/j.coi.2009.03.010. [DOI] [PMC free article] [PubMed] [Google Scholar]
- 5.Amsen D., Antov A., Flavell R.A. The different faces of Notch in T-helper-cell differentiation. Nat. Rev. Immunol. 2009;9:116–124. doi: 10.1038/nri2488. [DOI] [PubMed] [Google Scholar]
- 6.Harrington L.E., Hatton R.D., Mangan P.R., Turner H., Murphy T.L., Murphy K.M., Weaver C.T. Interleukin 17-producing CD4+ effector T cells develop via a lineage distinct from the T helper type 1 and 2 lineages. Nat. Immunol. 2005;6:1123–1132. doi: 10.1038/ni1254. [DOI] [PubMed] [Google Scholar]
- 7.Park H., Li Z., Yang X.O., Chang S.H., Nurieva R., Wang Y.H., Wang Y., Hood L., Zhu Z., Tian Q., et al. A distinct lineage of CD4 T cells regulates tissue inflammation by producing interleukin 17. Nat. Immunol. 2005;6:1133–1141. doi: 10.1038/ni1261. [DOI] [PMC free article] [PubMed] [Google Scholar]
- 8.Yang X.O., Pappu B.P., Nurieva R., Akimzhanov A., Kang H.S., Chung Y., Ma L., Shah B., Panopoulos A.D., Schluns K.S., et al. T helper 17 lineage differentiation is programmed by orphan nuclear receptors ROR alpha and ROR gamma. Immunity. 2008;28:29–39. doi: 10.1016/j.immuni.2007.11.016. [DOI] [PMC free article] [PubMed] [Google Scholar]
- 9.Martinez G.J., Nurieva R.I., Yang X.O., Dong C. Regulation and function of proinflammatory TH17 cells. Ann. N.Y. Acad. Sci. 2008;1143:188–211. doi: 10.1196/annals.1443.021. [DOI] [PMC free article] [PubMed] [Google Scholar]
- 10.Muranski P., Restifo N.P. Essentials of Th17 cell commitment and plasticity. Blood. 2013;121:2402–2414. doi: 10.1182/blood-2012-09-378653. [DOI] [PMC free article] [PubMed] [Google Scholar]
- 11.Lohning M., Richter A., Radbruch A. Cytokine memory of T helper lymphocytes. Adv. Immunol. 2002;80:115–181. doi: 10.1016/s0065-2776(02)80014-1. [DOI] [PubMed] [Google Scholar]
- 12.Wilson C.B., Rowell E., Sekimata M. Epigenetic control of T-helper-cell differentiation. Nat. Rev. Immunol. 2009;9:91–105. doi: 10.1038/nri2487. [DOI] [PubMed] [Google Scholar]
- 13.Mullen A.C., Hutchins A.S., High F.A., Lee H.W., Sykes K.J., Chodosh L.A., Reiner S.L. Hlx is induced by and genetically interacts with T-bet to promote heritable T(H)1 gene induction. Nat. Immunol. 2002;3:652–658. doi: 10.1038/ni807. [DOI] [PubMed] [Google Scholar]
- 14.Winders B.R., Schwartz R.H., Bruniquel D. A distinct region of the murine IFN-gamma promoter is hypomethylated from early T cell development through mature naive and Th1 cell differentiation, but is hypermethylated in Th2 cells. J. Immunol. 2004;173:7377–7384. doi: 10.4049/jimmunol.173.12.7377. [DOI] [PubMed] [Google Scholar]
- 15.Schoenborn J.R., Dorschner M.O., Sekimata M., Santer D.M., Shnyreva M., Fitzpatrick D.R., Stamatoyannopoulos J.A., Wilson C.B. Comprehensive epigenetic profiling identifies multiple distal regulatory elements directing transcription of the gene encoding interferon-gamma. Nat. Immunol. 2007;8:732–742. doi: 10.1038/ni1474. [DOI] [PMC free article] [PubMed] [Google Scholar]
- 16.Wei G., Wei L., Zhu J., Zang C., Hu-Li J., Yao Z., Cui K., Kanno Y., Roh T.Y., Watford W.T., et al. Global mapping of H3K4me3 and H3K27me3 reveals specificity and plasticity in lineage fate determination of differentiating CD4+ T cells. Immunity. 2009;30:155–167. doi: 10.1016/j.immuni.2008.12.009. [DOI] [PMC free article] [PubMed] [Google Scholar]
- 17.Thomas R.M., Sai H., Wells A.D. Conserved intergenic elements and DNA methylation cooperate to regulate transcription at the il17 locus. J. Biol. Chem. 2012;287:25049–25059. doi: 10.1074/jbc.M112.351916. [DOI] [PMC free article] [PubMed] [Google Scholar]
- 18.Dong J., Chang H.D., Ivascu C., Qian Y., Rezai S., Okhrimenko A., Cosmi L., Maggi L., Eckhardt F., Wu P., et al. Loss of methylation at the IFNG promoter and CNS-1 is associated with the development of functional IFN-gamma memory in human CD4+ T lymphocytes. Eur. J. Immunol. 2013;43:793–804. doi: 10.1002/eji.201242858. [DOI] [PubMed] [Google Scholar]
- 19.Makar K.W., Wilson C.B. DNA methylation is a nonredundant repressor of the Th2 effector program. J. Immunol. 2004;173:4402–4406. doi: 10.4049/jimmunol.173.7.4402. [DOI] [PubMed] [Google Scholar]
- 20.Fields P.E., Lee G.R., Kim S.T., Bartsevich V.V., Flavell R.A. Th2-specific chromatin remodeling and enhancer activity in the Th2 cytokine locus control region. Immunity. 2004;21:865–876. doi: 10.1016/j.immuni.2004.10.015. [DOI] [PubMed] [Google Scholar]
- 21.Lee D.U., Rao A. Molecular analysis of a locus control region in the T helper 2 cytokine gene cluster: a target for STAT6 but not GATA3. Proc. Natl. Acad. Sci. U.S.A. 2004;101:16010–16015. doi: 10.1073/pnas.0407031101. [DOI] [PMC free article] [PubMed] [Google Scholar]
- 22.Tykocinski L.O., Hajkova P., Chang H.D., Stamm T., Sozeri O., Lohning M., Hu-Li J., Niesner U., Kreher S., Friedrich B., et al. A critical control element for interleukin-4 memory expression in T helper lymphocytes. J. Biol. Chem. 2005;280:28177–28185. doi: 10.1074/jbc.M502038200. [DOI] [PubMed] [Google Scholar]
- 23.Cohen C.J., Crome S.Q., MacDonald K.G., Dai E.L., Mager D.L., Levings M.K. Human Th1 and Th17 cells exhibit epigenetic stability at signature cytokine and transcription factor loci. J. Immunol. 2011;187:5615–5626. doi: 10.4049/jimmunol.1101058. [DOI] [PubMed] [Google Scholar]
- 24.Janson P.C., Linton L.B., Bergman E.A., Marits P., Eberhardson M., Piehl F., Malmstrom V., Winqvist O. Profiling of CD4+ T cells with epigenetic immune lineage analysis. J. Immunol. 2011;186:92–102. doi: 10.4049/jimmunol.1000960. [DOI] [PubMed] [Google Scholar]
- 25.Schmidl C., Hansmann L., Andreesen R., Edinger M., Hoffmann P., Rehli M. Epigenetic reprogramming of the RORC locus during in vitro expansion is a distinctive feature of human memory but not naive Treg. Eur. J. Immunol. 2011;41:1491–1498. doi: 10.1002/eji.201041067. [DOI] [PubMed] [Google Scholar]
- 26.Lexberg M.H., Taubner A., Forster A., Albrecht I., Richter A., Kamradt T., Radbruch A., Chang H.D. Th memory for interleukin-17 expression is stable in vivo. Eur. J. Immunol. 2008;38:2654–2664. doi: 10.1002/eji.200838541. [DOI] [PubMed] [Google Scholar]
- 27.Zhou L., Chong M.M., Littman D.R. Plasticity of CD4+ T cell lineage differentiation. Immunity. 2009;30:646–655. doi: 10.1016/j.immuni.2009.05.001. [DOI] [PubMed] [Google Scholar]
- 28.Bending D., De La Pena H., Veldhoen M., Phillips J.M., Uyttenhove C., Stockinger B., Cooke A. Highly purified Th17 cells from BDC2.5NOD mice convert into Th1-like cells in NOD/SCID recipient mice. J. Clin. Invest. 2009;119:565–572. doi: 10.1172/JCI37865. [DOI] [PMC free article] [PubMed] [Google Scholar]
- 29.Lee Y.K., Turner H., Maynard C.L., Oliver J.R., Chen D., Elson C.O., Weaver C.T. Late developmental plasticity in the T helper 17 lineage. Immunity. 2009;30:92–107. doi: 10.1016/j.immuni.2008.11.005. [DOI] [PMC free article] [PubMed] [Google Scholar]
- 30.Cosmi L., Maggi L., Santarlasci V., Capone M., Cardilicchia E., Frosali F., Querci V., Angeli R., Matucci A., Fambrini M. Identification of a novel subset of human circulating memory CD4+ T cells that produce both IL-17A and IL-4. J. Allergy Clin. Immunol. 2010;125:222–230. doi: 10.1016/j.jaci.2009.10.012. e221–e224. [DOI] [PubMed] [Google Scholar]
- 31.Wang Y.H., Voo K.S., Liu B., Chen C.Y., Uygungil B., Spoede W., Bernstein J.A., Huston D.P., Liu Y.J. A novel subset of CD4+ T(H)2 memory/effector cells that produce inflammatory IL-17 cytokine and promote the exacerbation of chronic allergic asthma. J. Exp. Med. 2010;207:2479–2491. doi: 10.1084/jem.20101376. [DOI] [PMC free article] [PubMed] [Google Scholar]
- 32.Hirota K., Duarte J.H., Veldhoen M., Hornsby E., Li Y., Cua D.J., Ahlfors H., Wilhelm C., Tolaini M., Menzel U., et al. Fate mapping of IL-17-producing T cells in inflammatory responses. Nat. Immunol. 2011;12:255–263. doi: 10.1038/ni.1993. [DOI] [PMC free article] [PubMed] [Google Scholar]
- 33.Kleinewietfeld M., Hafler D.A. The plasticity of human Treg and Th17 cells and its role in autoimmunity. Semin. Immunol. 2013;25:305–312. doi: 10.1016/j.smim.2013.10.009. [DOI] [PMC free article] [PubMed] [Google Scholar]
- 34.Floess S., Freyer J., Siewert C., Baron U., Olek S., Polansky J., Schlawe K., Chang H.D., Bopp T., Schmitt E., et al. Epigenetic control of the foxp3 locus in regulatory T cells. PLoS Biol. 2007;5:e38. doi: 10.1371/journal.pbio.0050038. [DOI] [PMC free article] [PubMed] [Google Scholar]
- 35.Ohkura N., Hamaguchi M., Morikawa H., Sugimura K., Tanaka A., Ito Y., Osaki M., Tanaka Y., Yamashita R., Nakano N., et al. T cell receptor stimulation-induced epigenetic changes and Foxp3 expression are independent and complementary events required for Treg cell development. Immunity. 2012;37:785–799. doi: 10.1016/j.immuni.2012.09.010. [DOI] [PubMed] [Google Scholar]
- 36.Wan Y.Y., Flavell R.A. Identifying Foxp3-expressing suppressor T cells with a bicistronic reporter. Proc. Natl. Acad. Sci. U.S.A. 2005;102:5126–5131. doi: 10.1073/pnas.0501701102. [DOI] [PMC free article] [PubMed] [Google Scholar]
- 37.Prajeeth C.K., Lohr K., Floess S., Zimmermann J., Ulrich R., Gudi V., Beineke A., Baumgartner W., Muller M., Huehn J., et al. Effector molecules released by Th1 but not Th17 cells drive an M1 response in microglia. Brain. Behav. Immun. 2014;37:248–259. doi: 10.1016/j.bbi.2014.01.001. [DOI] [PubMed] [Google Scholar]
- 38.Langmead B., Trapnell C., Pop M., Salzberg S.L. Ultrafast and memory-efficient alignment of short DNA sequences to the human genome. Genome Biol. 2009;10:R25.1. doi: 10.1186/gb-2009-10-3-r25. [DOI] [PMC free article] [PubMed] [Google Scholar]
- 39.Dillies M.A., Rau A., Aubert J., Hennequet-Antier C., Jeanmougin M., Servant N., Keime C., Marot G., Castel D., Estelle J., et al. A comprehensive evaluation of normalization methods for Illumina high-throughput RNA sequencing data analysis. Brief. Bioinformat. 2013;14:671–683. doi: 10.1093/bib/bbs046. [DOI] [PubMed] [Google Scholar]
- 40.Hu M.G., Deshpande A., Schlichting N., Hinds E.A., Mao C., Dose M., Hu G.F., Van Etten R.A., Gounari F., Hinds P.W. CDK6 kinase activity is required for thymocyte development. Blood. 2011;117:6120–6131. doi: 10.1182/blood-2010-08-300517. [DOI] [PMC free article] [PubMed] [Google Scholar]
- 41.Otto T., Sicinski P. The kinase-independent, second life of CDK6 in transcription. Cancer Cell. 2013;24:141–143. doi: 10.1016/j.ccr.2013.07.019. [DOI] [PMC free article] [PubMed] [Google Scholar]
- 42.Singh M.K., Dadke D., Nicolas E., Serebriiskii I.G., Apostolou S., Canutescu A., Egleston B.L., Golemis E.A. A novel Cas family member, HEPL, regulates FAK and cell spreading. Mol. Biol. Cell. 2008;19:1627–1636. doi: 10.1091/mbc.E07-09-0953. [DOI] [PMC free article] [PubMed] [Google Scholar]
- 43.Fry A.M., O'Regan L., Sabir S.R., Bayliss R. Cell cycle regulation by the NEK family of protein kinases. J. Cell Sci. 2012;125:4423–4433. doi: 10.1242/jcs.111195. [DOI] [PMC free article] [PubMed] [Google Scholar]
- 44.Gerard A., van der Kammen R.A., Janssen H., Ellenbroek S.I., Collard J.G. The Rac activator Tiam1 controls efficient T-cell trafficking and route of transendothelial migration. Blood. 2009;113:6138–6147. doi: 10.1182/blood-2008-07-167668. [DOI] [PubMed] [Google Scholar]
- 45.Li N., Workman C.J., Martin S.M., Vignali D.A. Biochemical analysis of the regulatory T cell protein lymphocyte activation gene-3 (LAG-3; CD223) J. Immunol. 2004;173:6806–6812. doi: 10.4049/jimmunol.173.11.6806. [DOI] [PubMed] [Google Scholar]
- 46.Weaver C.T., Hatton R.D. Interplay between the TH17 and TReg cell lineages: a (co-)evolutionary perspective. Nat. Rev. Immunol. 2009;9:883–889. doi: 10.1038/nri2660. [DOI] [PubMed] [Google Scholar]
- 47.Norris D.P., Patel D., Kay G.F., Penny G.D., Brockdorff N., Sheardown S.A., Rastan S. Evidence that random and imprinted Xist expression is controlled by preemptive methylation. Cell. 1994;77:41–51. doi: 10.1016/0092-8674(94)90233-x. [DOI] [PubMed] [Google Scholar]
- 48.Park J., Song S.H., Kim T.Y., Choi M.C., Jong H.S., Kim T.Y., Lee J.W., Kim N.K., Kim W.H., Bang Y.J. Aberrant methylation of integrin alpha4 gene in human gastric cancer cells. Oncogene. 2004;23:3474–3480. doi: 10.1038/sj.onc.1207470. [DOI] [PubMed] [Google Scholar]
- 49.Melvin A.J., McGurn M.E., Bort S.J., Gibson C., Lewis D.B. Hypomethylation of the interferon-gamma gene correlates with its expression by primary T-lineage cells. Eur. J. Immunol. 1995;25:426–430. doi: 10.1002/eji.1830250218. [DOI] [PubMed] [Google Scholar]
- 50.Wojdacz T.K., Dobrovic A., Hansen L.L. Methylation-sensitive high-resolution melting. Nat. Protoc. 2008;3:1903–1908. doi: 10.1038/nprot.2008.191. [DOI] [PubMed] [Google Scholar]
- 51.Hashimoto S., Ogoshi K., Sasaki A., Abe J., Qu W., Nakatani Y., Ahsan B., Oshima K., Shand F.H., Ametani A., et al. Coordinated changes in DNA methylation in antigen-specific memory CD4 T cells. J. Immunol. 2013;190:4076–4091. doi: 10.4049/jimmunol.1202267. [DOI] [PMC free article] [PubMed] [Google Scholar]
- 52.Lee Y., Awasthi A., Yosef N., Quintana F.J., Xiao S., Peters A., Wu C., Kleinewietfeld M., Kunder S., Hafler D.A., et al. Induction and molecular signature of pathogenic TH17 cells. Nat. Immunol. 2012;13:991–999. doi: 10.1038/ni.2416. [DOI] [PMC free article] [PubMed] [Google Scholar]
- 53.Yang X.O., Nurieva R., Martinez G.J., Kang H.S., Chung Y., Pappu B.P., Shah B., Chang S.H., Schluns K.S., Watowich S.S., et al. Molecular antagonism and plasticity of regulatory and inflammatory T cell programs. Immunity. 2008;29:44–56. doi: 10.1016/j.immuni.2008.05.007. [DOI] [PMC free article] [PubMed] [Google Scholar]
- 54.Nurieva R., Yang X.O., Chung Y., Dong C. Cutting edge: in vitro generated Th17 cells maintain their cytokine expression program in normal but not lymphopenic hosts. J. Immunol. 2009;182:2565–2568. doi: 10.4049/jimmunol.0803931. [DOI] [PMC free article] [PubMed] [Google Scholar]
- 55.Niesner U., Albrecht I., Janke M., Doebis C., Loddenkemper C., Lexberg M.H., Eulenburg K., Kreher S., Koeck J., Baumgrass R., et al. Autoregulation of Th1-mediated inflammation by twist1. J. Exp. Med. 2008;205:1889–1901. doi: 10.1084/jem.20072468. [DOI] [PMC free article] [PubMed] [Google Scholar]
- 56.Polansky J.K., Kretschmer K., Freyer J., Floess S., Garbe A., Baron U., Olek S., Hamann A., von Boehmer H., Huehn J. DNA methylation controls Foxp3 gene expression. Eur. J. Immunol. 2008;38:1654–1663. doi: 10.1002/eji.200838105. [DOI] [PubMed] [Google Scholar]
- 57.Baron U., Floess S., Wieczorek G., Baumann K., Grutzkau A., Dong J., Thiel A., Boeld T.J., Hoffmann P., Edinger M., et al. DNA demethylation in the human FOXP3 locus discriminates regulatory T cells from activated FOXP3+ conventional T cells. Eur. J. Immunol. 2007;37:2378–2389. doi: 10.1002/eji.200737594. [DOI] [PubMed] [Google Scholar]
- 58.Wieczorek G., Asemissen A., Model F., Turbachova I., Floess S., Liebenberg V., Baron U., Stauch D., Kotsch K., Pratschke J., et al. Quantitative DNA methylation analysis of FOXP3 as a new method for counting regulatory T cells in peripheral blood and solid tissue. Cancer Res. 2009;69:599–608. doi: 10.1158/0008-5472.CAN-08-2361. [DOI] [PubMed] [Google Scholar]
- 59.Alexander T., Sattler A., Templin L., Kohler S., Gross C., Meisel A., Sawitzki B., Burmester G.R., Arnold R., Radbruch A., et al. Foxp3+ Helios+ regulatory T cells are expanded in active systemic lupus erythematosus. Ann. Rheum. Dis. 2013;72:1549–1558. doi: 10.1136/annrheumdis-2012-202216. [DOI] [PubMed] [Google Scholar]
- 60.Krzysiek R., Lefevre E.A., Bernard J., Foussat A., Galanaud P., Louache F., Richard Y. Regulation of CCR6 chemokine receptor expression and responsiveness to macrophage inflammatory protein-3alpha/CCL20 in human B cells. Blood. 2000;96:2338–2345. [PubMed] [Google Scholar]
- 61.Berahovich R.D., Lai N.L., Wei Z., Lanier L.L., Schall T.J. Evidence for NK cell subsets based on chemokine receptor expression. J. Immunol. 2006;177:7833–7840. doi: 10.4049/jimmunol.177.11.7833. [DOI] [PubMed] [Google Scholar]
- 62.Haas J.D., Gonzalez F.H., Schmitz S., Chennupati V., Fohse L., Kremmer E., Forster R., Prinz I. CCR6 and NK1.1 distinguish between IL-17A and IFN-gamma-producing gammadelta effector T cells. Eur. J. Immunol. 2009;39:3488–3497. doi: 10.1002/eji.200939922. [DOI] [PubMed] [Google Scholar]
- 63.Lockhart E., Green A.M., Flynn J.L. IL-17 production is dominated by gammadelta T cells rather than CD4 T cells during Mycobacterium tuberculosis infection. J. Immunol. 2006;177:4662–4669. doi: 10.4049/jimmunol.177.7.4662. [DOI] [PubMed] [Google Scholar]
- 64.Prinz I., Silva-Santos B., Pennington D.J. Functional development of gammadelta T cells. Eur. J. Immunol. 2013;43:1988–1994. doi: 10.1002/eji.201343759. [DOI] [PubMed] [Google Scholar]
- 65.Annunziato F., Cosmi L., Santarlasci V., Maggi L., Liotta F., Mazzinghi B., Parente E., Fili L., Ferri S., Frosali F., et al. Phenotypic and functional features of human Th17 cells. J. Exp. Med. 2007;204:1849–1861. doi: 10.1084/jem.20070663. [DOI] [PMC free article] [PubMed] [Google Scholar]
- 66.Bengsch B., Seigel B., Flecken T., Wolanski J., Blum H.E., Thimme R. Human Th17 cells express high levels of enzymatically active dipeptidylpeptidase IV (CD26) J. Immunol. 2012;188:5438–5447. doi: 10.4049/jimmunol.1103801. [DOI] [PubMed] [Google Scholar]
- 67.Steinfelder S., Floess S., Engelbert D., Haeringer B., Baron U., Rivino L., Steckel B., Gruetzkau A., Olek S., Geginat J., et al. Epigenetic modification of the human CCR6 gene is associated with stable CCR6 expression in T cells. Blood. 2011;117:2839–2846. doi: 10.1182/blood-2010-06-293027. [DOI] [PubMed] [Google Scholar]
- 68.Frikeche J., Clavert A., Delaunay J., Brissot E., Gregoire M., Gaugler B., Mohty M. Impact of the hypomethylating agent 5-azacytidine on dendritic cells function. Exp. Hematol. 2011;39:1056–1063. doi: 10.1016/j.exphem.2011.08.004. [DOI] [PubMed] [Google Scholar]
- 69.Baird A.M., Dockry E., Daly A., Stack E., Doherty D.G., O'Byrne K.J., Gray S.G. IL-23R is epigenetically regulated and modulated by chemotherapy in non-small cell lung cancer. Front. Oncol. 2013;3:162.1–162.9. doi: 10.3389/fonc.2013.00162. [DOI] [PMC free article] [PubMed] [Google Scholar]
- 70.Mulero-Navarro S., Carvajal-Gonzalez J.M., Herranz M., Ballestar E., Fraga M.F., Ropero S., Esteller M., Fernandez-Salguero P.M. The dioxin receptor is silenced by promoter hypermethylation in human acute lymphoblastic leukemia through inhibition of Sp1 binding. Carcinogenesis. 2006;27:1099–1104. doi: 10.1093/carcin/bgi344. [DOI] [PubMed] [Google Scholar]
- 71.Haines C.J., Chen Y., Blumenschein W.M., Jain R., Chang C., Joyce-Shaikh B., Porth K., Boniface K., Mattson J., Basham B., et al. Autoimmune memory T helper 17 cell function and expansion are dependent on interleukin-23. Cell Rep. 2013;3:1378–1388. doi: 10.1016/j.celrep.2013.03.035. [DOI] [PubMed] [Google Scholar]
- 72.Muranski P., Borman Z.A., Kerkar S.P., Klebanoff C.A., Ji Y., Sanchez-Perez L., Sukumar M., Reger R.N., Yu Z., Kern S.J., et al. Th17 cells are long lived and retain a stem cell-like molecular signature. Immunity. 2011;35:972–985. doi: 10.1016/j.immuni.2011.09.019. [DOI] [PMC free article] [PubMed] [Google Scholar]
- 73.Annunziato F., Cosmi L., Liotta F., Maggi E., Romagnani S. Defining the human T helper 17 cell phenotype. Trends Immunol. 2012;33:505–512. doi: 10.1016/j.it.2012.05.004. [DOI] [PubMed] [Google Scholar]
Associated Data
This section collects any data citations, data availability statements, or supplementary materials included in this article.