

Abstract
Objective
Brain-computer interfaces (BCIs) are being developed to assist paralyzed people and amputees by translating neural activity into movements of a computer cursor or prosthetic limb. Here we introduce a novel BCI task paradigm, intended to help accelerate improvements to BCI systems. Through this task, we can push the performance limits of BCI systems, we can quantify more accurately how well a BCI system captures the user’s intent, and we can increase the richness of the BCI movement repertoire.
Approach
We have implemented an instructed path task, wherein the user must drive a cursor along a visible path. The instructed path task provides a versatile framework to increase the difficulty of the task and thereby push the limits of performance. Relative to traditional point-to-point tasks, the instructed path task allows more thorough analysis of decoding performance and greater richness of movement kinematics.
Main results
We demonstrate that monkeys are able to perform the instructed path task in a closed-loop BCI setting. We further investigate how the performance under BCI control compares to native arm control, whether users can decrease their movement variability in the face of a more demanding task, and how the kinematic richness is enhanced in this task.
Significance
The use of the instructed path task has the potential to accelerate the development of BCI systems and their clinical translation.
1. Introduction
Brain-computer interfaces (BCI) aim to assist paralyzed people and amputees by translating neural activity into movement of a computer cursor or prosthetic limb. Researchers have demonstrated the potential of these systems in the laboratory using animal subjects. Monkeys have been trained to control computer cursors [1–4], robotic limbs [5,6], electrical stimulation of their own muscles [7], and electrical stimulation of their own spinal cord [8] with BCIs. Recently, paralyzed humans have also controlled computer cursors [9–11] and robotic limbs [12, 13] via implanted BCI. In addition to providing quality-of-life benefits, BCIs can also be used to study the neural mechanisms of motor control and learning in healthy individuals [14–17].
Perhaps the most common tasks used in BCI studies are point-to-point tasks, such as center-out [2–4,9–11,14,15,17,18]. In a point-to-point task, a user is instructed to move the effector (i.e., computer cursor or robotic limb) from one location to another, and there are no constraints on the effector’s trajectory. Consider the three BCI cursor trajectories for a point-to-point task shown in Figure 1a. Although the trajectories are quite different from each other, all three trials would be deemed successful. Trajectory 1 most closely resembles the movement of the hand in a point-to-point task under arm control, so it may most closely reflect the user’s intention. Performance metrics for point-to-point tasks are mainly success rate (i.e., the percentage of successful trials) and target acquisition time (i.e., the duration of time for the effector to move from one point to another) [19]. Other performance metrics evaluate the trajectory of the cursor, measuring properties such as movement variability (across trials) and straightness (within a trial) [9]. To accelerate the development of BCIs from the lab to the clinic, we need more realistic tasks and richer performance metrics than point-to-point tasks can provide. Specifically, we propose the following three goals for BCI system design.
Figure 1.
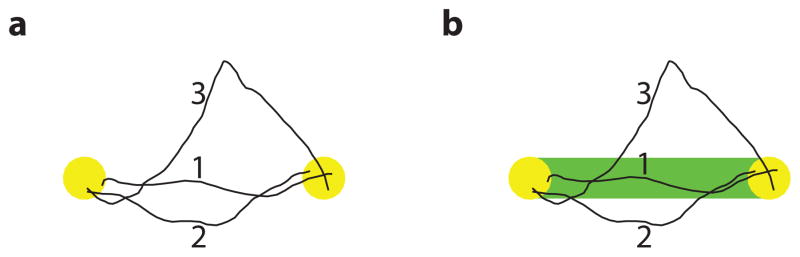
Raising performance standards in BCI paradigms. Cursor trajectories (black) from three trials in two tasks are shown. (a) Point-to-point task. All three trials would be successful since the cursor cursor moves from one target (yellow) to the other. (b) Instructed path task. The user is required to keep the cursor within the path (green) while moving it from one target to the other. Only trial 1 would be successful in this task.
First, BCI tasks should be designed to extend the performance limits of current systems. Most current BCI systems perform quite well in center-out tasks [2–4, 9–11, 14, 15, 17, 18], which can create the impression that further improvements are not needed for clinical translation. One way in which performance limits can be extended is by increasing the difficulty of a task in a parametric manner until the user is no longer able to complete it successfully. With a point-to-point task, researchers can reduce the amount of time allowed for driving the effector to the target, increase the duration of time during which the user must keep the effector on a target (the ‘hold time’), increase the distance between the targets, or decrease the size of the targets. BCI tasks should allow for finer control of difficulty. By finely tuning task difficulty, we can reveal deficiencies in BCI control that may not be apparent in point-to-point tasks.
Second, we need to have a good understanding of the user’s intentions against which to evaluate the performance of a BCI. In a point-to-point task where there are few constraints on the effector’s trajectory, it is difficult to know whether or not any particular trajectory accurately reflects the user’s intent. When the cursor movement is not straight to the target (e.g., trajectory 2 in Figure 1a), it could be that the user intended to drive the cursor along that trajectory or that the BCI system is just difficult to control. Knowing the user’s intent would allow us to assess what aspects of the cursor movement variability is intentional and what aspects are beyond the user’s control. This can then be taken into account when designing BCI user interfaces (e.g., [20–22]) or physical workspaces (e.g., [6,12,13]) to minimize errors.
Third, BCIs should allow the user to demonstrate rich kinematics of the effector, resembling those of the arm in everyday life. A point-to-point task typically explores only a limited subset of kinematics (that is, the position and velocity of the effector). In a standard center-out task, position and velocity are highly correlated [23, 24]. Designing tasks to test whether users are able to show diverse combinations of position and velocity while proficiently controlling the cursor will provide a framework for gauging the effectiveness of BCI systems.
Previous BCI studies have already proposed extensions to the center-out task, such as requiring users to move a BCI cursor around visual barriers [4] or to sequentially-placed targets (i.e., ‘pinball task’) [1, 5, 25–27]. Both of these tasks push the limits of the user’s control and increase the richness of kinematics relative to a center-out task, although it can be difficult to estimate the user’s true intentions in these tasks for the reason illustrated in Figure 1a. Another extension requires users to track a continuously moving target (i.e., ‘pursuit tracking’) [25,26]. This extension helps to meet the aforementioned three goals and tests aspects of BCI control that are complementary to the work presented here.
Similar extensions have also been applied to arm movement tasks. For example, via-points [28] (i.e., requiring users to reach through a sequence of predefined targets), a pinball task [27], and tasks with visual barriers [29,30] have been used. Other studies have used tasks where the target changes location mid-reach [31, 32]. Schwartz and colleagues introduced tasks with instructed paths wherein the users traced spirals and ellipses with their hands [33, 34]. All of these extensions increase the difficulty of the task and provide richer kinematics, against which neural activity can be compared.
We introduce the instructed path task for BCI control (Figure 1b). This task specifies the path along which the user should drive the cursor on each trial. It is particularly beneficial for BCI studies because it adds to the number of ways in which we can increase the difficulty of a task. In Figure 1b, the user must keep the cursor on the green path. To maintain the same proficiency as with the point-to-point task, the user must improve his or her performance, as trajectories like 2 and 3 would be deemed unsuccessful. Additionally, the instructed path constrains the possibilities for the user’s true intentions. That is, we know the user intends to move the cursor on the path instead of along any other unspecified route. This task can also be used to increase the richness of kinematics a user exhibits.
Here, we present findings in two monkeys who performed the instructed path task under BCI control. We compare performance to a conventional point-to-point task under BCI control. We also compare performance in both tasks under brain control to performance under arm control. We previously presented a preliminary version of this work [35].
2. Methods
2.1. Electrophysiology and behavioral monitoring
All animal handling procedures were approved by the University of Pittsburgh Animal Care and Use Committee. Two male monkeys (Macaca mulatta, monkey L aged 9 and monkey J aged 6 years) were each implanted with a 96-channel multi-electrode array (Blackrock Microsystems) in the proximal arm region of primary motor cortex (M1) in the hemisphere contralateral to the arm used to perform the tasks under arm control. We monitored arm movements using an LED marker attached to the monkey’s index finger (Phasespace, Inc.). The task stimuli (i.e., targets, cursor, and instructed paths) were displayed to the monkeys in a virtual 3D environment in the same frontoparallel plane.
2.2. Tasks
We trained the monkeys to perform two tasks under brain control and arm control: the instructed path task and, for comparison, a point-to-point task. Both tasks are depicted in Figure 2. Sections 2.2.1 and 2.2.2 describe the tasks in general. Section S.1 provides detailed descriptions of the tasks, and Table S1 outlines the parameters used in each session.
Figure 2.

Task schematic and timeline. (a) At the beginning of each trial, the monkey moved the cursor (blue circle) to acquire the start target (yellow circle). The go cue (appearance of the end target the for the point-to-point task, appearance of the path for the instructed path task) was then given, and the monkey was required to move the cursor to the end target (point-to-point task) or through the path (green; instructed path task). White dashed circle, tolerance zone around the target; green dashed line, tolerance zone around the instructed path. (b) For arm control trials, the monkeys controlled the red cursor using the position of their hand. We mapped the position of an LED on the monkey’s hand (red dot) directly to cursor position on the screen. (c) For brain control trials, the monkeys controlled the blue cursor by modulating neural activity. Neural activity was converted to cursor position using a BCI decoder.
2.2.1. Point-to-point task
The point-to-point task began with the appearance of a ‘start target’ (Figure 2a, top). The monkey moved the cursor to this target. Once the center of the cursor entered the ‘tolerance zone’ around the start target, the ‘end target’ appeared either immediately or following a short, randomized hold time (for monkey J during arm control sessions only). Hold times were chosen from the set {200, 450, 600, 750, 900, 1500} ms. Once the end target appeared (i.e., the ‘go cue’), the monkey could move the cursor to that target. When the center of the cursor entered the end target tolerance zone, the animal received a liquid reward. There was no hold requirement on the end target. The monkeys usually moved the cursor swiftly to the end target; if they did not do so, then after 5 s (monkey J) or 7.5 s (monkey L), no reward was given, and a 1.5 s penalty period ensued.
2.2.2. Instructed path task
The instructed path task also began with the appearance of a start target (Figure 2a, bottom). After the monkey moved the cursor to the start target, a path appeared either immediately or after a short, randomized hold time (for monkey J arm control only). Hold times were chosen from the same set as for the point-to-point task. The path connected the start target to the location of the end target, and the appearance of the path signaled the go cue. The monkey could then move the cursor through the path toward the end target. Once the cursor was 75% of the way through the path, the end target appeared (the path remained visible). When the monkey acquired the end target with the cursor (there was no hold time requirement on the end target), a liquid reward was administered. If the center of the cursor left the tolerance region around the path, or if the monkey did not acquire the end target within the time limit (same limits as the point-to-point task), then the trial aborted and was followed by a timeout. For both monkeys, we used instructed paths of two types: straight paths and paths with one inflection. For monkey J, we also used paths that were U-shaped, had two inflections, or had three inflections. We use the term ‘target distance’ refers to the straight-line distance between targets, regardless of the presence or type of the path. The ‘path length’ of the instructed path refers to the distance between targets along the centerline of the path.
2.3. Quantification of performance
We quantified performance using several metrics. Two of the metrics (success rate and target acquisition time) are standard for BCI studies. Success rate is computed as the fraction of trials successfully completed. In order to compare across monkeys and control types, we discounted the hold time requirement for monkey J arm control. If a trial failed because the monkey did not satisfy the hold time requirement, we did not include that trial in the success rate computation.
Acquisition time is the amount of time taken by the monkey to drive the cursor to the end target on successful trials (starting from the go cue). We use two other metrics (virtual success rate and comparison of kinematics) to highlight the benefits of the instructed path task.
Virtual success rate
For a given set of point-to-point cursor trajectories, we asked how well the monkeys would have performed if an instructed path had been present. To assess this, we applied a ‘virtual’ path tolerance using a hypothetical straight instructed path and computed the percentage of trials that would have been successful if a path with that tolerance had been present. We termed this the ‘virtual success rate’. In a similar manner, we computed virtual success rates for instructed path trajectories for virtual path tolerances that were smaller than those used in the actual experiment. For all virtual success rate calculations, we disregarded the hold times as we did for the success rate calculations.
Significance testing
For all measures of success rate and virtual success rate, we combined each monkey’s performance across many sessions. To compare the success rates of two different experimental conditions, we could not simply apply a t-test because the data are binary (i.e., each trial is deemed a success or failure). Instead, we adopted a Bayesian approach whereby each success or failure is considered to be the result of a coin toss, whose probability of heads (i.e., success) is q (i.e., a Bernoulli process) [36,37]. Since q is unknown (in fact, it is what we desire to estimate), we set a uniform prior distribution on q between 0 and 1. Having observed the distribution of successes and failures, we can then compute the posterior distribution on q, which is a beta distribution. The figures showing success rate or virtual success rate in Sections 3 and S.3 indicate the mean and the 95% confidence interval of the posterior distribution on q. We computed a separate posterior beta distribution for each experimental condition. To assess whether the success rate of one experimental condition (q1) was significantly greater than that of another condition (q2), we evaluated whether P (q1 > q2) was larger than 0.95.
For acquisition time and normalized acquisition time, we also combined performance across sessions. Because those metrics are continuous-valued, we could compare their distributions directly. The metrics are not normally distributed (Kolmogorov-Smirnov test, p = 0.05), so we compared distributions using Wilcoxon rank-sum test with a significance threshold of p = 0.05. Because we used the rank-sum statistical test, we indicate the medians of the distributions rather than the means.
2.4. Control modalities
The monkeys controlled the position of the cursor using one of two modalities during each session: arm control or brain control.
2.4.1. Arm control
For sessions during which a monkey controlled the cursor with his arm, the position of the cursor was determined from the position of an LED on the monkey’s hand (Figure 2b). Only the horizontal and vertical components of the arm movements moved the cursor; arm movements toward or away from the monkey’s body were not rendered onscreen.
2.4.2. Brain control
For the brain control sessions, the monkeys controlled the cursor by modulating neural activity in M1 (Figure 2c). We loosely restrained monkey L’s arms during brain control sessions. Monkey J’s arms were unrestrained during the brain control sessions when we used the instructed path task. His arms were restrained during four of the five brain control sessions when we used the point-to-point task. In Section 2.5, we describe the general form of the decoder. Section S.2 provides more details about the decoder.
2.5. BCI decoders
We decoded cursor kinematics from neural activity using a linear mapping
| (1) |
where x̂t ∈ ℝr×1 is the cursor kinematics and ut ∈ ℝq×1 is a vector of z-scored activity for each ‘neural unit’ in the time bin t (45 ms or 60 ms). Each unit was z-scored separately. We defined one neural unit as corresponding to all of the threshold crossings recorded on one electrode. We set the threshold at 3.0 or 3.5 times the root-mean-square value for each electrode. For each session, the value was consistent across all electrodes. The number of units q was typically around 90 each session (monkey L mean +/− standard deviation: 88.44 +/− 3.81; monkey J: 91.91 +/− 1.20). At the beginning of each session, we determined which electrodes to use for decoding. We did not use an electrode if its signal did not appear to be neural in origin or if it was electrically shorted to another electrode. M1 ∈ ℝr×r defines the contribution of the cursor kinematics at time t−1 to the kinematics at time t, and M2 ∈ ℝr×q defines the contribution of the neural activity recorded at time t to the cursor kinematics at time t. For some sessions, we derived the values of M1 and M2 from the standard Kalman filter [26]. For other sessions, we derived the values from a modified version of the Kalman filter [17]. Performance was comparable for both types of Kalman filters, so the data were combined. Details of the derivations are given in Section S.2.
For some sessions, the number of kinematic parameters r = 6. In those sessions, the elements of x̂t corresponded to horizontal and vertical position, velocity, and acceleration of the cursor. At each timestep, the elements of x̂t corresponding to position determined the cursor’s position on the screen. For other sessions, r = 2. The elements of x̂t corresponded to horizontal and vertical velocity. We integrated the velocity across timesteps to define the cursor position on the screen.
2.5.1. Decoder calibration
Each brain control session began with a calibration block. We used the data recorded during that block to calibrate the parameters of the decoders.
Monkey L
The calibration procedure for monkey L was similar to that described in [18]. For the first 16 trials of the calibration block, the monkey observed a cursor move with a constant velocity from the start target (center of workspace) to the end target (15.2 cm from the start target). We called this the ‘observation task’. We calibrated the parameters of an initial decoder from the neural activity and cursor kinematics on these trials [38]. For the next 8 trials, the monkey controlled the cursor with the decoder calibrated on the 16 observation trials. The cursor was placed on the start target at the beginning of each trial. We calibrated a decoder from these 8 trials, and the monkey controlled the cursor with that decoder for 8 more trials. We then calibrated a decoder from all 16 closed-loop trials. We repeated this process until the monkey had completed 48 closed-loop trials. The decoder that the monkey used for the remainder of the session was calibrated from data recorded on all 48 trials. For all of monkey L’s sessions, r = 2.
Monkey J
Monkey J performed two different tasks for calibration, one task per session. For most sessions, we used the instructed path task under arm control to calibrate the BCI decoder. The monkey completed 2 repetitions of 64 unique combinations of path shape and target location. We used four path shapes during calibration: single-inflection, double-inflection, triple-inflection, and U-shaped. We calibrated the decoding parameters using the arm kinematics and the recorded neural activity. For these sessions, r = 6.
For some of the point-to-point sessions for monkey J, the calibration block consisted entirely of the observation task. The monkey observed the cursor move for 80 trials, and we calibrated the parameters of the decoder from the observed cursor kinematics and recorded neural activity. For these sessions, r = 2.
Previous BCI studies have compared different methods for calibrating decoding parameters [4, 39, 40]. We did not systematically vary the BCI calibration methods in this study to allow for a direct comparison of different calibration methods.
3. Results
We trained two monkeys to control the position of a cursor either using their neural activity (‘brain control’) or their hand (‘arm control’). For each of these control modalities, there were two tasks. The point-to-point task required the monkeys to move the cursor from one target to another, and there were no constraints on the cursor’s trajectory. The instructed path task required the monkeys to move the cursor along a specified path. We used two different shapes of instructed paths for both monkeys: straight and single-inflection.
Figure 3 shows representative cursor trajectories for successful trials for both control modalities for both monkeys. For brain control (top row), the cursor mostly moves straight from the start target to the end target. For arm control (bottom row), the cursor trajectories are slightly more direct than under brain control. These cursor trajectories are qualitatively similar to those shown in other studies (e.g., [18], [27], and [4]). Trajectories shown are from a contiguous stretch of trials in the middle of an arbitrarily-selected session. We did not observe systematic differences across sessions.
Figure 3.
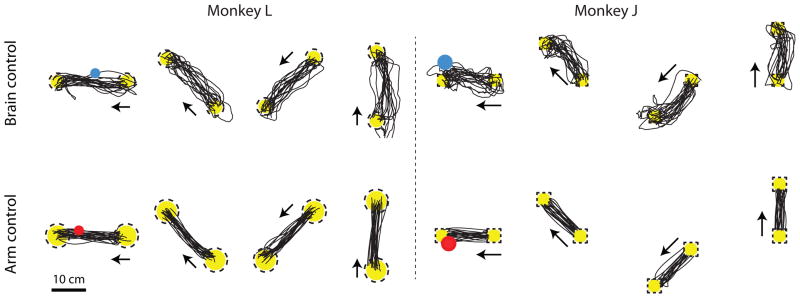
Representative point-to-point cursor trajectories. Top row: Cursor trajectories for 4 of the 8 target configurations for the point-to-point task under brain control. Yellow circles, start and end targets; arrows, direction of cursor movement (i.e., from start target to end target); dashed lines, target tolerance zone; blue circle, brain-controlled cursor; black lines, cursor trajectories. Bottom row: Cursor trajectories for 4 of the 8 target configurations under arm control. Red circle, arm-controlled cursor. Target-to-target distance is 20 cm for monkey L and 15.2 cm for monkey J.
We implemented the instructed path task to push the limits of BCI systems beyond what point-to-point tasks can provide. Figure 4 shows representative cursor trajectories for the instructed path task for both control modalities (brain control and arm control) and both shapes of instructed paths (straight and single-inflection). Whereas in the point-to-point task, the cursor was free to take a circuitous route to arrive at the target, in the instructed path task, the cursor needs to follow a prescribed path.
Figure 4.

Representative instructed path cursor trajectories. Top: Brain control cursor trajectories for 4 of the 8 straight path configurations and 4 of the 16 single-inflection path configurations. Same format as Figure 3. Green dashed line: path tolerance zone. Bottom: Arm control cursor trajectories. Target distances are 10 cm for monkey L arm control and brain control, 22.5 cm for monkey J brain control, and 15.2 cm for monkey J arm control.
Figure 4 highlights monkey L’s strategy for the curved trajectories. Presumably, this animal attempted to acquire the end target as quickly as possible by driving the cursor closer to the inside edge of the inflection. The instructed path cursor trajectories for monkey J are similar to those for monkey L, except that for both control modalities, the single-inflection cursor trajectories are not as close to the inside edge of the inflection as for monkey L.
3.1. Success rate
To quantify performance, we measured the success rates for the different tasks, which are shown in Figure 5. We expected that as we increased the task difficulty, the success rate would decrease. The straight instructed path is more difficult than the point-to-point task because of the added constraint to keep the cursor within a small tolerance zone around the instructed path. The single-inflection instructed path is more difficult than the straight instructed path because of its curvature. Indeed, the success rates were highest for point-to-point, lower for straight instructed paths, and lowest for single-inflection instructed paths. This shows that more challenging tasks can reveal deficiencies in BCI control that are not evident using a point-to-point task. Strengthening this point, for monkey L (Figure 5a), as the task became more difficult, the difference in success rates between arm control and brain control became more pronounced.
Figure 5.

Success rates for the three tasks under brain control and arm control. Each bar shows the percentage of successful trials for a given task and control modality across all sessions. Error bars are the 95% confidence interval defined by the Bernoulli process. The success rates indicated by any two bars for the same monkey are significantly different at the 95% level. The tables indicate the target distance and path tolerance radius for each task. (a) Success rates for monkey L. Trial counts: point-to-point: brain control, number of trials, n = 2660; arm control, n = 1859. Straight instructed paths: brain control, n = 1723; arm control, n = 4259. Single-inflection instructed paths: brain control, n = 1889; arm control, n = 5344. (b) Success rates for monkey J. Point-to-point: brain control, n = 206; arm control, n = 4421. Straight instructed paths: brain control, n = 1066; arm control, n = 713. Single-inflection instructed paths: brain control, n = 9605; arm control, n = 810.
Monkey J (Figure 5b) shows similar trends as monkey L. Namely, success rate decreased with increasing task difficulty for both brain control and arm control. Because monkey J’s experiments involved a variety of task parameters (Table S1), we included only a subset of sessions in Figure 5b in which the task parameters were as consistent as possible across tasks and control modalities. Success rates for all sessions for Monkey J are shown in Figure S1. The differences seen across monkeys in Figure 5 can be attributed to the fact that the task parameters are not entirely consistent across tasks and control modalities for Monkey J. For example, the difference between brain control and arm control performance did not become more pronounced with task difficulty for monkey J, as it did for monkey L. This may be due to the fact that the tolerance radii were more forgiving under brain control than under arm control.
3.2. Acquisition time
We measured the amount of time required to move the cursor from the start target to the end target. The acquisition times for monkey L are shown in Figure 6. The median acquisition times are around 1 s for brain control and are shorter for arm control (point-to-point: 3.65 times shorter; straight instructed paths: 2.78 times shorter; single-inflection instructed paths: 1.87 times shorter). Note that the brain control cursor speed can be affected by choices made by the experimenter during calibration. For example, increasing the observed cursor speed during calibration can increase the speed of the cursor during closed-loop control (Figure S2), at the expense of success rate (data not shown). This is a manifestation of the classic speed-accuracy trade-off [41]. We chose observed cursor speeds that allowed the monkeys to achieve reasonable success rates on both the point-to-point and instructed path tasks, and for each monkey, the observed speed was constant for all sessions (monkey L: 17.5 cm/s, monkey J: 15 cm/s). In general, monkey J moved the cursor more quickly under arm control than brain control, as did monkey L. However, we were not able to directly compare the acquisition times for monkey J since the target distances varied between control modalities. This motivated the use of a normalized acquisition time, described below.
Figure 6.

Comparison of acquisition times for different tasks for monkey L. Tick marks: medians of distributions. Acquisition times were computed only for successful trials. In each panel, all acquisition times are significantly different from each other (p < 0.05, Wilcoxon rank-sum test).
To compare the acquisition times across tasks (and across trials with different target distances), we need to take into account the length of the instructed path. For a given pair of start and end targets, a single-inflection path is 1.2 times longer than a straight path, and therefore, we expected the acquisition times to be longer for those trials. We normalized the acquisition times by the distance between start and end targets (for point-to-point task) or the distance along the instructed path (for instructed path task), and we show these ‘normalized acquisition times’ in Figure 7. Because the normalization process accounts for the target distance, we could compare the normalized acquisition times for monkey J.
Figure 7.

Comparison of normalized acquisition times for different tasks. (a) Normalized acquisition times for brain control (left) and arm control (right) for monkey L. Point-to-point: brain control, n = 2363 successful trials; arm control, n = 1811. Straight instructed paths: brain control, n = 1363; arm control, n = 4089. Single-inflection instructed paths: brain control, n = 1001; arm control, n = 4093. (b) Normalized acquisition times for monkey J. Same format as a. Point-to-point: brain control, n = 206 successful trials; arm control, n = 4033. Straight instructed paths: brain control, n = 839; arm control, n = 629. Single-inflection instructed paths: brain control, n = 6331; arm control, n = 626. Acquisition times were defined only for successful trials. In each panel, all normalized acquisition times are significantly different from each other (p < 0.05, Wilcoxon rank-sum test).
For monkey L (Figure 7a), the differences between the normalized acquisition times for brain control are smaller than they are for arm control. This suggests that the monkey was less able to modulate the speed of cursor movement under brain control than under arm control [9,42]. The normalized acquisition times were larger for the straight instructed paths than for the point-to-point task for both control modalities. The additional constraints of the path presumably influenced the monkey to attempt to move the cursor more slowly in order to stay within its bounds.
For both brain control and arm control, the longest normalized acquisition times were for the single-inflection instructed paths. For arm control, this indicates that the monkey moved his arm slower when making a curved trajectory [43]. This is likely because the monkey needed to change the momentum of his arm, which required him to make slower movements. The same holds for brain control, where the form of the decoder (Equation 1) imparts momentum on the cursor [44].
Figure 7b shows the normalized acquisition times for the subset of the sessions from monkey J analyzed in Figure 5b. For arm control, the relative ordering of the normalized acquisition times are consistent with monkey L. For brain control, there are two differences between the monkeys, and they can be explained by the task parameters being not entirely matched across tasks for monkey J. First, the normalized acquisition time is lower for the straight instructed path task than the point-to-point task for monkey J brain control. This is likely due to the fact that the point-to-point target distance (15.2 cm) is substantially shorter than that for the straight instructed path trials (22.7 cm). Movements of shorter distance tend to have smaller peak movement speeds and therefore larger normalized acquisition times [45]. Second, the normalized acquisition time is lower for single-inflection paths than straight paths for monkey J brain control. This is likely due to the fact that the single-inflection brain control experiments were conducted nearly three months after the point-to-point and straight-path brain control experiments. The monkey likely became more proficient at the instructed path task during the intervening time. A full analysis of normalized acquisition times for all sessions for monkey J is shown in Figure S3.
3.3. Virtual success rate
For point-to-point tasks, there can be substantial variability in the cursor trajectories across trials. We reasoned that while some of that variability might be inevitable due to stochastic spiking of neurons, users might be able to control some of it, albeit with perhaps greater effort. We examined whether the monkeys decreased the variability of the cursor movements in the face of the more demanding instructed path task. We compared the performance on the straight instructed path task to the performance on the point-to-point task. Post hoc, we calculated how many trials of the point-to-point task would have been successful had the straight path been present in those trials. We call this the ‘virtual path’. Figure 1a showed three example cursor trajectories for the point-to-point task. Trial 1 would have been deemed successful in this analysis, but trials 2 and 3 would have been deemed unsuccessful, since the cursor left the tolerance region.
Figures 8a and 8b compare monkey L’s point-to-point virtual-path success rates to the actual straight path success rates for both brain control and arm control. Under brain control (Figures 8a), the success rate of the instructed path task was significantly greater than the success rate when the virtual path was applied to the point-to-point task. This indicates that the presence of the instructed path did indeed influence this monkey to reduce the cursor variability. For arm control, the virtual success rate for the point-to-point task was not significantly different from the success rate for the straight instructed paths. This indicates that for arm movements, the presence of the path did not influence the monkey to tighten cursor movement variability (Figure 8b). It is possible that an even smaller tolerance radius would have done so. We infer from this first that, it is easier to reach with consistency than it is to move a BCI cursor with consistency, and second that with the proper incentives, BCI movement variability can be volitionally reduced, at least to some extent.
Figure 8.

Virtual success rate analysis. (a) Brain control success rates (mean and 95% confidence interval based on the Bernouilli process) with a virtual path with tolerance radius 3.5 cm. Note that the straight instructed path success rate is the monkey’s actual success rate. Success rates are significantly different. Target-to-target distance: 20 cm. Point-to-point, n = 2660 trials. Straight instructed paths, n = 1723. (b) Virtual success rates for arm control for monkey L. Same format as a. Virtual success rates for monkey L arm control are not significantly different. Target-to-target distance: 20 cm. Point-to-point, n = 1859. Straight instructed paths, n = 4259. (c) Virtual success rates for arm control for monkey J. Same format as a. We performed this analysis for instructed path trials with tolerance radii of 16 cm (n = 713) and all point-to-point trials (n = 4603). Virtual success rates for point-to-point and straight paths are significantly different.
In Figure S4a, we extend this analysis. Instead of computing the virtual success rates only at the path tolerance radius applied online, we computed the virtual success rates at a range of path tolerance radii. The results are consistent across a broad range of virtual path tolerance radii: the monkey tightened movement variability in the presence of the instructed path under brain control, but not during arm control.
We conducted the virtual success rate analysis for arm control for monkey J (Figure 8c). In contrast to monkey L, monkey J was influenced by the instructed path to reduce variability for arm control, as indicated by the higher virtual success rate for the straight instructed path task than the point-to-point task with virtual paths. This is also consistent across a broad range of tolerance radii (Figure S4b). We did not have brain control point-to-point and brain control straight path trials with matched target distances, so we were not able to perform this analysis for brain control for monkey J.
3.4. Richness of kinematics
The third benefit we propose of the instructed path task is that it elicits richer volitonally-controlled kinematics of the movement. To demonstrate this, we measured the instantaneous position and velocity of the cursor at every timestep and generated 2D histograms of the kinematic elements. These histograms for arm control are shown in Figure 9. As expected, the kinematics are similar for the point-to-point task (first columns for both monkeys) and the straight instructed path task (second columns). However, single-inflection instructed paths (third columns) provide a different set of kinematics. Combining the two types of instructed paths (fourth columns) provides a larger range of kinematics than the point-to-point task or either type of instructed path alone. By designing additional instructed paths, one could continue to increase the richness of the kinematics. Rich kinematics are important not only for showing that BCI movements can resemble arm movements in everyday life, but they can also be beneficial in basic scientific studies of neural mechanisms in M1 [24, 28–30, 32, 33]. For brain control (Figure S5), the kinematic richness in velocity is more similar across the different task types than for arm control. This is consistent with previous studies showing that there is limited speed modulation in BCI control [9,42], and it highlights an important avenue for improvement in future BCI systems.
Figure 9.

Kinematic histograms for different task types for monkey L (left) and monkey J (right) arm control. Four pairwise combinations of kinematic distributions for the arm control point-to-point task (first column for each monkey), straight instructed paths (second columns), single-inflection instructed paths (third columns), and both instructed path tasks combined (fourth columns). The data from monkey J are from the same subset of sessions shown in Figure 5a.
3.5. More challenging instructed paths
We used the instructed-path framework to finely tune the task difficulty in order to challenge the monkeys to the limits of each animal’s ability. We trained monkey J to follow double-inflection instructed paths with both brain control and arm control (Figure 10a), U-shaped instructed paths with arm control (Figure 10b), and triple-inflection paths with arm control (Figure 10c). By increasing the difficulty of the paths, we were able to uncover additional limitations of monkey J’s performance. For example, it was difficult for him to steer the cursor around the tight curves required for the double-inflection paths under brain control. Revealing such deficiencies in BCI control is important for two reasons. First, it indicates where future work aimed to improve BCI system performance is needed. Second, it informs the design of BCI user interfaces (e.g., keyboards) that take into account these deficiencies to minimize the user’s errors [20–22].
Figure 10.

Cursor trajectories from additional instructed path types for monkey J. (a) Double-inflection instructed paths. Top row, brain control. Bottom row, arm control. Target distance: 22.5 cm. (b) U-shaped instructed paths with arm control. Target distance: 15.2 cm. (c) Triple-inflection paths with arm control. Target distance: 15.2 cm. Same plotting format as Figure 3.
4. Discussion
Here, we demonstrate for the first time that monkeys can steer a BCI cursor along instructed paths. We found that the instructed path task can expose deficiencies in BCI control that may not be apparent in point-to-point tasks. Furthermore, the user can decrease BCI cursor movement variability in the face of the more demanding, instructed path task. Compared to point-to-point tasks, the instructed path task provides finer control of task difficulty, more precise knowledge of a BCI user’s movement intentions, and richer movement kinematics. These advantages of the instructed path task are important for assessing the performance limits of current BCI systems and designing future BCI systems.
BCIs have shown promise for improving the quality of life for paralyzed individuals, but BCIs cannot currently duplicate the richness and deftness of natural reaches. Recent work is closing the gap between BCI control and natural reaches (e.g., [4]), but further progress is needed on many fronts. Among them is the need for more challenging, lifelike tasks. The instructed path task is an important step in that direction. Other task alternatives to the point-to-point paradigm have been used. Especially relevant to our work is the pursuit tracking task [25, 26], in which the subject tracks a continuously-moving target with the BCI cursor. Both pursuit-tracking and instructed paths have some real-world relevance. In everyday life, we often make tracking movements (such as turning a steering wheel to follow a winding road) and movements where the trajectory can be planned before the movement begins (such as reaching for a glass of water on a cluttered table). A pursuit tracking task has the advantage of allowing us to directly study the extent to which BCI users can effectively control cursor speed. In the instructed path task, speed was manipulated only indirectly by changing the curvature of the path. An advantage of the instructed path task is that the entire movement can be pre-planned, and the neural activity during the plan stage could be decoded to improve BCI control [46].
In this work, we focused on virtual BCI effectors. BCIs are also being developed to control robotic limbs [5,6,12,13] and to restore function to the individual’s own arm [7,8] for reaching and grasping. The instructed path task could extend naturally to three dimensions to help raise the performance standard in those studies as well by prescribing the path through which the robotic limb or arm should reach.
An interesting secondary outcome of these experiments is that the two animals we studied showed individual differences [30]. Although both could complete the main tasks about equally well, one (monkey J) may have been more motivated by more challenging tasks, and as a result, we were able to train him to follow more complex paths. Another difference between the monkeys is the type of calibration procedure that we used. In our initial experiments with monkey L (data not included here), we attempted to calibrate decoders using only the observation based procedure like we did for monkey J. Doing so, we were unable to calibrate decoders that the monkey could use, and as a result, we switched to the gradual calibration procedure. We can speculate that monkey L’s cognitive processing of the observation task was different from that of monkey J, but we cannot rule out the possibility that neurons in monkey L’s motor cortex other than the ones we recorded may have been activated by the observation procedure. Nevertheless, the differences between the two monkeys highlight the need to tailor BCI systems to suit each user.
An open question is why BCI performance tends to be lower than arm control performance. There are likely at least four factors that impact brain control performance. First, the way in which BCI decoders are calibrated can influence performance [4, 47, 48]. By taking into account aspects of the closed-loop BCI control (as opposed to calibrating solely from passive observation or arm control), BCI performance can rival the performance of the natural limb [4]. We have not taken advantage of these innovations here, but this can be done in future studies. Second, BCI performance is in part determined by the user’s experience with and ability to learn to use the BCI system [14, 15, 17, 49]. Subjects have had years of experience controlling their limbs, but they typically have much less experience controlling a BCI. In a laboratory setting, users typically use one decoder for 1 – 2 hours per day, where the decoder is calibrated anew each day based on the set of neurons present (although it is also possible to use the same neurons for days to weeks [15]). Because users do not have continuous, sustained practice with a given BCI, brain control performance is likely to be lower than arm control performance. Third, many decoders, such as the Kalman filter, assume a linear relationship between movement kinematics and firing rates. However, the relationship between neural activity and natural arm movements is nonlinear. Designing a BCI decoder with a nonlinear relationship can lead to improved brain control performance [50]. Fourth, using state-of-the-art recording technologies, we are still only able to record from a small fraction of neurons involved in controlling the limbs. While this small fraction may nearly be sufficient for controlling a cursor in two dimensions [4], more neurons could help to fully close the gap in performance between arm control and brain control [51]. This is especially true as the field moves towards BCI systems with high degree-of-freedom effectors, such as robotic limbs [6,12,13].
Previous studies have shown that users can change the structure of the variability in their arm movements [52–54]. That is, users reduce their movement variability in dimensions that are relevant to the task in order to maximize performance. Our study suggests that this also holds for neural variability [55–57]. In the virtual success rate analysis (Figure 8a & S4a), we found that monkey L reduced the variability of the brain-controlled cursor movements in a manner appropriate for the task constraints. Because the cursor movements are driven directly by neural activity, this means that the animal shaped the variability of his motor cortical activity in a manner that was beneficial for task performance.
The user’s ability to shape the variability of his neural activity, and consequently the BCI cursor movements, can be used to aid the design of BCI systems intended for clinical use. For example, an important design decision in keyboard-based BCI is the keyboard layout [20–22]. By studying the ways in which user is able to reduce cursor variability using instructed paths, the keys can be placed in a way that matches the user’s cursor variability to minimize key selection errors.
In summary, to increase the clinical viability of BCI systems, developments on multiple fronts are needed. To help accelerate those developments, we introduced an instructed path task. This new task can reveal deficiencies in BCI control that are not apparent with standard point-to-point tasks. This task can inform the design of BCI user interfaces or physical workspaces, and test whether BCI users are able to demonstrate the kinematic richness of natural arm movements. The combination of novel behavioral tasks like this one with new BCI calibration methods, decoding algorithms, and recording technologies will accelerate the transition of BCIs from the lab to the clinic.
Supplementary Material
Figure vS1. Success rates for monkey J. Success rates for monkey J are presented in a different format than monkey L since there were a variety of path tolerance radii and target distances for this monkey. Each data point represents the total success rate for trials from all sessions with the given task type, tolerance radius, and target distance. Error bars represent the 95% confidence interval based on the Bernoulli process. (a) Success rate versus instructed path tolerance radius for brain control. Success rates were larger as the tolerance radius increased, with the highest success rate for the point-to-point task. The success rates for straight paths with 5 cm tolerance radius were not significantly different from each other. All other brain control success rates are significantly different from each other. For a given tolerance radius, we would expect the success rate to be greater for the straight instructed paths than for the single-inflection instructed paths. Here, the single-inflection success rate is between the straight path success rates due to differences in tolerance radius. Point-to-point, arm control calibration: n = 206 trials; Point-to-point, observation calibration: n = 8464; Straight instructed paths, tolerance radius = 3.5 cm: n = 1353; Straight instructed paths, tolerance radius = 5 cm, target distance = 22.5 cm, n = 8760; Straight instructed paths, tolerance radius = 5 cm, target distance = 22.7 cm, n = 1066; Single-inflection instructed paths: n = 9605. (b) Success rate versus instructed path tolerance radius for arm control. Success rates were similar for all three task types. We believe this similarity was due to monkey J being motivated to perform better by the increased difficulty of the instructed path task. Point-to-point: n = 4491 trials; Straight instructed paths, tolerance radius = 1.6 cm: n = 713; Straight instructed paths, tolerance radius = 1.7 cm: n = 505; Single-inflection instructed paths, tolerance radius = 1.6 cm: n = 810; Single-inflection instructed paths, tolerance radius = 1.7 cm: n = 622; Single-inflection instructed paths, tolerance radius = 3.5 cm: n = 168. All arm control single-inflection instructed path success rates are not significantly different from each other. Arm control success rate with straight instructed path and tolerance radius 1.7 cm was not significantly different from arm control success rate with single-inflection instructed path and tolerance radius 3.5 cm. All other arm control success rate comparisons were significantly different.
Figure S2. Calibration speed affects closed-loop BCI cursor speed. For monkey L, the BCI decoders analyzed in the main figures were calibrated with an observed cursor speed of 0.175 m/s. For other decoders (not analyzed in the main figures), we calibrated with an observed cursor speed of 0.20 m/s. The histograms show the closed-loop cursor speeds for each type of decoder. Vertical tick marks indicate the means of the distributions. The closed-loop speeds were significantly larger for the decoder calibrated with the larger observed cursor speeds (p < 0.05, Wilcoxon rank-sum test). Calibration speed = 0.175 m/s: n = 137,422 timesteps; Calibration speed = 0.200 m/s: n = 162,121 timesteps.
Figure S3. Normalized acquisition times for monkey J. Each data point represents the average normalized acquisition time for successful trials from all sessions with the given task type, tolerance radius, and distance between start and end target. Error bars represent mean +/− standard error. (a) Brain control normalized acquisition times. Normalized acquisition times for straight instructed path (target distance = 22.5 cm) and straight instructed path (target distance = 22.7 cm) are not statistically different (p < 0.05, Wilcoxon rank-sum test). All other comparisons are significantly different. For the point-to-point task under brain control, monkey J had a shorter normalized acquisition time when the decoder was calibrated using the arm control instructed-path task than when it was calibrated using observation. This difference may be due to the specific parameters of the observation task. If we had increased the speed of the cursor that the monkey observed, then the monkey likely would have been able to move the cursor faster (Figure S2). Point-to-point, arm control calibration: n = 206 successful trials; Point-to-point, observation calibration: n = 8417; Straight instructed paths, tolerance radius = 3.5 cm, target distance = 22.5 cm: n = 813; Straight instructed paths, tolerance radius = 5 cm, target distance = 22.5 cm: n = 6690; Straight instructed paths, tolerance radius = 5 cm, target distance = 22.7 cm: n = 839; Single-inflection instructed paths: n = 6631. (b) Arm control normalized acquisition times. Similar to monkey L, normalized acquisition times increase as task difficulty increases for a given target distance (point-to-point < straight instructed paths < single-inflection instructed paths). Normalized acquisition time decreased for single-inflection paths as the target distance and tolerance radius increased. All normalized acquisition time comparisons were significantly different (p < 0.05, Wilcoxon rank-sum test) except for straight instructed paths (radius = 1.6 cm) and straight instructed paths (radius = 1.7 cm). Point-to-point: n = 4087 successful trials; Straight instructed paths, tolerance radius = 1.6 cm: n = 628; Straight instructed paths, tolerance radius = 1.7 cm: n = 478; Straight instructed paths, tolerance radius = 3.5 cm: n = 131; Single-inflection instructed paths, tolerance radius = 1.6 cm: n = 629; Single-inflection instructed paths, tolerance radius = 1.7 cm: n = 412.
Figure S4. Virtual success rates across a wide range of virtual path tolerance radii. (a) Virtual success rates monkey L brain control. Solid lines are the mean virtual success rates, and the band is the 95% confidence interval based on the Bernoulli process. Dashed line is the tolerance radius that was applied online. Green bar, tolerance radii for which the virtual success rate for straight instructed path trials was significantly different than that for point-to-point trials. Target-to-target distance: 20 cm. Brain-control point-to-point, n = 2660 trials; Brain control straight instructed paths, n = 1723. (b) Virtual success rates for monkey L arm control. Same plotting format as a. Target-to-target distance: 20 cm. Arm control point-to-point, n = 1859; Arm control straight instructed paths, n = 4259. (c) Virtual success rates for monkey J arm control. Same plotting format as a. Point-to-point, n = 4603 trials; Straight instructed paths, n = 713.
Figure S5. Kinematic histograms for different task types for monkey L (left) and monkey J (right) brain control. Same plotting format as Figure 9 (which shows kinematic histograms for arm control). The data from monkey J are from the same subset of sessions shown in Figure 5b.
Table S1: Task types and decoding parameters for every session. Sessions are listed in chronological order. All distances and radii are in cm. 1a = arm control, b = brain control. 2pp = point-to-point task, ip = instructed path task. 3This is the straight-line distance from the center of the start target to the center of the end target. 4start target display radius, end target display radius. 5start target tolerance radius, end target tolerance radius, path tolerance radius (if applicable); numbers in parentheses indicate different radii used in the same session. 6m = modified Kalman filter, s = standard Kalman filter; number in parentheses is p, the dimensionality of the factor analysis model; number after comma is r, the number of decoded kinematic parameters. If multiple decoders were used in a session, the decoder parameters are separated by a semi-colon. 7a = arm control (monkey J, method 1), o = observation (monkey J, method 2), g = gradual procedure (monkey L).
Acknowledgments
We thank R. Dum for advice on array placement and K. Quick for help with animal training. This work was funded by NIH NICHD CRCNS R01-HD071686 (B.M.Y. and A.P.B.), the Craig H. Neilsen Foundation (B.M.Y. and A.P.B.), NIH NINDS R01-NS065065 (A.P.B.), Burroughs Wellcome Fund (A.P.B.), NSF DGE-0549352 (P.T.S.) and NIH P30-NS076405 (Systems Neuroscience Institute).
Contributor Information
B M Yu, Email: byronyu@cmu.edu.
A P Batista, Email: apb10@pitt.edu.
References
- 1.Serruya Mijail D, Hatsopoulos Nicholas G, Paninski Liam, Fellows Matthew R, Donoghue John P. Instant neural control of a movement signal. Nature. 2002 Mar;416(6877):141–2. doi: 10.1038/416141a. [DOI] [PubMed] [Google Scholar]
- 2.Taylor Dawn M, Tillery Stephen I Helms, Schwartz Andrew B. Direct cortical control of 3D neuroprosthetic devices. Science (80-) 2002;296(5574):1829–32. doi: 10.1126/science.1070291. [DOI] [PubMed] [Google Scholar]
- 3.Mulliken Grant H, Musallam Sam, Andersen Richard A. Decoding trajectories from posterior parietal cortex ensembles. J Neurosci. 2008;28(48):12913–12926. doi: 10.1523/JNEUROSCI.1463-08.2008. [DOI] [PMC free article] [PubMed] [Google Scholar]
- 4.Gilja Vikash, Nuyujukian Paul, Chestek Cindy A, Cunningham John P, Yu Byron M, Fan Joline M, Churchland Mark M, Kaufman Matthew T, Kao Jonathan C, Ryu Stephen I, Shenoy Krishna V. A high-performance neural prosthesis enabled by control algorithm design. Nat Neurosci. 2012 Nov;15(12):1–49. doi: 10.1038/nn.3265. [DOI] [PMC free article] [PubMed] [Google Scholar]
- 5.Carmena Jose M, Lebedev Mikhail A, Crist RE, O’Doherty Joseph E, Santucci DM, Dimitrov Dragan F, Patil PG, Henriquez Craig S, Nicolelis Miguel AL. Learning to control a brain-machine interface for reaching and grasping by primates. PLoS Biol. 2003;13:0000042. doi: 10.1371/journal.pbio.0000042. [DOI] [PMC free article] [PubMed] [Google Scholar]
- 6.Velliste Meel, Perel Sagi, Chance Spalding M, Whitford Andrew S, Schwartz Andrew B. Cortical control of a prosthetic arm for self-feeding. Nature. 2008;453(7198):1098–1101. doi: 10.1038/nature06996. [DOI] [PubMed] [Google Scholar]
- 7.Ethier Christian, Oby Emily R, Bauman MJ, Miller Lee E. Restoration of grasp following paralysis through brain-controlled stimulation of muscles. Nature. 2012 Apr;:1–4. doi: 10.1038/nature10987. [DOI] [PMC free article] [PubMed] [Google Scholar]
- 8.Zimmermann Jonas B, Jackson Andrew. Closed-loop control of spinal cord stimulation to restore hand function after paralysis. Front Neurosci. 2014 May;8(May):1–8. doi: 10.3389/fnins.2014.00087. [DOI] [PMC free article] [PubMed] [Google Scholar]
- 9.Kim Sung-Phil, Simeral John D, Hochberg Leigh R, Donoghue John P, Black Michael J. Neural control of computer cursor velocity by decoding motor cortical spiking activity in humans with tetraplegia. J Neural Eng. 2008;5:455–476. doi: 10.1088/1741-2560/5/4/010. [DOI] [PMC free article] [PubMed] [Google Scholar]
- 10.Schalk G, Miller KJ, Anderson NR, Wilson Ja, Smyth MD, Ojemann JG, Moran DW, Wolpaw JR, Leuthardt EC. Two-dimensional movement control using electrocorticographic signals in humans. J Neural Eng. 2008 Mar;5(1):75–84. doi: 10.1088/1741-2560/5/1/008. [DOI] [PMC free article] [PubMed] [Google Scholar]
- 11.Wang Wei, Collinger Jennifer L, Degenhart Alan D, Tyler-Kabara Elizabeth C, Schwartz Andrew B, Moran Daniel W, Weber Douglas J, Wodlinger Brian, Vinjamuri Ramana K, Ashmore Robin C, Kelly John W, Boninger Michael L. An Electrocorticographic Brain Interface in an Individual with Tetraplegia. PLoS One. 2013 Jan;8(2):e55344. doi: 10.1371/journal.pone.0055344. [DOI] [PMC free article] [PubMed] [Google Scholar]
- 12.Hochberg Leigh R, Bacher Daniel, Jarosiewicz Beata, Masse Nicolas Y, Simeral John D, Vogel Joern, Haddadin Sami, Liu Jie, Cash Sydney S, van der Smagt Patrick, Donoghue John P. Reach and grasp by people with tetraplegia using a neurally controlled robotic arm. Nature. 2012 May;485(7398):372–375. doi: 10.1038/nature11076. [DOI] [PMC free article] [PubMed] [Google Scholar]
- 13.Collinger Jennifer L, Wodlinger Brian, Downey John E, Wang Wei, Tyler-Kabara Elizabeth C, Weber Douglas J, Mcmorland Angus JC, Velliste Meel, Boninger Michael L, Schwartz Andrew B. High-performance neuroprosthetic control by an individual with tetraplegia. Lancet. 2012;6736(12) doi: 10.1016/S0140-6736(12)61816-9. [DOI] [PMC free article] [PubMed] [Google Scholar]
- 14.Jarosiewicz Beata, Chase Steven M, Fraser George W, Velliste Meel, Kass RE, Schwartz Andrew B. Functional network reorganization during learning in a brain-computer interface paradigm. Proc Natl Acad Sci. 2008;105(49):19486–19491. doi: 10.1073/pnas.0808113105. [DOI] [PMC free article] [PubMed] [Google Scholar]
- 15.Ganguly Karunesh, Carmena Jose M. Emergence of a stable cortical map for neuroprosthetic control. PLoS Biol. 2009;7(7):e1000153. doi: 10.1371/journal.pbio.1000153. [DOI] [PMC free article] [PubMed] [Google Scholar]
- 16.Golub Matthew D, Chase Steven M, Yu Byron M. Learning an Internal Dynamics Model from Control Demonstration. Proc 30th Int Conf Mach Learn. 2013 Jan;28:606–614. [PMC free article] [PubMed] [Google Scholar]
- 17.Sadtler Patrick T, Quick Kristin M, Golub Matthew D, Chase Steven M, Ryu Stephen I, Tyler-Kabara Elizabeth C, Yu Byron M, Batista Aaron P. Neural constraints on learning. Nature. 2014;512:423–426. doi: 10.1038/nature13665. [DOI] [PMC free article] [PubMed] [Google Scholar]
- 18.Chase Steven M, Schwartz Andrew B, Kass RE. Bias, optimal linear estimation, and the differences between open-loop simulation and closed-loop performance of spiking-based brain-computer interface algorithms. Neural Networks. 2009;22:1203–1312. doi: 10.1016/j.neunet.2009.05.005. [DOI] [PMC free article] [PubMed] [Google Scholar]
- 19.Thompson David E, Quitadamo Lucia R, Mainardi Luca, Laghari Khalil Ur Rehman, Gao Shangkai, Kindermans Pieter-Jan, Simeral John D, Fazel-Rezai Reza, Matteucci Matteo, Falk Tiago H, Bianchi Luigi, Chestek Cynthia a, Huggins Jane E. Performance measurement for brain-computer or brain-machine interfaces: a tutorial. J Neural Eng. 2014 Jun;11(3):035001. doi: 10.1088/1741-2560/11/3/035001. [DOI] [PMC free article] [PubMed] [Google Scholar]
- 20.Cunningham John P, Yu Byron M, Gilja Vikash, Ryu Stephen I, Shenoy Krishna V. Toward optimal target placement for neural prosthetic devices. J Neurophysiol. 2008 Dec;100(6):3445–57. doi: 10.1152/jn.90833.2008. [DOI] [PMC free article] [PubMed] [Google Scholar]
- 21.Nuyujukian Paul, Fan Joline M, Kao Jonathan C, Ryu Stephen I, Shenoy Krishna V. A high-performance keyboard neural prosthesis enabled by task optimization. IEEE Trans Biomed Eng. 2014 Sep;9294(c):1–9. doi: 10.1109/TBME.2014.2354697. [DOI] [PMC free article] [PubMed] [Google Scholar]
- 22.Bacher Daniel, Jarosiewicz Beata, Masse Nicolas Y, Stavisky Sergey D, Simeral John D, Newell Katherine, Oakley Erin M, Cash Sydney S, Friehs Gerhard, Hochberg Leigh R. Neural Point-and-Click Communication by a Person With Incomplete Locked-In Syndrome. Neurorehabil Neural Repair. 2014 Nov; doi: 10.1177/1545968314554624. [DOI] [PMC free article] [PubMed] [Google Scholar]
- 23.Ashe J, Georgopoulos Apostolos P. Movement parameters and neural activity in motor cortex and area 5. Cereb cortex. 1994;4(6):590–600. doi: 10.1093/cercor/4.6.590. [DOI] [PubMed] [Google Scholar]
- 24.Paninski Liam, Fellows Matthew R, Hatsopoulos Nicholas G, Donoghue John P. Spatiotemporal Tuning of Motor Cortical Neurons for Hand Position and Velocity. J Neurophysiol. 2004;91:515–532. doi: 10.1152/jn.00587.2002. [DOI] [PubMed] [Google Scholar]
- 25.Hochberg Leigh R, Serruya Mijail D, Friehs Gerhard M, Mukand Jon a, Saleh Maryam, Caplan Abraham H, Branner Almut, Chen David, Penn Richard D, Donoghue John P. Neuronal ensemble control of prosthetic devices by a human with tetraplegia. Nature. 2006 Jul;442(7099):164–171. doi: 10.1038/nature04970. [DOI] [PubMed] [Google Scholar]
- 26.Wu Wei, Gao Yun, Bienenstock Elie, Donoghue John P, Black Michael J. Bayesian population decoding of motor cortical activity using a Kalman filter. Neural Comput. 2006 Jan;18(1):80–118. doi: 10.1162/089976606774841585. [DOI] [PubMed] [Google Scholar]
- 27.Suminski Aaron J, Tkach Dennis C, Fagg Andrew H, Hatsopoulos Nicholas G. Incorporating Feedback from Multiple Sensory Modalities Enhances Brain Machine Interface Control. J Neurosci. 2010;30(50):16777–16787. doi: 10.1523/JNEUROSCI.3967-10.2010. [DOI] [PMC free article] [PubMed] [Google Scholar]
- 28.Hocherman S, Wise SP. Effects of hand movement path on motor cortical activity in awake, behaving rhesus monkeys. Exp Brain Res. 1991 Jan;83(2):285–302. doi: 10.1007/BF00231153. [DOI] [PubMed] [Google Scholar]
- 29.Churchland Mark M, Cunningham John P, Kaufman Matthew T, Foster Justin D, Nuyujukian Paul, Ryu Stephen I, Shenoy Krishna V. Neural population dynamics during reaching. Nature. 2012 Jul;487(7405):51–56. doi: 10.1038/nature11129. [DOI] [PMC free article] [PubMed] [Google Scholar]
- 30.Pearce Thomas M, Moran Daniel W. Strategy-Dependent Encoding of Planned Arm Movements in the Dorsal Premotor Cortex. Science (80- ) 2012 Jul;(July) doi: 10.1126/science.1220642. [DOI] [PMC free article] [PubMed] [Google Scholar]
- 31.Georgopoulos AP, Kalaska JF, Caminiti R, Massey JT. Interruption of motor cortical discharge subserving aimed arm movements. Exp Brain Res. 1983:327–340. doi: 10.1007/BF00238775. [DOI] [PubMed] [Google Scholar]
- 32.Archambault Philippe S, Caminiti Roberto, Battaglia-Mayer Alexandra. Cortical mechanisms for online control of hand movement trajectory: the role of the posterior parietal cortex. Cereb Cortex. 2009 Dec;19(12):2848–64. doi: 10.1093/cercor/bhp058. [DOI] [PubMed] [Google Scholar]
- 33.Schwartz Andrew B. Direct Cortical Representation of Drawing. Science (80- ) 1994;265(5171):540–542. doi: 10.1126/science.8036499. [DOI] [PubMed] [Google Scholar]
- 34.Schwartz Andrew B, Moran Daniel W, Anthony Reina G. Differential representation of perception and action in the frontal cortex. Science (80- ) 2004;303(5656):380–383. doi: 10.1126/science.1087788. [DOI] [PubMed] [Google Scholar]
- 35.Sadtler Patrick T, Ryu Stephen I, Yu Byron M, Batista Aaron P. High-performance neural prosthetic control along instructed paths. Proc. 5th Int. IEEE EMBS Conf. Neural Eng; Cancun. 2011. pp. 601–604. [Google Scholar]
- 36.MacKay David JC. Inf Theory, Inference Learn Algorithms. chapter 37. Cambridge University Press; Cambridge: 2003. Bayesian Inference and Sampling Theory; pp. 457–466. [Google Scholar]
- 37.Santhanam Gopal, Yu Byron M, Gilja Vikash, Ryu Stephen I, Afshar Afsheen, Sahani Maneesh, Shenoy Krishna V. Factor-Analysis Methods for Higher-Performance Neural Prostheses. J Neurophysiol. 2009;102:1315–1330. doi: 10.1152/jn.00097.2009. [DOI] [PMC free article] [PubMed] [Google Scholar]
- 38.Tkach Dennis, Reimer Jake, Hatsopoulos Nicholas G. Observation-based learning for brain-machine interfaces. Curr Opin Neurobiol. 2008 Dec;18(6):589–94. doi: 10.1016/j.conb.2008.09.016. [DOI] [PMC free article] [PubMed] [Google Scholar]
- 39.Nuyujukian Paul, Fan Joline M, Gilja Vikash, Kalanithi Paul S, Chestek Cindy a, Shenoy Krishna V. Monkey models for brain-machine interfaces: the need for maintaining diversity. Conf Proc IEEE Eng Med Biol Soc. 2011 Jan;2011:1301–5. doi: 10.1109/IEMBS.2011.6090306. [DOI] [PubMed] [Google Scholar]
- 40.Orsborn Amy L, Dangi Siddharth, Moorman Helene G, Carmena Jose M. Closed-loop decoder adaptation on intermediate time-scales facilitates rapid BMI performance improvements independent of decoder initialization conditions. IEEE Trans neural Syst Rehabil Eng. 2012 Jul;20(4):468–77. doi: 10.1109/TNSRE.2012.2185066. [DOI] [PubMed] [Google Scholar]
- 41.Fitts PM. The information capacity of the human motor system in controlling the amplitude of movement. J Exp Psychol Gen. 1954 Sep;121(3):262–9. doi: 10.1037//0096-3445.121.3.262. [DOI] [PubMed] [Google Scholar]
- 42.Golub Matthew D, Yu Byron M, Schwartz Andrew B, Chase Steven M. Motor cortical control of movement speed with implications for brain-machine interface control. J Neurophysiol. 2014 Apr;112(April):411–429. doi: 10.1152/jn.00391.2013. [DOI] [PMC free article] [PubMed] [Google Scholar]
- 43.Lacquaniti F, Terzuolo C, Viviani P. The law relating the kinematic and figural aspects of drawing movements. Acta Psychol (Amst) 1983;54:115–130. doi: 10.1016/0001-6918(83)90027-6. [DOI] [PubMed] [Google Scholar]
- 44.Gowda Suraj, Orsborn Amy L, Overduin Simon a, Moorman Helene G, Carmena Jose M. Designing dynamical properties of brain-machine interfaces to optimize task-specific performance. IEEE Trans neural Syst Rehabil Eng. 2014 Sep;22(5):911–20. doi: 10.1109/TNSRE.2014.2309673. [DOI] [PubMed] [Google Scholar]
- 45.Churchland Mark M, Santhanam Gopal, Shenoy Krishna V. Preparatory activity in premotor and motor cortex reflects the speed of the upcoming reach. J Neurophysiol. 2006 Dec;96(6):3130–3146. doi: 10.1152/jn.00307.2006. [DOI] [PubMed] [Google Scholar]
- 46.Yu Byron M, Kemere Caleb T, Santhanam Gopal, Afshar Afsheen, Ryu Stephen I, Meng Teresa H, Sahani Maneesh, Shenoy Krishna V. Mixture of Trajectory Models for Neural Decoding of Goal-Directed Movements. J Neurophysiol. 2007;97:3763–3780. doi: 10.1152/jn.00482.2006. [DOI] [PubMed] [Google Scholar]
- 47.Jarosiewicz Beata, Masse Nicolas Y, Bacher Daniel, Cash Sydney S, Eskandar Emad, Friehs Gerhard, Donoghue John P, Hochberg Leigh R. Advantages of closed-loop calibration in intracortical brain-computer interfaces for people with tetraplegia. J Neural Eng. 2013 Aug;10(4):046012. doi: 10.1088/1741-2560/10/4/046012. [DOI] [PMC free article] [PubMed] [Google Scholar]
- 48.Dangi Siddharth, Gowda Suraj, Moorman Helene G, Orsborn Amy L, So Kelvin, Shanechi Maryam, Carmena Jose M. Continuous closed-loop decoder adaptation with a recursive maximum likelihood algorithm allows for rapid performance acquisition in brain-machine interfaces. Neural Comput. 2014 Sep;26(9):1811–39. doi: 10.1162/NECO_a_00632. [DOI] [PubMed] [Google Scholar]
- 49.Shenoy Krishna V, Carmena Jose M. Combining Decoder Design and Neural Adaptation in Brain-Machine Interfaces. Neuron. 2014 Nov;84(4):665–680. doi: 10.1016/j.neuron.2014.08.038. [DOI] [PubMed] [Google Scholar]
- 50.Sussillo David, Nuyujukian Paul, Fan Joline M, Kao Jonathan C, Stavisky Sergey D, Ryu Stephen, Shenoy Krishna. A recurrent neural network for closed-loop intracortical brain-machine interface decoders. J Neural Eng. 2012 Apr;9(2):026027. doi: 10.1088/1741-2560/9/2/026027. [DOI] [PMC free article] [PubMed] [Google Scholar]
- 51.Schwarz David a, Lebedev Mikhail a, Hanson Timothy L, Dimitrov Dragan F, Lehew Gary, Meloy Jim, Rajangam Sankaranarayani, Subramanian Vivek, Ifft Peter J, Li Zheng, Ramakrishnan Arjun, Tate Andrew, Zhuang Katie Z, Nicolelis Miguel aL. Chronic, wireless recordings of large-scale brain activity in freely moving rhesus monkeys. Nat Methods. 2014 Jun;11(6):670–676. doi: 10.1038/nmeth.2936. [DOI] [PMC free article] [PubMed] [Google Scholar]
- 52.Todorov Emanuel, Jordan MI. Optimal feedback control as a theory of motor coordination. Nat Neurosci. 2002;5(11):1226–1235. doi: 10.1038/nn963. [DOI] [PubMed] [Google Scholar]
- 53.Diedrichsen Jörn. Optimal task-dependent changes of bimanual feedback control and adaptation. Curr Biol. 2007 Oct;17(19):1675–9. doi: 10.1016/j.cub.2007.08.051. [DOI] [PMC free article] [PubMed] [Google Scholar]
- 54.van Beers Robert J, Brenner Eli, Smeets Jeroen BJ. Random walk of motor planning in task-irrelevant dimensions. J Neurophysiol. 2013 Feb;109(4):969–77. doi: 10.1152/jn.00706.2012. [DOI] [PubMed] [Google Scholar]
- 55.van Beers Robert J, Haggard Patrick, Wolpert Daniel M, Van Beers, Robert J. The Role of Execution Noise in Movement Variability. J Neurophysiol. 2004;91:1050–1063. doi: 10.1152/jn.00652.2003. [DOI] [PubMed] [Google Scholar]
- 56.Churchland Mark M, Afshar Afsheen, Shenoy Krishna V. A central source of movement variability. Neuron. 2006 Dec;52(6):1085–96. doi: 10.1016/j.neuron.2006.10.034. [DOI] [PMC free article] [PubMed] [Google Scholar]
- 57.Chaisanguanthum Kris S, Shen Helen H, Sabes Philip N. Motor variability arises from a slow random walk in neural state. J Neurosci. 2014 Sep;34(36):12071–80. doi: 10.1523/JNEUROSCI.3001-13.2014. [DOI] [PMC free article] [PubMed] [Google Scholar]
- 58.Dempster AP, Laird NM, Rubin DB. Maximum Likelihood from Incomplete Data via the EM Algorithm. J R Stat Soc. 1977;39 [Google Scholar]
Associated Data
This section collects any data citations, data availability statements, or supplementary materials included in this article.
Supplementary Materials
Figure vS1. Success rates for monkey J. Success rates for monkey J are presented in a different format than monkey L since there were a variety of path tolerance radii and target distances for this monkey. Each data point represents the total success rate for trials from all sessions with the given task type, tolerance radius, and target distance. Error bars represent the 95% confidence interval based on the Bernoulli process. (a) Success rate versus instructed path tolerance radius for brain control. Success rates were larger as the tolerance radius increased, with the highest success rate for the point-to-point task. The success rates for straight paths with 5 cm tolerance radius were not significantly different from each other. All other brain control success rates are significantly different from each other. For a given tolerance radius, we would expect the success rate to be greater for the straight instructed paths than for the single-inflection instructed paths. Here, the single-inflection success rate is between the straight path success rates due to differences in tolerance radius. Point-to-point, arm control calibration: n = 206 trials; Point-to-point, observation calibration: n = 8464; Straight instructed paths, tolerance radius = 3.5 cm: n = 1353; Straight instructed paths, tolerance radius = 5 cm, target distance = 22.5 cm, n = 8760; Straight instructed paths, tolerance radius = 5 cm, target distance = 22.7 cm, n = 1066; Single-inflection instructed paths: n = 9605. (b) Success rate versus instructed path tolerance radius for arm control. Success rates were similar for all three task types. We believe this similarity was due to monkey J being motivated to perform better by the increased difficulty of the instructed path task. Point-to-point: n = 4491 trials; Straight instructed paths, tolerance radius = 1.6 cm: n = 713; Straight instructed paths, tolerance radius = 1.7 cm: n = 505; Single-inflection instructed paths, tolerance radius = 1.6 cm: n = 810; Single-inflection instructed paths, tolerance radius = 1.7 cm: n = 622; Single-inflection instructed paths, tolerance radius = 3.5 cm: n = 168. All arm control single-inflection instructed path success rates are not significantly different from each other. Arm control success rate with straight instructed path and tolerance radius 1.7 cm was not significantly different from arm control success rate with single-inflection instructed path and tolerance radius 3.5 cm. All other arm control success rate comparisons were significantly different.
Figure S2. Calibration speed affects closed-loop BCI cursor speed. For monkey L, the BCI decoders analyzed in the main figures were calibrated with an observed cursor speed of 0.175 m/s. For other decoders (not analyzed in the main figures), we calibrated with an observed cursor speed of 0.20 m/s. The histograms show the closed-loop cursor speeds for each type of decoder. Vertical tick marks indicate the means of the distributions. The closed-loop speeds were significantly larger for the decoder calibrated with the larger observed cursor speeds (p < 0.05, Wilcoxon rank-sum test). Calibration speed = 0.175 m/s: n = 137,422 timesteps; Calibration speed = 0.200 m/s: n = 162,121 timesteps.
Figure S3. Normalized acquisition times for monkey J. Each data point represents the average normalized acquisition time for successful trials from all sessions with the given task type, tolerance radius, and distance between start and end target. Error bars represent mean +/− standard error. (a) Brain control normalized acquisition times. Normalized acquisition times for straight instructed path (target distance = 22.5 cm) and straight instructed path (target distance = 22.7 cm) are not statistically different (p < 0.05, Wilcoxon rank-sum test). All other comparisons are significantly different. For the point-to-point task under brain control, monkey J had a shorter normalized acquisition time when the decoder was calibrated using the arm control instructed-path task than when it was calibrated using observation. This difference may be due to the specific parameters of the observation task. If we had increased the speed of the cursor that the monkey observed, then the monkey likely would have been able to move the cursor faster (Figure S2). Point-to-point, arm control calibration: n = 206 successful trials; Point-to-point, observation calibration: n = 8417; Straight instructed paths, tolerance radius = 3.5 cm, target distance = 22.5 cm: n = 813; Straight instructed paths, tolerance radius = 5 cm, target distance = 22.5 cm: n = 6690; Straight instructed paths, tolerance radius = 5 cm, target distance = 22.7 cm: n = 839; Single-inflection instructed paths: n = 6631. (b) Arm control normalized acquisition times. Similar to monkey L, normalized acquisition times increase as task difficulty increases for a given target distance (point-to-point < straight instructed paths < single-inflection instructed paths). Normalized acquisition time decreased for single-inflection paths as the target distance and tolerance radius increased. All normalized acquisition time comparisons were significantly different (p < 0.05, Wilcoxon rank-sum test) except for straight instructed paths (radius = 1.6 cm) and straight instructed paths (radius = 1.7 cm). Point-to-point: n = 4087 successful trials; Straight instructed paths, tolerance radius = 1.6 cm: n = 628; Straight instructed paths, tolerance radius = 1.7 cm: n = 478; Straight instructed paths, tolerance radius = 3.5 cm: n = 131; Single-inflection instructed paths, tolerance radius = 1.6 cm: n = 629; Single-inflection instructed paths, tolerance radius = 1.7 cm: n = 412.
Figure S4. Virtual success rates across a wide range of virtual path tolerance radii. (a) Virtual success rates monkey L brain control. Solid lines are the mean virtual success rates, and the band is the 95% confidence interval based on the Bernoulli process. Dashed line is the tolerance radius that was applied online. Green bar, tolerance radii for which the virtual success rate for straight instructed path trials was significantly different than that for point-to-point trials. Target-to-target distance: 20 cm. Brain-control point-to-point, n = 2660 trials; Brain control straight instructed paths, n = 1723. (b) Virtual success rates for monkey L arm control. Same plotting format as a. Target-to-target distance: 20 cm. Arm control point-to-point, n = 1859; Arm control straight instructed paths, n = 4259. (c) Virtual success rates for monkey J arm control. Same plotting format as a. Point-to-point, n = 4603 trials; Straight instructed paths, n = 713.
Figure S5. Kinematic histograms for different task types for monkey L (left) and monkey J (right) brain control. Same plotting format as Figure 9 (which shows kinematic histograms for arm control). The data from monkey J are from the same subset of sessions shown in Figure 5b.
Table S1: Task types and decoding parameters for every session. Sessions are listed in chronological order. All distances and radii are in cm. 1a = arm control, b = brain control. 2pp = point-to-point task, ip = instructed path task. 3This is the straight-line distance from the center of the start target to the center of the end target. 4start target display radius, end target display radius. 5start target tolerance radius, end target tolerance radius, path tolerance radius (if applicable); numbers in parentheses indicate different radii used in the same session. 6m = modified Kalman filter, s = standard Kalman filter; number in parentheses is p, the dimensionality of the factor analysis model; number after comma is r, the number of decoded kinematic parameters. If multiple decoders were used in a session, the decoder parameters are separated by a semi-colon. 7a = arm control (monkey J, method 1), o = observation (monkey J, method 2), g = gradual procedure (monkey L).