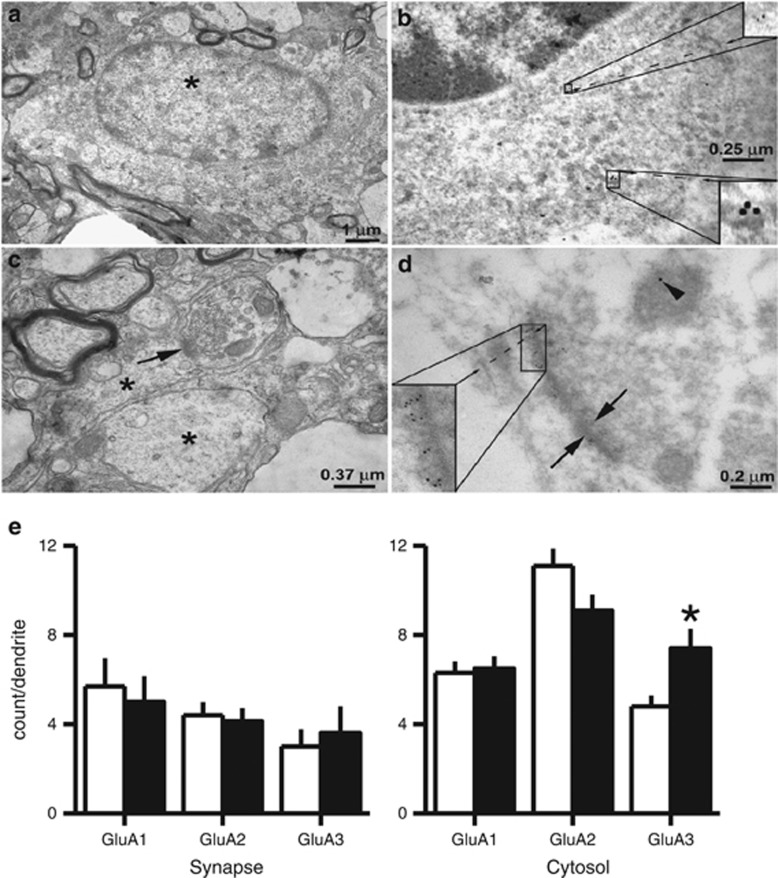
Figure 4.
Electron microscopy of the VTA showing PE increases the expression of GluA3 subunits in VTA DA neuron dendrites. (a) illustrates an electron micrograph of a VTA neuron soma with nucleus. (b) Immunoreactivity for GluA1 and TH. Inset at the lower right shows TH labeling with 15 nm particles. Inset at upper right shows GluA1 labeling with 6 nm particles. (c) Electron micrograph of dendrites (asterisks) and a synapse (arrow) in a TH-positive neuron. (d) GluA2 immunoreactivity (6 nm particles shown at the inset in the lower left) in a synapse (arrows) located in a TH-positive dendrite (arrowhead). (e) Bar graphs showing the average GluA1, GluA2, and GluA3 subunit count/dendrite. In PE animals, the count of GluA3 subunits is significantly higher in the cytosol than that in control animals (*P<0.05, differences between control and PE animals).

